1. Image: Landsat 5, USGS. September 16th, 1994. Shown in true color. Image: Landsat 8, USGS. October 12th, 2015. Shown in true color.
The Fall of Lake Mead
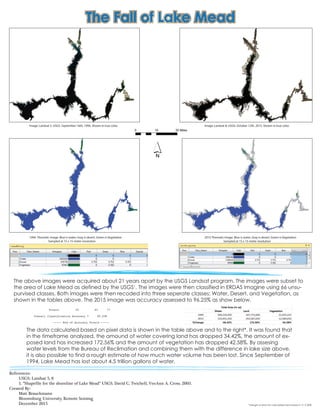
1994 Thematic Image. Blue is water, Gray is desert, Green is Vegetation
Sampled at 15 x 15 meter resolution
2015 Thematic Image. Blue is water, Gray is desert, Green is Vegetation
Sampled at 15 x 15 meter resolution
The above images were acquired about 21 years apart by the USGS Landsat program. The images were subset to
the area of Lake Mead as defined by the USGS1
. The images were then classified in ERDAS Imagine using 66 unsu-
purvised classes. Both images were then recoded into three seperate classes: Water, Desert, and Vegetation, as
shown in the tables above. The 2015 image was accuracy assessed to 96.25% as show below.
The data calculated based on pixel data is shown in the table above and to the right*. It was found that
in the timeframe analyzed, the amound of water covering land has dropped 34.42%, the amount of ex-
posed land has increased 172.56% and the amount of vegetation has dropped 42.58%. By assesing
water levels from the Bureau of Reclimation and combining them with the difference in lake size above,
it is also possible to find a rough estimate of how much water volume has been lost. Since September of
1994, Lake Mead has lost about 4.5 trillion gallons of water.
References:
USGS: Landsat 5, 8
1. “Shapefile for the shoreline of Lake Mead” USGS. David C. Twichell, VeeAnn A. Cross. 2003.
Created By:
Matt Brauckmann
Bloomsburg University, Remote Sensing
December 2015 *Margin of error for calculated land areas is +/- 0.20%.
0 10 20 Miles
´