EIA's Monthly Drilling Productiviy Report - Dec 2013
•
1 gefällt mir•1,163 views

The Drilling Productivity Report uses recent data on the total number of drilling rigs in operation along with estimates of drilling productivity and estimated changes in production from existing oil and natural gas wells to provide estimated changes in oil and natural gas production for six key fields. EIA's approach does not distinguish between oil-directed rigs and gas-directed rigs because once a well is completed it may produce both oil and gas; more than half of the wells produce both.

Empfohlen
Empfohlen
Weitere ähnliche Inhalte
Was ist angesagt?
Was ist angesagt? (18)
Andere mochten auch
Andere mochten auch (7)
Ähnlich wie EIA's Monthly Drilling Productiviy Report - Dec 2013
Ähnlich wie EIA's Monthly Drilling Productiviy Report - Dec 2013 (13)
Mehr von Marcellus Drilling News
Mehr von Marcellus Drilling News (20)
Kürzlich hochgeladen
Kürzlich hochgeladen (14)
EIA's Monthly Drilling Productiviy Report - Dec 2013
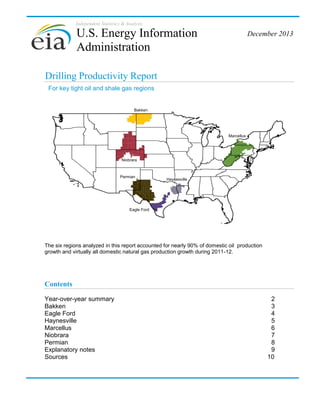
- 1. Independent Statistics & Analysis U.S. Energy Information Administration December 2013 Drilling Productivity Report For key tight oil and shale gas regions Bakken Marcellus Niobrara Permian Haynesville Eagle Ford The six regions analyzed in this report accounted for nearly 90% of domestic oil production growth and virtually all domestic natural gas production growth during 2011-12. Contents Year-over-year summary Bakken Eagle Ford Haynesville Marcellus Niobrara Permian Explanatory notes Sources 2 3 4 5 6 7 8 9 10
- 2. Year-over-year summary December 2013 drilling data through November projected production through January Drilling Productivity Report New-well oil production per rig New-well gas production per rig barrels/day thousand cubic feet/day January-2013 January-2014 January-2013 1,000 January-2014 6,000 5,000 750 4,000 3,000 500 2,000 250 1,000 0 0 Bakken Eagle Ford Haynesville Marcellus Niobrara Legacy oil production change Eagle Ford Haynesville Marcellus Niobrara Permian Marcellus Niobrara Permian Legacy gas production change thousand barrels/day Bakken Bakken Permian million cubic feet/day Eagle Ford Haynesville Marcellus Niobrara Permian 0 Bakken Eagle Ford Haynesville 0 (50) (10) (100) (20) (150) (30) (200) (40) (250) (300) (50) (350) (60) (400) January-2013 January-2014 (450) (70) January-2013 January-2014 Indicated monthly change in oil production (Jan vs. Dec) Indicated monthly change in gas production (Jan vs. Dec) thousand barrels/day million cubic feet/day January-2013 January-2013 January-2014 January-2014 500 40 400 30 300 20 200 10 0 100 -10 0 -20 -100 -30 -200 -300 -40 Bakken Eagle Ford Haynesville Marcellus Niobrara Bakken Permian Eagle Ford Haynesville Oil production Niobrara Permian Natural gas production thousand barrels/day Marcellus million cubic feet/day January-2013 January-2013 January-2014 2,000 12,000 1,600 January-2014 10,000 8,000 1,200 6,000 800 4,000 400 2,000 0 0 Bakken Eagle Ford Haynesville Marcellus Niobrara Permian U. S. Energy Information Administration | Drilling Productivity Report Bakken Eagle Ford Haynesville Marcellus Niobrara Permian 2
- 3. Bakken December 2013 drilling data through November projected production through January Drilling Productivity Report 508 494 Oil +14 barrels/day month over month Monthly additions from one average rig January December barrels/day Bakken New-well oil production per rig Rig count rigs barrels/day 600 December Bakken New-well gas production per rig 200 400 thousand cubic feet/day month over month thousand cubic feet/day 250 rig count Gas +8 3,000 Rig count rigs thousand cubic feet/day 3,600 new-well oil production per rig 500 477 469 January 150 300 250 new-well gas production per rig 200 rig count 2,400 150 1,800 100 200 50 100 0 2007 2008 2009 2010 2011 2012 50 600 0 2014 2013 100 1,200 0 2007 2008 2009 2010 Bakken Legacy oil production change 2012 2013 Bakken Legacy gas production change thousand barrels/day 0 2011 0 2014 million cubic feet/day 0 (10) (10) (20) (20) (30) (30) (40) (40) (50) (60) (50) (70) 2007 (60) 2007 2008 2009 2010 2011 2012 2013 2014 2008 2009 2010 2011 2012 2013 Bakken Indicated change in oil production (Jan vs. Dec) Bakken Indicated change in natural gas production (Jan vs. Dec) thousand barrels/day 100 million cubic feet/day 100 2014 +88 +25 -63 50 -55 +28 50 0 +83 0 Dec 1,000 Mbbl/d Production from new wells Legacy production change Bakken Oil production Net change Jan 1,025 Mbbl/d Dec 1,092 MMcf/d Legacy production change Bakken Natural gas production Oil +25 thousand barrels/day month over month thousand barrels/day 1,000 Production from new wells Net change Jan 1,119 MMcf/d Gas +28 million cubic feet/day month over month million cubic feet/day 6,000 5,000 800 4,000 600 3,000 400 2,000 200 0 2007 1,000 2008 2009 2010 2011 2012 2013 U. S. Energy Information Administration | Drilling Productivity Report 2014 0 2007 2008 2009 2010 2011 2012 2013 2014 3
- 4. Eagle Ford December 2013 drilling data through November projected production through January Drilling Productivity Report 422 413 Oil +9 barrels/day month over month Monthly additions from one average rig January December barrels/day Eagle Ford New-well oil production per rig Rig count rigs barrels/day 600 Eagle Ford New-well gas production per rig 3,000 200 300 150 200 100 100 2009 2010 2011 2012 0 2014 2013 Rig count rigs 350 new-well gas production per rig 300 rig count 250 2,400 200 1,800 150 1,200 100 600 50 2008 thousand cubic feet/day month over month thousand cubic feet/day 3,600 250 400 Gas +11 thousand cubic feet/day 300 rig count 0 2007 December 1,237 1,226 350 new-well oil production per rig 500 January 0 2007 50 2008 2009 2010 Eagle Ford Legacy oil production change 2012 2013 Eagle Ford Legacy gas production change thousand barrels/day 0 (10) (20) (30) (40) (50) (60) (70) (80) (90) (100) 2007 2008 2011 0 2014 million cubic feet/day 0 (50) (100) (150) (200) (250) 2009 2010 2011 2012 2013 2014 (300) 2007 2008 2009 2010 2011 2012 2013 Eagle Ford Indicated change in oil production (Jan vs. Dec) Eagle Ford Indicated change in natural gas production (Jan vs. Dec) thousand barrels/day million cubic feet/day +351 400 350 300 250 200 150 100 50 0 Dec Production 5,982 from MMcf/d new wells 2014 +120 +29 -91 100 50 0 Dec 1,226 Mbbl/d Production from new wells Legacy production change Eagle Ford Oil production Net change Jan 1,255 Mbbl/d Legacy production change Eagle Ford Natural gas production Oil +29 thousand barrels/day month over month thousand barrels/day 1,400 -244 million cubic feet/day month over month 5,000 800 4,000 600 3,000 400 2,000 200 Jan 6,089 MMcf/d 6,000 1,000 Net change Gas +107 million cubic feet/day 7,000 1,200 +107 1,000 0 2007 2008 2009 2010 2011 2012 2013 U. S. Energy Information Administration | Drilling Productivity Report 2014 0 2007 2008 2009 2010 2011 2012 2013 2014 4
- 5. Haynesville December 2013 drilling data through November projected production through January Drilling Productivity Report 35 35 Oil 0 barrels/day month over month Monthly additions from one average rig January December barrels/day Haynesville New-well oil production per rig Rig count rigs barrels/day 1,000 January December 5,059 5,040 Gas +19 thousand cubic feet/day month over month thousand cubic feet/day Haynesville New-well gas production per rig Rig count rigs 300 250 400 200 0 2007 2008 2009 2010 2011 2012 150 2,000 100 50 600 3,000 100 rig count 4,000 150 800 5,000 200 new-well oil production per rig thousand cubic feet/day 6,000 1,000 50 0 2014 2013 300 new-well gas production per rig 250 rig count 0 2007 2008 200 2009 2010 Haynesville Legacy oil production change 2012 2013 Haynesville Legacy gas production change thousand barrels/day 0 2011 0 2014 million cubic feet/day 0 (100) (200) (1) (300) (400) (2) (500) (600) (3) 2007 2008 2009 2010 2011 2012 2013 2014 (700) 2007 2008 2009 2010 2011 2012 2013 Haynesville Indicated change in oil production (Jan vs. Dec) Haynesville Indicated change in natural gas production (Jan vs. Dec) thousand barrels/day million cubic feet/day 350 2014 2.0 +2 +0 -2 +239 -370 -131 250 1.5 150 1.0 50 0.5 -50 0.0 -150 Dec 54 Mbbl/d Production from new wells Legacy production change Haynesville Oil production Net change Jan 54 Mbbl/d Dec 6,492 MMcf/d Legacy production change Haynesville Natural gas production Oil +0 thousand barrels/day month over month thousand barrels/day 2,000 Production from new wells Net change Jan 6,361 MMcf/d Gas -131 million cubic feet/day month over month million cubic feet/day 12,000 10,000 1,600 8,000 1,200 6,000 800 4,000 400 0 2007 2,000 2008 2009 2010 2011 2012 2013 U. S. Energy Information Administration | Drilling Productivity Report 2014 0 2007 2008 2009 2010 2011 2012 2013 2014 5
- 6. Marcellus December 2013 drilling data through November projected production through January Drilling Productivity Report 41 40 Oil +1 barrels/day month over month Monthly additions from one average rig January December barrels/day Marcellus New-well oil production per rig Rig count rigs barrels/day 1,000 160 140 120 100 80 60 40 20 0 2014 new-well oil production per rig 800 rig count 600 400 200 0 2007 2008 2009 2010 2011 2012 2013 January December 6,193 6,038 Gas +155 thousand cubic feet/day month over month thousand cubic feet/day Marcellus New-well gas production per rig Rig count rigs thousand cubic feet/day 6,000 new-well gas production per rig 4,800 rig count 3,600 2,400 1,200 0 2007 2008 2009 2010 Marcellus Legacy oil production change 2012 2013 Marcellus Legacy gas production change thousand barrels/day 0 2011 160 140 120 100 80 60 40 20 0 2014 million cubic feet/day 0 (40) (80) (1) (120) (160) (2) (200) (3) 2007 2008 2009 2010 2011 2012 2013 2014 (240) 2007 2008 2009 2010 2011 2012 2013 Marcellus Indicated change in oil production (Jan vs. Dec) Marcellus Indicated change in natural gas production (Jan vs. Dec) thousand barrels/day 4.0 million cubic feet/day 600 2014 +4 +2 -2 3.0 +612 -193 +419 400 2.0 200 1.0 0.0 0 Dec 39 Mbbl/d Production from new wells Legacy production change Marcellus Oil production Net change Jan 41 Mbbl/d Dec 13,303 MMcf/d thousand barrels/day month over month 1,600 1,200 800 400 0 2007 2008 2009 2010 2011 2012 2013 U. S. Energy Information Administration | Drilling Productivity Report Legacy production change Marcellus Natural gas production Oil +2 thousand barrels/day 2,000 Production from new wells 2014 million cubic feet/day 16,000 14,000 12,000 10,000 8,000 6,000 4,000 2,000 0 2007 2008 2009 Net change Jan 13,721 MMcf/d Gas +419 million cubic feet/day month over month 2010 2011 2012 2013 2014 6
- 7. Niobrara December 2013 drilling data through November projected production through January Drilling Productivity Report 323 317 Oil +6 barrels/day month over month Monthly additions from one average rig January December barrels/day Niobrara New-well oil production per rig Rig count rigs barrels/day 600 December 1,222 1,258 rig count 3,000 80 300 2009 2010 2011 2012 0 2014 2013 100 2,400 600 20 2008 120 80 60 1,200 40 100 140 1,800 60 200 Rig count rigs thousand cubic feet/day 3,600 100 400 thousand cubic feet/day month over month Niobrara New-well gas production per rig 120 new-well oil production per rig Gas -36 thousand cubic feet/day 140 500 0 2007 January 0 2007 40 new-well gas production per rig 20 rig count 2008 2009 2010 Niobrara Legacy oil production change 2012 2013 Niobrara Legacy gas production change thousand barrels/day 0 2011 0 2014 million cubic feet/day 0 (5) (50) (10) (100) (15) (150) (20) (25) (200) (30) 2007 (250) 2007 2008 2009 2010 2011 2012 2013 2014 2008 2009 2010 2011 2012 2013 Niobrara Indicated change in oil production (Jan vs. Dec) Niobrara Indicated change in natural gas production (Jan vs. Dec) thousand barrels/day million cubic feet/day 100 2014 +32 +7 -25 30 +122 -157 -35 50 20 0 10 -50 0 -100 Dec 275 Mbbl/d Production from new wells Legacy production change Niobrara Oil production Net change Jan 282 Mbbl/d Dec 4,634 MMcf/d Legacy production change Niobrara Natural gas production Oil +7 thousand barrels/day month over month thousand barrels/day 1,000 Production from new wells Net change Jan 4,600 MMcf/d Gas -35 million cubic feet/day month over month million cubic feet/day 6,000 5,000 800 4,000 600 3,000 400 2,000 200 0 2007 1,000 2008 2009 2010 2011 2012 2013 U. S. Energy Information Administration | Drilling Productivity Report 2014 0 2007 2008 2009 2010 2011 2012 2013 2014 7
- 8. Permian December 2013 drilling data through November projected production through January Drilling Productivity Report 81 81 Oil 0 barrels/day month over month Monthly additions from one average rig January December barrels/day Permian New-well oil production per rig Rig count rigs barrels/day 600 189 188 January December Gas +1 thousand cubic feet/day month over month thousand cubic feet/day Permian New-well gas production per rig Rig count rigs 600 thousand cubic feet/day 3,600 500 3,000 400 400 2,400 400 300 300 1,800 300 200 200 1,200 200 100 100 600 100 new-well oil production per rig 500 rig count 0 2007 2008 2009 2010 2011 2012 0 2014 2013 600 new-well gas production per rig 0 2007 500 rig count 2008 2009 2010 Permian Legacy oil production change 2012 2013 Permian Legacy gas production change thousand barrels/day 0 2011 0 2014 million cubic feet/day 0 (5) (20) (10) (40) (15) (60) (20) (80) (25) (30) (100) (35) (120) (40) 2007 (140) 2007 2008 2009 2010 2011 2012 2013 2014 2008 2009 2010 2011 2012 2013 Permian Indicated change in oil production (Jan vs. Dec) Permian Indicated change in natural gas production (Jan vs. Dec) thousand barrels/day million cubic feet/day 2014 +37 +1 -36 +88 -88 +0 80 30 60 20 40 10 20 0 0 Dec 1,335 Mbbl/d Production from new wells Legacy production change Permian Oil production Net change Jan 1,335 Mbbl/d Dec 5,046 MMcf/d thousand barrels/day month over month 1,400 1,200 1,000 800 600 400 200 0 2007 2008 2009 2010 2011 2012 2013 U. S. Energy Information Administration | Drilling Productivity Report Legacy production change Permian Natural gas production Oil +1 thousand barrels/day 1,600 Production from new wells 2014 million cubic feet/day 8,000 7,000 6,000 5,000 4,000 3,000 2,000 1,000 0 2007 2008 2009 Net change Jan 5,046 MMcf/d Gas +0 million cubic feet/day month over month 2010 2011 2012 2013 2014 8
- 9. Explanatory notes December 2013 Drilling Productivity Report The Drilling Productivity Report uses recent data on the total number of drilling rigs in operation along with estimates of drilling productivity and estimated changes in production from existing oil and natural gas wells to provide estimated changes in oil and natural gas production for six key fields. EIA’s approach does not distinguish between oil-directed rigs and gas-directed rigs because once a well is completed it may produce both oil and gas; more than half of the wells do that. Monthly additions from one average rig Monthly additions from one average rig represent EIA’s estimate of an average rig’s1 contribution to production of oil and natural gas from new wells.2 The estimation of new-well production per rig uses several months of recent historical data on total production from new wells for each field divided by the region's monthly rig count, lagged by two months.3 Current- and next-month values are listed on the top header. The month-over-month change is listed alongside, with +/- signs and color-coded arrows to highlight the growth or decline in oil (brown) or natural gas (blue). New-well oil/gas production per rig Charts present historical estimated monthly additions from one average rig coupled with the number of total drilling rigs as reported by Baker Hughes. Legacy oil and natural gas production change Charts present EIA’s estimates of total oil and gas production changes from all the wells other than the new wells. The trend is dominated by the well depletion rates, but other circumstances can influence the direction of the change. For example, well freeze-offs or hurricanes can cause production to significantly decline in any given month, resulting in a production increase the next month when production simply returns to normal levels. Projected change in monthly oil/gas production Charts present the combined effects of new-well production and changes to legacy production. Total new-well production is offset by the anticipated change in legacy production to derive the net change in production. The estimated change in production does not reflect external circumstances that can affect the actual rates, such as infrastructure constraints, bad weather, or shut-ins based on environmental or economic issues. Oil/gas production Charts present oil and natural gas production from both new and legacy wells since 2007. This production is based on all wells reported to the state oil and gas agencies. Where state data are not immediately available, EIA estimates the production based on estimated changes in new-well oil/gas production and the corresponding legacy change. Footnotes: 1. The monthly average rig count used in this report is calculated from weekly data on total oil and gas rigs reported by Baker Hughes 2. A new well is defined as one that began producing for the first time in the previous month. Each well belongs to the new-well category for only one month. Reworked and recompleted wells are excluded from the calculation. 3. Rig count data lag production data because EIA has observed that the best predictor of the number of new wells beginning production in a given month is the count of rigs in operation two months earlier. U. S. Energy Information Administration | Drilling Productivity Report 9
- 10. Sources December 2013 Drilling Productivity Report The data used in the preparation of this report come from the following sources. EIA is solely responsible for the analysis, calculations, and conclusions. Drilling Info (http://www.drillinginfo.com) Source of production, permit, and spud data for counties associated with this report. Source of real-time rig location to estimate new wells spudded and completed throughout the United States. Baker Hughes (http://www.bakerhughes.com) Source of rig and well counts by county, state, and basin. North Dakota Oil and Gas Division (https://www.dmr.nd.gov/oilgas) Source of well production, permit, and completion data in the counties associated with this report in North Dakota Railroad Commission of Texas (http://www.rrc.state.tx.us) Source of well production, permit, and completion data in the counties associated with this report in Texas Pennsylvania Department of Environmental Protection (https://www.paoilandgasreporting.state.pa.us/publicreports/Modules/Welcome/Welcome.aspx) Source of well production, permit, and completion data in the counties associated with this report in Pennsylvania West Virginia Department of Environmental Protection (http://www.dep.wv.gov/oil-andgas/Pages/default.aspx) Source of well production, permit, and completion data in the counties associated with this report in West Virginia Colorado Oil and Gas Conservation Commission (http://cogcc.state.co.us) Source of well production, permit, and completion data in the counties associated with this report in Colorado Wyoming Oil and Conservation Commission (http://wogcc.state.wy.us ) Source of well production, permit, and completion data in the counties associated with this report in Wyoming Louisiana Department of Natural Resources (http://dnr.louisiana.gov) Source of well production, permit, and completion data in the counties associated with this report in Louisiana U. S. Energy Information Administration | Drilling Productivity Report 10