The Use of K-mer Minimizers to Identify Bacterium Genomes in High Throughput DNA Sequence Data

Bioinformatics combines the elements of biology, computer science, and statistics to work with genome sequencing. My project utilizes a sequence analysis technique, k-mer minimizers, to identify bacterium from a shotgun genomic DNA sample. We used the algorithm Bevel to compare DNA sequences against standardized reference genomes in the PATRIC whole genome bacterial database. Bevel is a sequence similarity tool that uses a minimizer database. Minimizers are representative k-mers, subsequences of length k observed to have the minimum hash value across a genomic region and are therefore unique and comparable to that genomic region. The two databases are queried against each other, resulting in a list of positions where two or more sequences match. I am developing two Python applications that first, process the results of the algorithm and secondly, return a score that enable the ranking of bacterium matches. The higher the score, the better the match between the unknown bacteria and the standardized reference genome. The goal of this experiment is to show that minimizers are a fast mean of characterizing bacterial shotgun assembly contigs.
Recommended

Recommended
More Related Content
What's hot
What's hot (18)
Similar to The Use of K-mer Minimizers to Identify Bacterium Genomes in High Throughput DNA Sequence Data
Similar to The Use of K-mer Minimizers to Identify Bacterium Genomes in High Throughput DNA Sequence Data (20)
Recently uploaded
Recently uploaded (20)
The Use of K-mer Minimizers to Identify Bacterium Genomes in High Throughput DNA Sequence Data
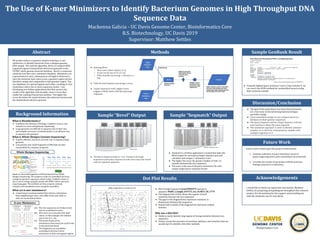
- 1. The Use of K-mer Minimizers to Identify Bacterium Genomes in High Throughput DNA Sequence Data Mackenna Galicia - UC Davis Genome Center, Bioinformatics Core B.S. Biotechnology, UC Davis 2019 Supervisor: Matthew Settles Abstract Background Information Methods Discussion/Conclusion I would like to thank my supervisor and mentor, Matthew Settles, for proposing and guiding me throughout this research project; Zev Kronenberg for the support and providing me with the similarity search tool, Bevel. My project utilizes a sequence analysis technique, k-mer minimizers, to identify bacterium from a shotgun genomic DNA sample. We used the algorithm, Bevel, to compare DNA sequences against standardized referenced genomes in the PATRIC whole genome bacterial database. Bevel is a sequence similarity tool that uses a minimizer database. Minimizers are representative k-mers, subsequences of length k observed to have the minimum hash value across a genomic region and are therefore unique and comparable to that genomic region. The two databases are queried against each other, resulting in a list of positions where two or more sequences match. I am developing two Python applications that first, process the results of the algorithm and secondly, return a score that enable the ranking of bacterium matches. The higher the score, the better the match between the unknown bacteria and the standardized reference genome. Sample “Seqmatch” Output What is Bioinformatics? ● Combines the elements of biology, computer science, and statistics to work with genome sequencing ● Large genomes are difficult to sequence due to their size and complex structure, so bioinformatics is an efficient way to sequence the genomes What is Whole Shotgun Genome Sequencing? ● A quick, efficient, and more accurate way to sequence large genomes ● Cuts genome into small fragments of DNA that are then reassembled by computer programs Reads are the small fragments of DNA produced from Whole Shotgun Sequencing. The sequence reads are assembled and form contiguous genomic sequences called contigs. Scaffolds consist of one or more contigs, typically joined with NNN’s which represent sequencing gaps. The scaffolds are then properly ordered, oriented, and assembled to form complete assemblies. What are k-mer minimizers? ● A hash-based counting method that reduces redundancy from neighboring k-mers, who differ from each other in only one nucleotide position Future work to build upon this project would include: 1. Continue collection of query minimizer scores of query-target sequences pairs remaining to be processed 2. Correlate the results of my project with the previous findings acquired in a laboratory ● The goal of this experiment is to show that minimizers are a fast mean of characterizing bacterial shotgun assembly contigs ● Given assembled contigs we can compare those to a database of whole genome sequences ● The Query Sequence and the Target Sequence with the most matches is likely the same organism ● This minimizer approach is used to identify unknown samples, or to check for contamination, samples with multiple organisms in it Sample “Bevel” Output Whole Shotgun Sequencing Dot Plot Results K-mer Minimizers Acknowledgements ● Running Bevel ○ Store every other match (-w 2) ○ K-mer/word size of 15 (-k 15) ○ Filter matches occurring > 10 times (-n 10) ● Tally the hits/matches and assign a score. ● Target sequences with a higher score suggest a likely match with the querying organism. Why use a Dot Plot? ● Useful to easily identify long regions of strong similarity between two sequences ● Clearly reveals the presence of insertions, deletions, and mutations that are usually hard to identify with other methods ● Plot of target sequence accn|CP005975 and query sequence NODE_2_length_654753_cov_26.8031_ID_3779 ● The diagonal line of dots shows the regions of local similarity between the two sequences ● The gaps in the diagonal lines represent mutations or distinctions between the sequences ● Isolated dots outside of the diagonal line represent random matches ● The Bevel output provides a “raw” listing of all target sequences (and query sequences) with more than one match with an organism sequence ● Seqmatch is a Python application I created that takes the Bevel output for each query/target sequence pair and calculates and assigns a “minimizer score” ● The higher the score, the greater number of “hits” or matches between the two sequences ● The score is the sum of all query minimizers for each unique target/query sequence ID pair https://www.ncbi.nlm.nih.gov/nuccore/CP005975.1 https://en.wikipedia.org/wiki/Shotgun_sequencing Sample GenBank Result ● Using the highest query minimizer scores (“best matches”), we can search the NCBI GenBank for unidentified bacteria using their accession number Future Work (A) The two sequences are broken down into its constituent k-mers. (B) All k-mers are converted into hash values. In this example, the window size is four (r1...r4). (C) The lowest hash scores (minimizers/min-mers) for each k-mer is extracted and listed. (D) The fragments are assembled according to the four lowest minimizers to find overlapped regionshttp://dx/doi.org/10.1101/008003