SlideShare a Scribd company logo
1 of 48
MLSListings Inc Confidential Copyright 2015 1
Market Snapshot – Aug 2015 vs. Aug 2014
Aug
2015
Aug
2014
%
Change
Aug
2015
Aug
2014
%
Change
Aug
2015
Aug
2014
%
Change
Aug
2015
Aug
2014
%
Change
Aug
2015
Aug
2014
%
Change
Aug
2015
Aug
2014
%
Change
Aug
2015
Aug
2014
%
Change
Aug
2015
Aug
2014
% Change
Monterey 1210 994 22% 213 210 1% $470,000 $488,750 -4% $695,319 $696,261 0% $148,102,949 $146,215,013 1% 57 73 -22% 330 321 3% 98 97 1%
San Benito 178 168 6% 32 37 -14% $456,000 $424,900 7% $496,192 $481,637 3% $15,878,145 $17,820,600 -11% 25 34 -26% 53 53 0% 100 98 2%
San Mateo 893 671 33% 389 408 -5% $1,235,000 $1,000,000 24% $1,609,066 $1,329,916 21% $625,926,621 $539,946,100 16% 20 31 -35% 473 450 5% 109 105 4%
Santa Clara 2464 1786 38% 987 858 15% $970,000 $875,000 11% $1,249,450 $1,158,757 8% $1,233,207,623 $991,896,414 24% 25 28 -11% 1204 1098 10% 105 103 2%
Santa Cruz 694 646 7% 175 181 -3% $715,000 $650,000 10% $800,928 $735,951 9% $140,162,462 $133,207,244 5% 38 36 6% 243 219 11% 100 100 0%
Aug
2015
Aug
2014
%
Change
Aug
2015
Aug
2014
%
Change
Aug
2015
Aug
2014
%
Change
Aug
2015
Aug
2014
%
Change
Aug
2015
Aug
2014
%
Change
Aug
2015
Aug
2014
%
Change
Aug
2015
Aug
2014
%
Change
Aug
2015
Aug
2014
% Change
Monterey 80 101 -21% 31 26 19% $455,000 $309,500 47% $443,919 $324,607 37% $13,761,500 $8,439,800 63% 62 44 41% 30 41 -27% 98 99 -1%
San Benito 8 11 -27% 3 4 -25% $371,500 $237,650 56% $353,333 $256,875 38% $1,060,000 $1,027,500 3% 43 63 -32% 3 6 -50% 99 98 1%
San Mateo 191 216 -12% 99 124 -20% $723,000 $622,000 16% $770,281 $653,796 18% $76,257,859 $81,070,740 -6% 18 18 0% 140 166 -16% 109 104 5%
Santa Clara 641 637 1% 414 362 14% $615,000 $550,000 12% $685,665 $596,799 15% $283,865,237 $215,444,551 32% 18 24 -25% 446 443 1% 106 103 3%
Santa Cruz 107 148 -28% 49 45 9% $450,000 $400,000 13% $521,674 $473,088 10% $25,562,046 $21,289,000 20% 42 45 -7% 40 53 -25% 100 100 0%
% to List Price Received
Condo/Townhouse Year over Year - August 2015 vs. August 2014
% to List Price Received
Single Family Year over Year - August 2015 vs. August 2014
New Listings
Total Dollars Days on Market New Listings
County
Inventory * Closed Sales Median Price Average Price Total Dollars Days on Market
County
Inventory Closed Sales Median Price Average Price
MLSListings Inc Confidential Copyright 2015 2
Market Snapshot – Aug 2015 vs. Jul 2015
Jul
2015
Aug
2015
%
Change
Jul
2015
Aug
2015
%
Change
Jul
2015
Aug
2015
%
Change
Jul
2015
Aug
2015
%
Change
Jul
2015
Aug
2015
%
Change
Jul
2015
Aug
2015
%
Change
Jul
2015
Aug
2015
%
Change
Jul
2015
Aug
2015
% Change
Monterey 1128 1210 7% 281 213 -32% $485,000 $470,000 -3% $741,183 $695,319 -7% $209,013,551 $148,102,949 -41% 58 57 -2% 336 330 -2% 98 98 0%
San Benito 161 178 10% 57 32 -78% $450,000 $456,000 1% $524,063 $496,192 -6% $29,871,588 $15,878,145 -88% 69 25 -176% 71 53 -34% 99 100 1%
San Mateo 842 893 6% 441 389 -13% $1,300,000 $1,235,000 -5% $1,653,193 $1,609,066 -3% $729,058,010 $625,926,621 -16% 21 20 -5% 486 473 -3% 110 109 -1%
Santa Clara 2447 2464 1% 1099 987 -11% $965,000 $970,000 1% $1,234,265 $1,249,450 1% $1,357,691,180 $1,233,207,623 -10% 23 25 8% 1393 1204 -16% 105 105 0%
Santa Cruz 687 694 1% 227 175 -30% $750,000 $715,000 -5% $829,653 $800,928 -4% $188,331,205 $140,162,462 -34% 45 38 -18% 266 243 -9% 99 100 1%
Jul
2015
Aug
2015
%
Change
Jul
2015
Aug
2015
%
Change
Jul
2015
Aug
2015
%
Change
Jul
2015
Aug
2015
%
Change
Jul
2015
Aug
2015
%
Change
Jul
2015
Aug
2015
%
Change
Jul
2015
Aug
2015
%
Change
Jul
2015
Aug
2015
% Change
Monterey 89 80 -11% 43 31 -39% $374,000 $455,000 18% $541,282 $443,919 -22% $23,275,137 $13,761,500 -69% 44 62 29% 25 30 17% 99 98 -1%
San Benito 7 8 13% 2 3 33% $314,000 $371,500 15% $314,000 $353,333 11% $628,000 $1,060,000 41% 3 43 93% 9 3 -200% 103 99 -4%
San Mateo 171 191 10% 122 99 -23% $708,000 $723,000 2% $756,692 $770,281 2% $91,559,682 $76,257,859 -20% 18 18 0% 130 140 7% 106 109 3%
Santa Clara 672 641 -5% 434 414 -5% $635,000 $615,000 -3% $697,064 $685,665 -2% $302,525,730 $283,865,237 -7% 18 18 0% 499 446 -12% 107 106 -1%
Santa Cruz 126 107 -18% 62 49 -27% $457,539 $450,000 -2% $468,577 $521,674 10% $29,051,777 $25,562,046 -14% 38 42 10% 61 40 -53% 101 100 -1%
% to List Price Received
Condo/Townhouse - Current Month vs. Prior Month - August 2015 vs. July 2015
County
Inventory Closed Sales Median Price Average Price Total Dollars Days on Market New Listings
Total Dollars Days on Market New Listings
Single Family - Current Month vs. Prior Month - August 2015 vs. July 2015
County
Inventory Closed Sales Median Price Average Price % to List Price Received
MLSListings Inc Confidential Copyright 2015 3
3
Single Family + Condo/Townhouse Inventory, Closed Sales, New Listings - Home Counties
Jan ’03 – Aug ’15
MLSListings Inc Confidential Copyright 2015 4
4
Single Family + Condo/Townhouse Inventory - Home Counties
Jan ’03 – Aug ’15
MLSListings Inc Confidential Copyright 2015 5
5
Single Family + Condo/Townhouse Inventory - Home Counties
Jan ’05 – Aug ’15
2005 2006 2007 2008 2009 2010 2011 2012 2013 2014 2015
Jan 4223 7295 8588 12447 12693 8558 10330 8140 3179 3578 4175
Feb 4839 8023 9184 13528 13079 9650 10803 8231 4296 3924 3932
Mar 5502 8827 10357 14355 13240 10910 11127 7991 4286 4322 5515
Apr 6434 9722 11812 15513 12806 11773 11506 7630 4765 4776 5944
May 7020 10819 12923 15787 11749 11903 11730 7712 5222 3520 6069
Jun 7189 11493 13287 15802 11104 12691 11740 7570 5616 5322 5233
Jul 7878 12317 13910 15948 10763 13016 11372 7306 5950 4389 6330
Aug 8030 12122 14275 15356 10044 13072 11201 7116 5850 5378 5439
Sep 8798 12239 13943 15192 9823 13294 10944 6523 5806 5290
Oct 8946 11490 14020 15070 9295 12440 10241 6173 5384 4863
Nov 8252 9968 13308 13849 8724 11500 9482 5292 4592 3925
Dec 6372 7874 11420 12221 7778 9825 7790 3901 3198 3174
Aug '05 8030
Aug '06 12122
Aug '07 14275
Aug '08 15356
Aug '09 10044
Aug '10 13072
Aug '11 11201
Aug '12 7116
Aug '13 5850
Aug '14 5378
Aug '15 5439
Home Counties
Inventory
-32.3%
-55.1%
-61.9%
-64.6%
-45.8%
-58.4%
-51.4%
-23.6%
-7.0%
1.1%
Home Counties - Single Family + Condo/Townhouse Inventory
Variance to
prior Years
0
2000
4000
6000
8000
10000
12000
14000
16000
Aug
'05
Aug
'06
Aug
'07
Aug
'08
Aug
'09
Aug
'10
Aug
'11
Aug
'12
Aug
'13
Aug
'14
Aug
'15
15356
5439
MLSListings Inc Confidential Copyright 2015 6
6
Single Family Inventory – San Mateo, Santa Clara Counties
Jan ’04 – Aug ’15
MLSListings Inc Confidential Copyright 2015 7
7
Single Family Inventory – Monterey, San Benito, Santa Cruz Counties
Jan ’04 – Aug ’15
MLSListings Inc Confidential Copyright 2015 8
8
Single Family Inventory - Home Counties
Aug (2004 – 2015)
MLSListings Inc Confidential Copyright 2015 9
9
Single Family Inventory - Home Counties
Aug (2004 – 2015)
Monterey
County
San Benito
County
San Mateo
County
Santa Clara
County
Santa Cruz
County
Aug '04 1087 11.3% 212 -16.0% 1066 -16.2% 2912 -15.4% 821 -15.5%
Aug '05 1489 -18.7% 250 -28.8% 1095 -18.4% 2816 -12.5% 884 -21.5%
Aug '06 2507 -51.7% 410 -56.6% 1443 -38.1% 3889 -36.6% 1355 -48.8%
Aug '07 2892 -58.2% 488 -63.5% 1685 -47.0% 4893 -49.6% 1326 -47.7%
Aug '08 2740 -55.8% 484 -63.2% 1773 -49.6% 5963 -58.7% 1283 -45.9%
Aug '09 1548 -21.8% 237 -24.9% 1486 -39.9% 3558 -30.7% 966 -28.2%
Aug '10 1899 -36.3% 306 -41.8% 1980 -54.9% 4720 -47.8% 1102 -37.0%
Aug '11 1681 -28.0% 304 -41.4% 1733 -48.5% 3906 -36.9% 1014 -31.6%
Aug '12 1204 0.5% 209 -14.8% 1063 -16.0% 2371 3.9% 822 -15.6%
Aug '13 984 23.0% 156 14.1% 814 9.7% 1956 26.0% 679 2.2%
Aug '14 994 21.7% 168 6.0% 671 33.1% 1786 38.0% 646 7.4%
Aug '15 1210 178 893 2464 694
Home Counties - Single Family Inventory (2015 vs. Prior Years)
MLSListings Inc Confidential Copyright 2015 10
10
Single Family Months of Inventory – San Mateo, Santa Clara, Santa Cruz
Mar ’03 – Aug ’15 (Rolling Three Month Average)
MLSListings Inc Confidential Copyright 2015 11
11
Single Family Months of Inventory – Monterey and San Benito Counties
Mar ’03 – Aug ’15 (Rolling Three Month Average)
MLSListings Inc Confidential Copyright 2015 12
12
Single Family Market Outlook – Home Counties
Aug ’14 vs. Aug ’15
MLSListings Inc Confidential Copyright 2015 13
13
Single Family + Condo/Townhouse Closed Sales – Home Counties
Jan ’03 – Aug ’15
MLSListings Inc Confidential Copyright 2015 14
14
Single Family + Condo/Townhouse Closed Sales - Home Counties
Jan ’05 – Aug ’15
2005 2006 2007 2008 2009 2010 2011 2012 2013 2014 2015
Jan 2078 1638 1539 877 1390 1529 1574 1552 1460 1330 1182
Feb 2048 1762 1658 1063 1497 1537 1648 1785 1597 1371 921
Mar 3210 2775 2248 1388 1916 2197 2399 2520 2289 1882 2068
Apr 3407 2595 2101 1664 2158 2245 2329 2517 2468 2402 2527
May 3376 2706 2270 1953 2355 2805 2369 2885 2780 2484 2407
Jun 3836 2847 2353 2123 2808 2592 2633 2639 2543 2456 2045
Jul 3396 2446 2136 2230 2788 2299 2238 2457 2643 1933 2769
Aug 3538 2668 1962 2244 2421 2196 2446 2525 2559 2255 2392
Sep 3312 2186 1223 2127 2503 2037 2144 2194 2258 2270
Oct 2881 2219 1426 2114 2577 1994 2008 2456 2404 2312
Nov 2667 2182 1328 1594 2138 1930 2038 2273 1899 1787
Dec 2408 2066 1201 1810 2325 2234 2201 2230 1859 1371
Aug '05 3538
Aug '06 2668
Aug '07 1962
Aug '08 2244
Aug '09 2421
Aug '10 2196
Aug '11 2446
Aug '12 2525
Aug '13 2559
Aug '14 2255
Aug '15 2392
Home Counties
Closed Sales
Variance to
prior Years
Home Counties - Single Family + Condo/Townhouse Closed Sales
8.9%
-2.2%
-5.3%
-6.5%
-32.4%
-10.3%
21.9%
6.6%
6.1%
-1.2%
0
500
1000
1500
2000
2500
3000
3500
4000
Aug
'05
Aug
'06
Aug
'07
Aug
'08
Aug
'09
Aug
'10
Aug
'11
Aug
'12
Aug
'13
Aug
'14
Aug
'15
3538
2392
MLSListings Inc Confidential Copyright 2015 15
15
Single Family Closed Sales – San Mateo, Santa Clara Counties
Jan ’04 – Aug ’15
MLSListings Inc Confidential Copyright 2015 16
16
Single Family Closed Sales – San Mateo, Santa Clara Counties
Aug (2004 – 2015)
MLSListings Inc Confidential Copyright 2015 17
17
Single Family Closed Sales – Monterey, San Benito, Santa Cruz Counties
Jan ’04 – Aug ’15
MLSListings Inc Confidential Copyright 2015 18
18
Single Family Closed Sales – Monterey, San Benito, Santa Cruz Counties
Aug (2004 – 2015)
MLSListings Inc Confidential Copyright 2015 19
19
Single Family Closed Sales – Home Counties
Aug (2004 – 2015)
Monterey
County
San Benito
County
San Mateo
County
Santa Clara
County
Santa Cruz
County
Aug '04 328 -35.1% 75 -57.3% 560 -30.5% 1547 -36.2% 257 -31.9%
Aug '05 319 -33.2% 78 -59.0% 592 -34.3% 1404 -29.7% 228 -23.2%
Aug '06 202 5.4% 39 -17.9% 464 -16.2% 1080 -8.6% 185 -5.4%
Aug '07 127 67.7% 21 52.4% 371 4.9% 787 25.4% 137 27.7%
Aug '08 319 -33.2% 62 -48.4% 376 3.5% 893 10.5% 153 14.4%
Aug '09 361 -41.0% 43 -25.6% 365 6.6% 979 0.8% 160 9.4%
Aug '10 274 -22.3% 27 18.5% 394 -1.3% 864 14.2% 150 16.7%
Aug '11 269 -20.8% 41 -22.0% 430 -9.5% 991 -0.4% 164 6.7%
Aug '12 257 -17.1% 46 -30.4% 422 -7.8% 1023 -3.5% 196 -10.7%
Aug '13 218 -2.3% 44 -27.3% 419 -7.2% 990 -0.3% 191 -8.4%
Aug '14 210 1.4% 37 -13.5% 408 -4.7% 858 15.0% 181 -3.3%
Aug '15 213 32 389 987 175
Home Counties - Single Family Sales (2015 vs. Prior Years)
MLSListings Inc Confidential Copyright 2015 20
20
Single Family Total Sales Dollars – San Mateo and Santa Clara Counties
Jan ’04 – Aug ’15
MLSListings Inc Confidential Copyright 2015 21
21
Single Family Total Sales Dollars – San Mateo, Santa Clara Counties
Aug (2004 – 2015)
MLSListings Inc Confidential Copyright 2015 22
22
Single Family Total Sales Dollars – Santa Cruz, Monterey, and San Benito Counties
Jan ’04 – Aug ’15
MLSListings Inc Confidential Copyright 2015 23
23
Single Family Total Sales Dollars – Monterey, San Benito, Santa Cruz
Counties
Aug (2004 – 2015)
MLSListings Inc Confidential Copyright 2015 24
24
Single Family Total Sales Volume – Home Counties
Aug (2004 – 2015)
Monterey
County
San Benito
County
San Mateo
County
Santa Clara
County
Santa Cruz
County
Aug '04 $216,807,098 -31.7% $41,996,243 -62.2% $555,934,304 12.6% $1,148,599,581 7.4% $190,337,321 -26.4%
Aug '05 $277,408,894 -46.6% $53,533,365 -70.3% $665,670,583 -6.0% $1,297,901,625 -5.0% $197,942,019 -29.2%
Aug '06 $191,281,300 -22.6% $28,910,199 -45.1% $510,369,288 22.6% $1,019,524,309 21.0% $157,795,655 -11.2%
Aug '07 $134,367,225 10.2% $21,420,575 -25.9% $434,235,019 44.1% $853,664,556 44.5% $121,868,583 15.0%
Aug '08 $141,173,604 4.9% $20,999,900 -24.4% $370,591,052 68.9% $757,529,743 62.8% $104,069,935 34.7%
Aug '09 $119,093,055 24.4% $12,584,300 26.2% $308,879,963 102.6% $682,020,325 80.8% $84,003,213 66.9%
Aug '10 $103,284,475 43.4% $8,145,739 94.9% $395,896,062 58.1% $699,765,751 76.2% $86,723,995 61.6%
Aug '11 $122,644,762 20.8% $11,899,647 33.4% $404,948,109 54.6% $758,617,125 62.6% $91,480,895 53.2%
Aug '12 $115,804,973 27.9% $17,213,007 -7.8% $452,279,035 38.4% $878,463,947 40.4% $115,242,907 21.6%
Aug '13 $144,686,100 2.4% $18,019,899 -11.9% $504,702,571 24.0% $1,004,467,681 22.8% $128,050,306 9.5%
Aug '14 $165,826,383 -10.7% $17,820,600 -10.9% $539,946,100 15.9% $991,896,414 24.3% $133,207,244 5.2%
Aug '15 $148,102,949 $15,878,145 $625,926,621 $1,233,207,623 $140,162,462
Home Counties - Single Family Total Sales Dollars (2015 vs. Prior Years)
MLSListings Inc Confidential Copyright 2015 25
25
Single Family + Condo/Townhouse New Listings - Home Counties
Jan ’03 – Aug ’15
MLSListings Inc Confidential Copyright 2015 26
26
Single Family + Condo/Townhouse New Listings - Home Counties
Jan ’04 – Aug ’15
MLSListings Inc Confidential Copyright 2015 27
27
Single Family New Listings – San Mateo, Santa Clara Counties
Aug ’04 – Aug ’15
MLSListings Inc Confidential Copyright 2015 28
28
Single Family New Listings – Monterey, San Benito, Santa Cruz Counties
Jan ’04 – Aug ’15
MLSListings Inc Confidential Copyright 2015 29
29
Single Family New Listings – Monterey, San Benito, Santa Cruz Counties
Aug ’04 – Aug ’15
MLSListings Inc Confidential Copyright 2015 30
30
Single Family New Listings - Home Counties
Aug (2004 – 2015)
Monterey
County
San Benito
County
San Mateo
County
Santa Clara
County
Santa Cruz
County
Aug '04 442 -25.3% 103 -48.5% 674 -29.8% 2044 -41.1% 387 -37.2%
Aug '05 648 -49.1% 131 -59.5% 749 -36.8% 2168 -44.5% 445 -45.4%
Aug '06 625 -47.2% 132 -59.8% 730 -35.2% 2114 -43.0% 468 -48.1%
Aug '07 556 -40.6% 119 -55.5% 680 -30.4% 1952 -38.3% 313 -22.4%
Aug '08 654 -49.5% 113 -53.1% 588 -19.6% 1820 -33.8% 280 -13.2%
Aug '09 478 -31.0% 86 -38.4% 566 -16.4% 1419 -15.2% 249 -2.4%
Aug '10 449 -26.5% 88 -39.8% 616 -23.2% 1614 -25.4% 253 -4.0%
Aug '11 269 22.7% 41 29.3% 430 10.0% 991 21.5% 164 48.2%
Aug '12 334 -1.2% 75 -29.3% 521 -9.2% 1170 2.9% 220 10.5%
Aug '13 327 0.9% 73 -27.4% 507 -6.7% 1205 -0.1% 244 -0.4%
Aug '14 321 2.8% 53 0.0% 450 5.1% 1098 9.7% 219 11.0%
Aug '15 330 53 473 1204 243
Home Counties - Single Family New Listings (2015 vs. Prior Years)
MLSListings Inc Confidential Copyright 2015 31
31
Single Family New Listings - Home Counties
Jan ‘05 – Aug ‘15
2005 2006 2007 2008 2009 2010 2011 2012 2013 2014 2015
Jan 3291 4061 3519 3947 3907 3334 3380 2890 2170 2164 1727
Feb 3561 4080 3508 4353 3867 3711 3373 3011 2534 2496 1616
Mar 4912 5140 4828 4785 4397 4649 3953 3313 3011 3081 3129
Apr 5359 4787 4745 5185 3909 4613 3916 3151 3499 3380 3324
May 5224 6019 5279 4934 3636 4044 3986 3551 3592 3520 3298
Jun 5392 6152 4894 4840 3820 4423 3784 3132 3358 3209 2480
Jul 5210 5523 4747 4530 3915 4089 3429 3096 3529 2420 3204
Aug 5450 5356 4720 4344 3612 3867 3342 2941 3163 2850 2962
Sep 5544 4810 4143 4632 3608 3726 3095 2619 3016 2924
Oct 5106 3763 4202 4468 3480 3267 2988 2732 2650 2497
Nov 3648 2646 3034 3098 2700 2657 2355 1923 1774 1531
Dec 1929 1666 2223 2656 2219 2088 1724 1237 1113 705
Aug '05 5450
Aug '06 5356
Aug '07 4720
Aug '08 4344
Aug '09 3612
Aug '10 3867
Aug '11 3342
Aug '12 2941
Aug '13 3163
Aug '14 2850
Aug '15 2962
-18.0%
-23.4%
Variance to
prior Years
Home Counties
New Listings
-45.7%
-11.4%
0.7%
-6.4%
-44.7%
-37.2%
-31.8%
Home Counties - Single Family + Condo/Townhouse New Listings
3.9%
0
1000
2000
3000
4000
5000
6000
Aug
'05
Aug
'06
Aug
'07
Aug
'08
Aug
'09
Aug
'10
Aug
'11
Aug
'12
Aug
'13
Aug
'14
Aug
'15
5450
2962
MLSListings Inc Confidential Copyright 2015 32
32
Single Family Median Prices – San Mateo, Santa Clara Counties
Jan ’04 – Aug ’15
MLSListings Inc Confidential Copyright 2015 33
33
Single Family Median Prices – Monterey, San Benito, Santa Cruz Counties
Jan ’04 – Aug ’15
MLSListings Inc Confidential Copyright 2015 34
34
Single Family Median Prices - Home Counties
Aug (2004 – 2015)
MLSListings Inc Confidential Copyright 2015 35
35
Single Family Median Prices - Home Counties
Aug (2004 – 2015)
Monterey
County
San Benito
County
San Mateo
County
Santa Clara
County
Santa Cruz
County
Aug '04 $555,000 -15.3% $530,000 -14.0% $779,000 58.5% $625,000 55.2% $639,000 11.9%
Aug '05 $690,000 -31.9% $605,000 -24.6% $890,000 38.8% $760,000 27.6% $783,000 -8.7%
Aug '06 $675,000 -30.4% $599,900 -24.0% $850,000 45.3% $770,000 26.0% $765,000 -6.5%
Aug '07 $799,500 -41.2% $560,000 -18.6% $950,000 30.0% $860,000 12.8% $790,000 -9.5%
Aug '08 $305,000 54.1% $307,500 48.3% $795,000 55.3% $651,750 48.8% $585,000 22.2%
Aug '09 $235,000 100.0% $270,000 68.9% $682,500 81.0% $560,000 73.2% $497,750 43.6%
Aug '10 $260,000 80.8% $280,000 62.9% $790,000 56.3% $629,500 54.1% $522,500 36.8%
Aug '11 $252,000 86.5% $252,000 81.0% $750,000 64.7% $600,000 61.7% $490,000 45.9%
Aug '12 $320,000 46.9% $335,500 35.9% $780,000 58.3% $671,250 44.5% $540,000 32.4%
Aug '13 $416,000 13.0% $387,000 17.8% $989,500 24.8% $815,000 19.0% $630,000 13.5%
Aug '14 $488,750 -3.8% $424,900 7.3% $1,000,000 23.5% $875,000 10.9% $650,000 10.0%
Aug '15 $470,000 $456,000 $1,235,000 $970,000 $715,000
Home Counties - Single Family Median Price (2015 vs. Prior Years)
MLSListings Inc Confidential Copyright 2015 36
36
Single Family + Condo/Townhouse Median Price - Home Counties
Jan ’05 – Aug ’15
2005 2006 2007 2008 2009 2010 2011 2012 2013 2014 2015
Jan $625,000 $695,000 $699,000 $660,000 $380,000 $450,000 $435,500 $415,000 $540,000 $640,000 $683,000
Feb $651,000 $699,950 $705,000 $680,000 $381,000 $465,400 $420,000 $438,875 $555,000 $668,000 $823,188
Mar $669,000 $707,000 $740,000 $677,750 $369,000 $499,900 $460,000 $475,000 $615,000 $729,000 $840,000
Apr $685,000 $704,865 $775,000 $655,000 $404,000 $500,000 $480,000 $502,500 $676,250 $735,000 $825,000
May $685,000 $725,000 $775,000 $650,000 $415,000 $522,500 $477,750 $527,500 $688,945 $748,500 $850,000
Jun $708,000 $740,000 $768,500 $639,000 $460,000 $525,500 $515,000 $559,000 $670,000 $765,000 $837,375
Jul $700,000 $725,000 $759,975 $595,000 $487,750 $535,000 $484,500 $565,000 $692,000 $718,000 $835,000
Aug $710,000 $720,000 $761,000 $545,445 $476,000 $510,500 $490,000 $560,000 $670,000 $738,000 $825,000
Sep $695,000 $715,000 $750,000 $490,000 $469,825 $500,000 $465,000 $560,000 $670,000 $730,000
Oct $699,000 $711,500 $758,000 $477,200 $487,944 $500,000 $455,000 $567,000 $668,150 $750,000
Nov $700,000 $709,000 $750,000 $435,000 $500,000 $492,000 $437,500 $565,000 $659,250 $745,000
Dec $690,500 $695,000 $702,900 $410,000 $480,000 $463,750 $440,000 $563,000 $655,000 $801,000
Aug '05 $710,000
Aug '06 $720,000
Aug '07 $761,000
Aug '08 $545,445
Aug '09 $476,000
Aug '10 $510,500
Aug '11 $490,000
Aug '12 $560,000
Aug '13 $670,000
Aug '14 $738,000
Aug '15 $825,000
47.3%
23.1%
8.4%
51.3%
73.3%
61.6%
68.4%
11.8%
Home Counties
Median Price
Variance to
prior Years
16.2%
14.6%
Home Counties - Single Family + Condo/Townhouse Median Price
$0
$200,000
$400,000
$600,000
$800,000
$1,000,000
Aug
'05
Aug
'06
Aug
'07
Aug
'08
Aug
'09
Aug
'10
Aug
'11
Aug
'12
Aug
'13
Aug
'14
Aug
'15
$761,000
$825,000
MLSListings Inc Confidential Copyright 2015 37
37
Single Family Average Price – San Mateo, Santa Clara Counties
Jan ’04 – Aug ’15
MLSListings Inc Confidential Copyright 2015 38
38
Single Family Average Price – Monterey, San Benito, Santa Cruz Counties
Jan ’04 – Aug ’15
MLSListings Inc Confidential Copyright 2015 39
39
Single Family Average Price - Home Counties
Aug (2004 – 2015)
MLSListings Inc Confidential Copyright 2015 40
40
Single Family Average Price - Home Counties
Aug (2004 – 2015)
Monterey
County
San Benito
County
San Mateo
County
Santa Clara
County
Santa Cruz
County
Aug '04 $660,997 5.2% $559,950 -11.4% $992,740 62.1% $742,469 68.3% $740,612 8.1%
Aug '05 $869,620 -20.0% $686,325 -27.7% $1,124,444 43.1% $924,431 35.2% $868,167 -7.7%
Aug '06 $946,937 -26.6% $741,287 -33.1% $1,099,934 46.3% $944,004 32.4% $852,949 -6.1%
Aug '07 $1,058,010 -34.3% $1,020,027 -51.4% $1,170,445 37.5% $1,084,707 15.2% $889,552 -10.0%
Aug '08 $454,188 53.1% $338,708 46.5% $848,297 89.7% $985,614 26.8% $680,195 17.7%
Aug '09 $391,965 77.4% $292,658 69.5% $848,571 89.6% $697,262 79.2% $525,020 52.6%
Aug '10 $403,319 72.4% $301,694 64.5% $1,007,369 59.7% $809,914 54.3% $578,159 38.5%
Aug '11 $441,707 57.4% $290,235 71.0% $943,934 70.5% $766,279 63.1% $557,810 43.6%
Aug '12 $577,974 20.3% $374,195 32.6% $1,079,424 49.1% $859,553 45.4% $587,974 36.2%
Aug '13 $613,770 13.3% $409,543 21.2% $1,219,088 32.0% $1,018,729 22.6% $670,420 19.5%
Aug '14 $696,261 -0.1% $481,637 3.0% $1,329,916 21.0% $1,158,757 7.8% $735,951 8.8%
Aug '15 $695,319 $496,192 $1,609,066 $1,249,450 $800,928
Home Counties - Single Family Average Price (2015 vs. Prior Years)
MLSListings Inc Confidential Copyright 2015 41
41
Condo/Townhouse Market Outlook – Home Counties
Aug ’14 vs. Aug ’15
MLSListings Inc Confidential Copyright 2015 42
42
Condo/Townhouse Total Sales Dollars – San Mateo and Santa Clara Counties
Jan ’04 – Aug ’15
MLSListings Inc Confidential Copyright 2015 43
43
Condo/Townhouse Total Sales Dollars – San Mateo, Santa Clara Counties
Aug ’04 – Aug ’15
MLSListings Inc Confidential Copyright 2015 44
44
Condo/Townhouse Total Sales Dollars – Monterey, San Benito, Santa Cruz Counties
Jan ’04 – Aug ‘15
MLSListings Inc Confidential Copyright 2015 45
45
Condo/Townhouse Total Sales Dollars – Monterey, San Benito, Santa Cruz Counties
Aug (2004 – 2015)
MLSListings Inc Confidential Copyright 2015 46
46
Condo/Townhouse Total Sales Dollars – Home Counties
Aug (2004 – 2015)
Monterey
County
San Benito
County
San Mateo
County
Santa Clara
County
Santa Cruz
County
Aug '04 $216,807,098 -31.7% $41,996,243 -62.2% $555,934,304 12.6% $1,148,599,581 7.4% $190,337,321 -26.4%
Aug '05 $277,408,894 -46.6% $53,533,365 -70.3% $665,670,583 -6.0% $1,297,901,625 -5.0% $197,942,019 -29.2%
Aug '06 $191,281,300 -22.6% $28,910,199 -45.1% $510,369,288 22.6% $1,019,524,309 21.0% $157,795,655 -11.2%
Aug '07 $134,367,225 10.2% $21,420,575 -25.9% $434,235,019 44.1% $853,664,556 44.5% $121,868,583 15.0%
Aug '08 $141,173,604 4.9% $20,999,900 -24.4% $370,591,052 68.9% $757,529,743 62.8% $104,069,935 34.7%
Aug '09 $119,093,055 24.4% $12,584,300 26.2% $308,879,963 102.6% $682,020,325 80.8% $84,003,213 66.9%
Aug '10 $103,284,475 43.4% $8,145,739 94.9% $395,896,062 58.1% $699,765,751 76.2% $86,723,995 61.6%
Aug '11 $122,644,762 20.8% $11,899,647 33.4% $404,948,109 54.6% $758,617,125 62.6% $91,480,895 53.2%
Aug '12 $115,804,973 27.9% $17,213,007 -7.8% $452,279,035 38.4% $878,463,947 40.4% $115,242,907 21.6%
Aug '13 $144,686,100 2.4% $18,019,899 -11.9% $504,702,571 24.0% $1,004,467,681 22.8% $128,050,306 9.5%
Aug '14 $165,826,383 -10.7% $17,820,600 -10.9% $539,946,100 15.9% $991,896,414 24.3% $133,207,244 5.2%
Aug '15 $148,102,949 $15,878,145 $625,926,621 $1,233,207,623 $140,162,462
Home Counties - Single Family Total Sales Dollars (2015 vs. Prior Years)
MLSListings Inc Confidential Copyright 2014 47
47
Condo/Townhouse Months of Inventory – San Mateo, Santa Clara, Santa Cruz
Mar ’03 – Aug ’15 (Rolling Three Month Average)
MLSListings Inc Confidential Copyright 2015 48
48
Condo/Townhouse Months of Inventory – Monterey and San Benito Counties
Mar ’03 – Aug ’15 (Rolling Three Month Average)

More Related Content

What's hot

San Francisco Market Focus November 2013
San Francisco Market Focus November 2013San Francisco Market Focus November 2013
San Francisco Market Focus November 2013
Ronny Budiutama
 
4 projected budgeting 2016 FHC Z'DUBLIN'I
4 projected budgeting 2016 FHC Z'DUBLIN'I4 projected budgeting 2016 FHC Z'DUBLIN'I
4 projected budgeting 2016 FHC Z'DUBLIN'I
Fabrice CLAMAGIRAND
 
4 projected budgeting 2016 FHC P'VEGAS'M
4 projected budgeting 2016 FHC P'VEGAS'M4 projected budgeting 2016 FHC P'VEGAS'M
4 projected budgeting 2016 FHC P'VEGAS'M
Fabrice CLAMAGIRAND
 

What's hot (18)

Market Indicators - General Overview - February 2015
Market Indicators - General Overview - February 2015Market Indicators - General Overview - February 2015
Market Indicators - General Overview - February 2015
 
October 2015 - Market Snapshot - General Overvew
October 2015 - Market Snapshot - General OvervewOctober 2015 - Market Snapshot - General Overvew
October 2015 - Market Snapshot - General Overvew
 
December 2015 - Market Snapshot - General Overview
December 2015 - Market Snapshot - General OverviewDecember 2015 - Market Snapshot - General Overview
December 2015 - Market Snapshot - General Overview
 
Market Indicators - General Overview - December 2014
Market Indicators - General Overview - December 2014Market Indicators - General Overview - December 2014
Market Indicators - General Overview - December 2014
 
February 2016 - Market Snapshot - General Overview
 February 2016 - Market Snapshot - General Overview February 2016 - Market Snapshot - General Overview
February 2016 - Market Snapshot - General Overview
 
January 2016 - Market Snapshot - General Overview
January 2016 - Market Snapshot - General OverviewJanuary 2016 - Market Snapshot - General Overview
January 2016 - Market Snapshot - General Overview
 
November 2015 - Market Snapshot - General Overview
November 2015 - Market Snapshot - General OverviewNovember 2015 - Market Snapshot - General Overview
November 2015 - Market Snapshot - General Overview
 
Market Indicators - General Overview - March 2015
Market Indicators - General Overview - March 2015Market Indicators - General Overview - March 2015
Market Indicators - General Overview - March 2015
 
March 2016 - Market Snapshot - General Overview
March 2016 - Market Snapshot - General OverviewMarch 2016 - Market Snapshot - General Overview
March 2016 - Market Snapshot - General Overview
 
San Francisco Market Focus November 2013
San Francisco Market Focus November 2013San Francisco Market Focus November 2013
San Francisco Market Focus November 2013
 
The Woodlands Homes Sales Report - February 2016
The Woodlands Homes Sales Report - February 2016The Woodlands Homes Sales Report - February 2016
The Woodlands Homes Sales Report - February 2016
 
MLS Housing Report October 2010
MLS Housing Report October 2010MLS Housing Report October 2010
MLS Housing Report October 2010
 
Fraser Valley Real Estate Board Statistics Package Jan 2021
Fraser Valley Real Estate Board Statistics Package Jan 2021Fraser Valley Real Estate Board Statistics Package Jan 2021
Fraser Valley Real Estate Board Statistics Package Jan 2021
 
4 projected budgeting 2016 FHC Z'DUBLIN'I
4 projected budgeting 2016 FHC Z'DUBLIN'I4 projected budgeting 2016 FHC Z'DUBLIN'I
4 projected budgeting 2016 FHC Z'DUBLIN'I
 
October 2015 Home Sales Report
October 2015 Home Sales ReportOctober 2015 Home Sales Report
October 2015 Home Sales Report
 
Dec 2020 Fraser Valley Real Estate Board Package
Dec 2020 Fraser Valley Real Estate Board PackageDec 2020 Fraser Valley Real Estate Board Package
Dec 2020 Fraser Valley Real Estate Board Package
 
Fraser Valley Real Estate Board Statistics Package January 2020
Fraser Valley Real Estate Board Statistics Package January 2020 Fraser Valley Real Estate Board Statistics Package January 2020
Fraser Valley Real Estate Board Statistics Package January 2020
 
4 projected budgeting 2016 FHC P'VEGAS'M
4 projected budgeting 2016 FHC P'VEGAS'M4 projected budgeting 2016 FHC P'VEGAS'M
4 projected budgeting 2016 FHC P'VEGAS'M
 

Viewers also liked (14)

S3 addressing dimensions of quality education holistically c4_r
S3 addressing dimensions of quality education holistically c4_rS3 addressing dimensions of quality education holistically c4_r
S3 addressing dimensions of quality education holistically c4_r
 
EF AP DOS Job Description 2015
EF AP DOS Job Description 2015EF AP DOS Job Description 2015
EF AP DOS Job Description 2015
 
метод Oracle (45)
метод Oracle (45)метод Oracle (45)
метод Oracle (45)
 
ahmed cv 2
ahmed cv 2ahmed cv 2
ahmed cv 2
 
защита информации (53)
защита информации (53)защита информации (53)
защита информации (53)
 
Questionnaire results
Questionnaire resultsQuestionnaire results
Questionnaire results
 
Unhcr training on consecutive interpreting
Unhcr training on consecutive interpretingUnhcr training on consecutive interpreting
Unhcr training on consecutive interpreting
 
INS2-2442895385
INS2-2442895385INS2-2442895385
INS2-2442895385
 
шаблоны проектирования (42)
шаблоны проектирования (42)шаблоны проектирования (42)
шаблоны проектирования (42)
 
Muestreo del trabajo
Muestreo del trabajoMuestreo del trabajo
Muestreo del trabajo
 
Exploring Community Resilience
Exploring Community ResilienceExploring Community Resilience
Exploring Community Resilience
 
Solución de práctica 3
Solución  de práctica 3Solución  de práctica 3
Solución de práctica 3
 
10200 123 act-2_grupal.
10200 123 act-2_grupal.10200 123 act-2_grupal.
10200 123 act-2_grupal.
 
Interview powerpoint
Interview powerpointInterview powerpoint
Interview powerpoint
 

Similar to August 2015 - Market snapshot - General Overview

March2015 market indicators-general-overview
March2015 market indicators-general-overviewMarch2015 market indicators-general-overview
March2015 market indicators-general-overview
MLSListings Inc
 
Stats Final-Traffic Fatalities
Stats Final-Traffic FatalitiesStats Final-Traffic Fatalities
Stats Final-Traffic Fatalities
Betty Trinh
 

Similar to August 2015 - Market snapshot - General Overview (20)

March2015 market indicators-general-overview
March2015 market indicators-general-overviewMarch2015 market indicators-general-overview
March2015 market indicators-general-overview
 
Market Watch TORONTO 2015 OCTOBER
Market Watch TORONTO 2015 OCTOBERMarket Watch TORONTO 2015 OCTOBER
Market Watch TORONTO 2015 OCTOBER
 
Market Watch TORONTO 2015 SEPTEMBER
Market Watch TORONTO 2015 SEPTEMBERMarket Watch TORONTO 2015 SEPTEMBER
Market Watch TORONTO 2015 SEPTEMBER
 
Boston Real Estate Report
Boston Real Estate ReportBoston Real Estate Report
Boston Real Estate Report
 
FHC P VEGAS M 2017
FHC P VEGAS M 2017FHC P VEGAS M 2017
FHC P VEGAS M 2017
 
Ram sir PPT
Ram sir PPTRam sir PPT
Ram sir PPT
 
TREB Market Watch for May 2016
TREB Market Watch for May 2016TREB Market Watch for May 2016
TREB Market Watch for May 2016
 
Market Watch May 2016
Market Watch May 2016Market Watch May 2016
Market Watch May 2016
 
2019 05 Monthly Home Sales Stats for Calgary
2019 05 Monthly Home Sales Stats for Calgary2019 05 Monthly Home Sales Stats for Calgary
2019 05 Monthly Home Sales Stats for Calgary
 
Austin Real Estate Statistics May 2013 Austin Home Team
Austin Real Estate Statistics May 2013 Austin Home TeamAustin Real Estate Statistics May 2013 Austin Home Team
Austin Real Estate Statistics May 2013 Austin Home Team
 
Hawaii Real Estate 2014 statistics trends sale report All Islands Hawaii Big ...
Hawaii Real Estate 2014 statistics trends sale report All Islands Hawaii Big ...Hawaii Real Estate 2014 statistics trends sale report All Islands Hawaii Big ...
Hawaii Real Estate 2014 statistics trends sale report All Islands Hawaii Big ...
 
The Woodlands Demographics 2015
The Woodlands Demographics 2015The Woodlands Demographics 2015
The Woodlands Demographics 2015
 
FHC KCANADAK FORECAST BUDGETING 2019
FHC KCANADAK FORECAST BUDGETING 2019FHC KCANADAK FORECAST BUDGETING 2019
FHC KCANADAK FORECAST BUDGETING 2019
 
2019 05 Monthly Home Sales Stats for ACADIA, Calgary
2019 05 Monthly Home Sales Stats for ACADIA, Calgary2019 05 Monthly Home Sales Stats for ACADIA, Calgary
2019 05 Monthly Home Sales Stats for ACADIA, Calgary
 
October 2015 Real Estate Market Report, The Woodlands, TX
October 2015 Real Estate Market Report, The Woodlands, TXOctober 2015 Real Estate Market Report, The Woodlands, TX
October 2015 Real Estate Market Report, The Woodlands, TX
 
Stats Final-Traffic Fatalities
Stats Final-Traffic FatalitiesStats Final-Traffic Fatalities
Stats Final-Traffic Fatalities
 
May 2015 Market Report, The Woodlands, TX
May 2015 Market Report, The Woodlands, TXMay 2015 Market Report, The Woodlands, TX
May 2015 Market Report, The Woodlands, TX
 
May 2015 Market Reports for The Woodlands, TX
May 2015 Market Reports for The Woodlands, TXMay 2015 Market Reports for The Woodlands, TX
May 2015 Market Reports for The Woodlands, TX
 
February 2016 Real Estate Market Report for The Woodlands, Texas
February 2016 Real Estate Market Report for The Woodlands, TexasFebruary 2016 Real Estate Market Report for The Woodlands, Texas
February 2016 Real Estate Market Report for The Woodlands, Texas
 
September 2015 Real Estate Market Report, The Woodlands, TX
September 2015 Real Estate Market Report, The Woodlands, TXSeptember 2015 Real Estate Market Report, The Woodlands, TX
September 2015 Real Estate Market Report, The Woodlands, TX
 

More from MLSListings Inc

More from MLSListings Inc (20)

April 2016 - Market Snapshot - Santa Cruz County
April 2016 - Market Snapshot - Santa Cruz CountyApril 2016 - Market Snapshot - Santa Cruz County
April 2016 - Market Snapshot - Santa Cruz County
 
April 2016 - Market Snapshot - Santa Clara County
April 2016 - Market Snapshot - Santa Clara CountyApril 2016 - Market Snapshot - Santa Clara County
April 2016 - Market Snapshot - Santa Clara County
 
April 2016 - Market Snapshot - San Mateo County
April 2016 - Market Snapshot - San Mateo CountyApril 2016 - Market Snapshot - San Mateo County
April 2016 - Market Snapshot - San Mateo County
 
April 2016 - Market Snapshot - San Benito County
April 2016 - Market Snapshot - San Benito CountyApril 2016 - Market Snapshot - San Benito County
April 2016 - Market Snapshot - San Benito County
 
April 2016 - Market Snapshot - Monterey County
April 2016 - Market Snapshot - Monterey CountyApril 2016 - Market Snapshot - Monterey County
April 2016 - Market Snapshot - Monterey County
 
April 2016 - Market Snapshot - General Overview
April 2016 - Market Snapshot - General OverviewApril 2016 - Market Snapshot - General Overview
April 2016 - Market Snapshot - General Overview
 
March 2016 - Market Snapshot - Santa Cruz County
March 2016 - Market Snapshot - Santa Cruz CountyMarch 2016 - Market Snapshot - Santa Cruz County
March 2016 - Market Snapshot - Santa Cruz County
 
March 2016 - Market Snapshot - Santa Clara County
March 2016 - Market Snapshot - Santa Clara CountyMarch 2016 - Market Snapshot - Santa Clara County
March 2016 - Market Snapshot - Santa Clara County
 
March 2016 - Market Snapshot - San Mateo County
March 2016 - Market Snapshot - San Mateo CountyMarch 2016 - Market Snapshot - San Mateo County
March 2016 - Market Snapshot - San Mateo County
 
March 2016 - Market Snapshot - San Benito County
March 2016 - Market Snapshot - San Benito CountyMarch 2016 - Market Snapshot - San Benito County
March 2016 - Market Snapshot - San Benito County
 
March 2016 - Market Snapshot - Monterey County
March 2016 - Market Snapshot - Monterey CountyMarch 2016 - Market Snapshot - Monterey County
March 2016 - Market Snapshot - Monterey County
 
February 2016 - Market Snapshot - Santa Cruz County
February 2016 - Market Snapshot - Santa Cruz County February 2016 - Market Snapshot - Santa Cruz County
February 2016 - Market Snapshot - Santa Cruz County
 
February 2016 - Market Snapshot - Santa Clara County
February 2016 - Market Snapshot - Santa Clara County February 2016 - Market Snapshot - Santa Clara County
February 2016 - Market Snapshot - Santa Clara County
 
February 2016 - Market Snapshot - San Mateo County
February 2016 - Market Snapshot - San Mateo County February 2016 - Market Snapshot - San Mateo County
February 2016 - Market Snapshot - San Mateo County
 
February 2016 - Market Snapshot - San Benito County
February 2016 - Market Snapshot - San Benito County February 2016 - Market Snapshot - San Benito County
February 2016 - Market Snapshot - San Benito County
 
February 2016 - Market Snapshot - Monterey County
 February 2016 - Market Snapshot - Monterey County February 2016 - Market Snapshot - Monterey County
February 2016 - Market Snapshot - Monterey County
 
January 2016 - Market Snapshot - Santa Cruz County
January 2016 - Market Snapshot - Santa Cruz CountyJanuary 2016 - Market Snapshot - Santa Cruz County
January 2016 - Market Snapshot - Santa Cruz County
 
January 2016 - Market Snapshot - Santa Clara County
January 2016 - Market Snapshot - Santa Clara CountyJanuary 2016 - Market Snapshot - Santa Clara County
January 2016 - Market Snapshot - Santa Clara County
 
January 2016 - Market Snapshot - San Mateo County
January 2016 - Market Snapshot - San Mateo CountyJanuary 2016 - Market Snapshot - San Mateo County
January 2016 - Market Snapshot - San Mateo County
 
January 2016 - Market Snapshot - San Benito County
January 2016 - Market Snapshot - San Benito CountyJanuary 2016 - Market Snapshot - San Benito County
January 2016 - Market Snapshot - San Benito County
 

Recently uploaded

9990771857 Call Girls in Dwarka Sector 6 Delhi (Call Girls) Delhi
9990771857 Call Girls in Dwarka Sector 6 Delhi (Call Girls) Delhi9990771857 Call Girls in Dwarka Sector 6 Delhi (Call Girls) Delhi
9990771857 Call Girls in Dwarka Sector 6 Delhi (Call Girls) Delhi
delhimodel235
 
Call Girls In Krishna Nagar Delhi (Escort)↫8447779280↬@SHOT 1500- NIGHT 5500→...
Call Girls In Krishna Nagar Delhi (Escort)↫8447779280↬@SHOT 1500- NIGHT 5500→...Call Girls In Krishna Nagar Delhi (Escort)↫8447779280↬@SHOT 1500- NIGHT 5500→...
Call Girls In Krishna Nagar Delhi (Escort)↫8447779280↬@SHOT 1500- NIGHT 5500→...
asmaqueen5
 
9990771857 Call Girls in Dwarka Sector 3 Delhi (Call Girls) Delhi
9990771857 Call Girls in Dwarka Sector 3 Delhi (Call Girls) Delhi9990771857 Call Girls in Dwarka Sector 3 Delhi (Call Girls) Delhi
9990771857 Call Girls in Dwarka Sector 3 Delhi (Call Girls) Delhi
delhimodel235
 
Cheap Rate ✨➥9711108085▻✨Call Girls In Malviya Nagar(Delhi)
Cheap Rate ✨➥9711108085▻✨Call Girls In Malviya Nagar(Delhi)Cheap Rate ✨➥9711108085▻✨Call Girls In Malviya Nagar(Delhi)
Cheap Rate ✨➥9711108085▻✨Call Girls In Malviya Nagar(Delhi)
delhi24hrs1
 
ACE Terra Yamuna Expressway | 8929888700
ACE Terra Yamuna Expressway | 8929888700ACE Terra Yamuna Expressway | 8929888700
ACE Terra Yamuna Expressway | 8929888700
Truhomes
 
9990771857 Call Girls Dwarka Sector 9 Delhi (Call Girls ) Delhi
9990771857 Call Girls Dwarka Sector 9 Delhi (Call Girls ) Delhi9990771857 Call Girls Dwarka Sector 9 Delhi (Call Girls ) Delhi
9990771857 Call Girls Dwarka Sector 9 Delhi (Call Girls ) Delhi
delhimodel235
 
Bptp The Amaario Launch Luxury Project Sector 37D Gurgaon Dwarka Expressway...
Bptp The Amaario Launch  Luxury Project  Sector 37D Gurgaon Dwarka Expressway...Bptp The Amaario Launch  Luxury Project  Sector 37D Gurgaon Dwarka Expressway...
Bptp The Amaario Launch Luxury Project Sector 37D Gurgaon Dwarka Expressway...
ApartmentWala1
 
9990771857 Call Girls in Dwarka Sector 137 Noida (Call Girls) Delhi
9990771857 Call Girls in Dwarka Sector 137 Noida (Call Girls) Delhi9990771857 Call Girls in Dwarka Sector 137 Noida (Call Girls) Delhi
9990771857 Call Girls in Dwarka Sector 137 Noida (Call Girls) Delhi
delhimodel235
 
9990771857 Call Girls in Dwarka Sector 1 Delhi (Call Girls) Delhi
9990771857 Call Girls in Dwarka Sector 1 Delhi (Call Girls) Delhi9990771857 Call Girls in Dwarka Sector 1 Delhi (Call Girls) Delhi
9990771857 Call Girls in Dwarka Sector 1 Delhi (Call Girls) Delhi
delhimodel235
 
Acibadem Konaklari Uskudar - Listin Turkey
Acibadem Konaklari Uskudar - Listin TurkeyAcibadem Konaklari Uskudar - Listin Turkey
Acibadem Konaklari Uskudar - Listin Turkey
Listing Turkey
 

Recently uploaded (20)

BDSM⚡Call Girls in Sector 55 Noida Escorts >༒8448380779 Escort Service
BDSM⚡Call Girls in Sector 55 Noida Escorts >༒8448380779 Escort ServiceBDSM⚡Call Girls in Sector 55 Noida Escorts >༒8448380779 Escort Service
BDSM⚡Call Girls in Sector 55 Noida Escorts >༒8448380779 Escort Service
 
BDSM⚡Call Girls in Sector 57 Noida Escorts >༒8448380779 Escort Service
BDSM⚡Call Girls in Sector 57 Noida Escorts >༒8448380779 Escort ServiceBDSM⚡Call Girls in Sector 57 Noida Escorts >༒8448380779 Escort Service
BDSM⚡Call Girls in Sector 57 Noida Escorts >༒8448380779 Escort Service
 
9990771857 Call Girls in Dwarka Sector 6 Delhi (Call Girls) Delhi
9990771857 Call Girls in Dwarka Sector 6 Delhi (Call Girls) Delhi9990771857 Call Girls in Dwarka Sector 6 Delhi (Call Girls) Delhi
9990771857 Call Girls in Dwarka Sector 6 Delhi (Call Girls) Delhi
 
SVN Live 5.6.24 Weekly Property Broadcast
SVN Live 5.6.24 Weekly Property BroadcastSVN Live 5.6.24 Weekly Property Broadcast
SVN Live 5.6.24 Weekly Property Broadcast
 
Kohinoor Teiko Hinjewadi Phase 2 Pune E-Brochure.pdf
Kohinoor Teiko Hinjewadi Phase 2 Pune  E-Brochure.pdfKohinoor Teiko Hinjewadi Phase 2 Pune  E-Brochure.pdf
Kohinoor Teiko Hinjewadi Phase 2 Pune E-Brochure.pdf
 
Kolte Patil Kharadi Pune E Brochure.pdf
Kolte Patil Kharadi Pune E  Brochure.pdfKolte Patil Kharadi Pune E  Brochure.pdf
Kolte Patil Kharadi Pune E Brochure.pdf
 
Call Girls In Krishna Nagar Delhi (Escort)↫8447779280↬@SHOT 1500- NIGHT 5500→...
Call Girls In Krishna Nagar Delhi (Escort)↫8447779280↬@SHOT 1500- NIGHT 5500→...Call Girls In Krishna Nagar Delhi (Escort)↫8447779280↬@SHOT 1500- NIGHT 5500→...
Call Girls In Krishna Nagar Delhi (Escort)↫8447779280↬@SHOT 1500- NIGHT 5500→...
 
9990771857 Call Girls in Dwarka Sector 3 Delhi (Call Girls) Delhi
9990771857 Call Girls in Dwarka Sector 3 Delhi (Call Girls) Delhi9990771857 Call Girls in Dwarka Sector 3 Delhi (Call Girls) Delhi
9990771857 Call Girls in Dwarka Sector 3 Delhi (Call Girls) Delhi
 
Majestique Viman Nagar Pune Brochure.pdf
Majestique Viman Nagar Pune Brochure.pdfMajestique Viman Nagar Pune Brochure.pdf
Majestique Viman Nagar Pune Brochure.pdf
 
Kohinoor Hinjewadi Phase 2 Pune E-Brochure.pdf
Kohinoor Hinjewadi Phase 2 Pune  E-Brochure.pdfKohinoor Hinjewadi Phase 2 Pune  E-Brochure.pdf
Kohinoor Hinjewadi Phase 2 Pune E-Brochure.pdf
 
Parksville 96 Surrey Floor Plans May 2024
Parksville 96 Surrey Floor Plans May 2024Parksville 96 Surrey Floor Plans May 2024
Parksville 96 Surrey Floor Plans May 2024
 
Cheap Rate ✨➥9711108085▻✨Call Girls In Malviya Nagar(Delhi)
Cheap Rate ✨➥9711108085▻✨Call Girls In Malviya Nagar(Delhi)Cheap Rate ✨➥9711108085▻✨Call Girls In Malviya Nagar(Delhi)
Cheap Rate ✨➥9711108085▻✨Call Girls In Malviya Nagar(Delhi)
 
ACE Terra Yamuna Expressway | 8929888700
ACE Terra Yamuna Expressway | 8929888700ACE Terra Yamuna Expressway | 8929888700
ACE Terra Yamuna Expressway | 8929888700
 
9990771857 Call Girls Dwarka Sector 9 Delhi (Call Girls ) Delhi
9990771857 Call Girls Dwarka Sector 9 Delhi (Call Girls ) Delhi9990771857 Call Girls Dwarka Sector 9 Delhi (Call Girls ) Delhi
9990771857 Call Girls Dwarka Sector 9 Delhi (Call Girls ) Delhi
 
Bptp The Amaario Launch Luxury Project Sector 37D Gurgaon Dwarka Expressway...
Bptp The Amaario Launch  Luxury Project  Sector 37D Gurgaon Dwarka Expressway...Bptp The Amaario Launch  Luxury Project  Sector 37D Gurgaon Dwarka Expressway...
Bptp The Amaario Launch Luxury Project Sector 37D Gurgaon Dwarka Expressway...
 
Premium Villa Projects in Sarjapur Road Bengaluru
Premium Villa Projects in Sarjapur Road BengaluruPremium Villa Projects in Sarjapur Road Bengaluru
Premium Villa Projects in Sarjapur Road Bengaluru
 
9990771857 Call Girls in Dwarka Sector 137 Noida (Call Girls) Delhi
9990771857 Call Girls in Dwarka Sector 137 Noida (Call Girls) Delhi9990771857 Call Girls in Dwarka Sector 137 Noida (Call Girls) Delhi
9990771857 Call Girls in Dwarka Sector 137 Noida (Call Girls) Delhi
 
9990771857 Call Girls in Dwarka Sector 1 Delhi (Call Girls) Delhi
9990771857 Call Girls in Dwarka Sector 1 Delhi (Call Girls) Delhi9990771857 Call Girls in Dwarka Sector 1 Delhi (Call Girls) Delhi
9990771857 Call Girls in Dwarka Sector 1 Delhi (Call Girls) Delhi
 
Acibadem Konaklari Uskudar - Listin Turkey
Acibadem Konaklari Uskudar - Listin TurkeyAcibadem Konaklari Uskudar - Listin Turkey
Acibadem Konaklari Uskudar - Listin Turkey
 
TENANT SCREENING REPORT SERVICES​ How Tenant Screening Reports Work
TENANT SCREENING REPORT SERVICES​ How Tenant Screening Reports WorkTENANT SCREENING REPORT SERVICES​ How Tenant Screening Reports Work
TENANT SCREENING REPORT SERVICES​ How Tenant Screening Reports Work
 

August 2015 - Market snapshot - General Overview

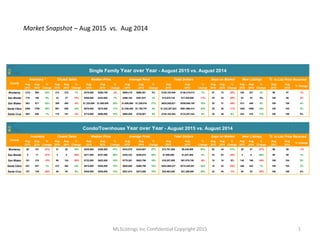
  • 1. MLSListings Inc Confidential Copyright 2015 1 Market Snapshot – Aug 2015 vs. Aug 2014 Aug 2015 Aug 2014 % Change Aug 2015 Aug 2014 % Change Aug 2015 Aug 2014 % Change Aug 2015 Aug 2014 % Change Aug 2015 Aug 2014 % Change Aug 2015 Aug 2014 % Change Aug 2015 Aug 2014 % Change Aug 2015 Aug 2014 % Change Monterey 1210 994 22% 213 210 1% $470,000 $488,750 -4% $695,319 $696,261 0% $148,102,949 $146,215,013 1% 57 73 -22% 330 321 3% 98 97 1% San Benito 178 168 6% 32 37 -14% $456,000 $424,900 7% $496,192 $481,637 3% $15,878,145 $17,820,600 -11% 25 34 -26% 53 53 0% 100 98 2% San Mateo 893 671 33% 389 408 -5% $1,235,000 $1,000,000 24% $1,609,066 $1,329,916 21% $625,926,621 $539,946,100 16% 20 31 -35% 473 450 5% 109 105 4% Santa Clara 2464 1786 38% 987 858 15% $970,000 $875,000 11% $1,249,450 $1,158,757 8% $1,233,207,623 $991,896,414 24% 25 28 -11% 1204 1098 10% 105 103 2% Santa Cruz 694 646 7% 175 181 -3% $715,000 $650,000 10% $800,928 $735,951 9% $140,162,462 $133,207,244 5% 38 36 6% 243 219 11% 100 100 0% Aug 2015 Aug 2014 % Change Aug 2015 Aug 2014 % Change Aug 2015 Aug 2014 % Change Aug 2015 Aug 2014 % Change Aug 2015 Aug 2014 % Change Aug 2015 Aug 2014 % Change Aug 2015 Aug 2014 % Change Aug 2015 Aug 2014 % Change Monterey 80 101 -21% 31 26 19% $455,000 $309,500 47% $443,919 $324,607 37% $13,761,500 $8,439,800 63% 62 44 41% 30 41 -27% 98 99 -1% San Benito 8 11 -27% 3 4 -25% $371,500 $237,650 56% $353,333 $256,875 38% $1,060,000 $1,027,500 3% 43 63 -32% 3 6 -50% 99 98 1% San Mateo 191 216 -12% 99 124 -20% $723,000 $622,000 16% $770,281 $653,796 18% $76,257,859 $81,070,740 -6% 18 18 0% 140 166 -16% 109 104 5% Santa Clara 641 637 1% 414 362 14% $615,000 $550,000 12% $685,665 $596,799 15% $283,865,237 $215,444,551 32% 18 24 -25% 446 443 1% 106 103 3% Santa Cruz 107 148 -28% 49 45 9% $450,000 $400,000 13% $521,674 $473,088 10% $25,562,046 $21,289,000 20% 42 45 -7% 40 53 -25% 100 100 0% % to List Price Received Condo/Townhouse Year over Year - August 2015 vs. August 2014 % to List Price Received Single Family Year over Year - August 2015 vs. August 2014 New Listings Total Dollars Days on Market New Listings County Inventory * Closed Sales Median Price Average Price Total Dollars Days on Market County Inventory Closed Sales Median Price Average Price
  • 2. MLSListings Inc Confidential Copyright 2015 2 Market Snapshot – Aug 2015 vs. Jul 2015 Jul 2015 Aug 2015 % Change Jul 2015 Aug 2015 % Change Jul 2015 Aug 2015 % Change Jul 2015 Aug 2015 % Change Jul 2015 Aug 2015 % Change Jul 2015 Aug 2015 % Change Jul 2015 Aug 2015 % Change Jul 2015 Aug 2015 % Change Monterey 1128 1210 7% 281 213 -32% $485,000 $470,000 -3% $741,183 $695,319 -7% $209,013,551 $148,102,949 -41% 58 57 -2% 336 330 -2% 98 98 0% San Benito 161 178 10% 57 32 -78% $450,000 $456,000 1% $524,063 $496,192 -6% $29,871,588 $15,878,145 -88% 69 25 -176% 71 53 -34% 99 100 1% San Mateo 842 893 6% 441 389 -13% $1,300,000 $1,235,000 -5% $1,653,193 $1,609,066 -3% $729,058,010 $625,926,621 -16% 21 20 -5% 486 473 -3% 110 109 -1% Santa Clara 2447 2464 1% 1099 987 -11% $965,000 $970,000 1% $1,234,265 $1,249,450 1% $1,357,691,180 $1,233,207,623 -10% 23 25 8% 1393 1204 -16% 105 105 0% Santa Cruz 687 694 1% 227 175 -30% $750,000 $715,000 -5% $829,653 $800,928 -4% $188,331,205 $140,162,462 -34% 45 38 -18% 266 243 -9% 99 100 1% Jul 2015 Aug 2015 % Change Jul 2015 Aug 2015 % Change Jul 2015 Aug 2015 % Change Jul 2015 Aug 2015 % Change Jul 2015 Aug 2015 % Change Jul 2015 Aug 2015 % Change Jul 2015 Aug 2015 % Change Jul 2015 Aug 2015 % Change Monterey 89 80 -11% 43 31 -39% $374,000 $455,000 18% $541,282 $443,919 -22% $23,275,137 $13,761,500 -69% 44 62 29% 25 30 17% 99 98 -1% San Benito 7 8 13% 2 3 33% $314,000 $371,500 15% $314,000 $353,333 11% $628,000 $1,060,000 41% 3 43 93% 9 3 -200% 103 99 -4% San Mateo 171 191 10% 122 99 -23% $708,000 $723,000 2% $756,692 $770,281 2% $91,559,682 $76,257,859 -20% 18 18 0% 130 140 7% 106 109 3% Santa Clara 672 641 -5% 434 414 -5% $635,000 $615,000 -3% $697,064 $685,665 -2% $302,525,730 $283,865,237 -7% 18 18 0% 499 446 -12% 107 106 -1% Santa Cruz 126 107 -18% 62 49 -27% $457,539 $450,000 -2% $468,577 $521,674 10% $29,051,777 $25,562,046 -14% 38 42 10% 61 40 -53% 101 100 -1% % to List Price Received Condo/Townhouse - Current Month vs. Prior Month - August 2015 vs. July 2015 County Inventory Closed Sales Median Price Average Price Total Dollars Days on Market New Listings Total Dollars Days on Market New Listings Single Family - Current Month vs. Prior Month - August 2015 vs. July 2015 County Inventory Closed Sales Median Price Average Price % to List Price Received
  • 3. MLSListings Inc Confidential Copyright 2015 3 3 Single Family + Condo/Townhouse Inventory, Closed Sales, New Listings - Home Counties Jan ’03 – Aug ’15
  • 4. MLSListings Inc Confidential Copyright 2015 4 4 Single Family + Condo/Townhouse Inventory - Home Counties Jan ’03 – Aug ’15
  • 5. MLSListings Inc Confidential Copyright 2015 5 5 Single Family + Condo/Townhouse Inventory - Home Counties Jan ’05 – Aug ’15 2005 2006 2007 2008 2009 2010 2011 2012 2013 2014 2015 Jan 4223 7295 8588 12447 12693 8558 10330 8140 3179 3578 4175 Feb 4839 8023 9184 13528 13079 9650 10803 8231 4296 3924 3932 Mar 5502 8827 10357 14355 13240 10910 11127 7991 4286 4322 5515 Apr 6434 9722 11812 15513 12806 11773 11506 7630 4765 4776 5944 May 7020 10819 12923 15787 11749 11903 11730 7712 5222 3520 6069 Jun 7189 11493 13287 15802 11104 12691 11740 7570 5616 5322 5233 Jul 7878 12317 13910 15948 10763 13016 11372 7306 5950 4389 6330 Aug 8030 12122 14275 15356 10044 13072 11201 7116 5850 5378 5439 Sep 8798 12239 13943 15192 9823 13294 10944 6523 5806 5290 Oct 8946 11490 14020 15070 9295 12440 10241 6173 5384 4863 Nov 8252 9968 13308 13849 8724 11500 9482 5292 4592 3925 Dec 6372 7874 11420 12221 7778 9825 7790 3901 3198 3174 Aug '05 8030 Aug '06 12122 Aug '07 14275 Aug '08 15356 Aug '09 10044 Aug '10 13072 Aug '11 11201 Aug '12 7116 Aug '13 5850 Aug '14 5378 Aug '15 5439 Home Counties Inventory -32.3% -55.1% -61.9% -64.6% -45.8% -58.4% -51.4% -23.6% -7.0% 1.1% Home Counties - Single Family + Condo/Townhouse Inventory Variance to prior Years 0 2000 4000 6000 8000 10000 12000 14000 16000 Aug '05 Aug '06 Aug '07 Aug '08 Aug '09 Aug '10 Aug '11 Aug '12 Aug '13 Aug '14 Aug '15 15356 5439
  • 6. MLSListings Inc Confidential Copyright 2015 6 6 Single Family Inventory – San Mateo, Santa Clara Counties Jan ’04 – Aug ’15
  • 7. MLSListings Inc Confidential Copyright 2015 7 7 Single Family Inventory – Monterey, San Benito, Santa Cruz Counties Jan ’04 – Aug ’15
  • 8. MLSListings Inc Confidential Copyright 2015 8 8 Single Family Inventory - Home Counties Aug (2004 – 2015)
  • 9. MLSListings Inc Confidential Copyright 2015 9 9 Single Family Inventory - Home Counties Aug (2004 – 2015) Monterey County San Benito County San Mateo County Santa Clara County Santa Cruz County Aug '04 1087 11.3% 212 -16.0% 1066 -16.2% 2912 -15.4% 821 -15.5% Aug '05 1489 -18.7% 250 -28.8% 1095 -18.4% 2816 -12.5% 884 -21.5% Aug '06 2507 -51.7% 410 -56.6% 1443 -38.1% 3889 -36.6% 1355 -48.8% Aug '07 2892 -58.2% 488 -63.5% 1685 -47.0% 4893 -49.6% 1326 -47.7% Aug '08 2740 -55.8% 484 -63.2% 1773 -49.6% 5963 -58.7% 1283 -45.9% Aug '09 1548 -21.8% 237 -24.9% 1486 -39.9% 3558 -30.7% 966 -28.2% Aug '10 1899 -36.3% 306 -41.8% 1980 -54.9% 4720 -47.8% 1102 -37.0% Aug '11 1681 -28.0% 304 -41.4% 1733 -48.5% 3906 -36.9% 1014 -31.6% Aug '12 1204 0.5% 209 -14.8% 1063 -16.0% 2371 3.9% 822 -15.6% Aug '13 984 23.0% 156 14.1% 814 9.7% 1956 26.0% 679 2.2% Aug '14 994 21.7% 168 6.0% 671 33.1% 1786 38.0% 646 7.4% Aug '15 1210 178 893 2464 694 Home Counties - Single Family Inventory (2015 vs. Prior Years)
  • 10. MLSListings Inc Confidential Copyright 2015 10 10 Single Family Months of Inventory – San Mateo, Santa Clara, Santa Cruz Mar ’03 – Aug ’15 (Rolling Three Month Average)
  • 11. MLSListings Inc Confidential Copyright 2015 11 11 Single Family Months of Inventory – Monterey and San Benito Counties Mar ’03 – Aug ’15 (Rolling Three Month Average)
  • 12. MLSListings Inc Confidential Copyright 2015 12 12 Single Family Market Outlook – Home Counties Aug ’14 vs. Aug ’15
  • 13. MLSListings Inc Confidential Copyright 2015 13 13 Single Family + Condo/Townhouse Closed Sales – Home Counties Jan ’03 – Aug ’15
  • 14. MLSListings Inc Confidential Copyright 2015 14 14 Single Family + Condo/Townhouse Closed Sales - Home Counties Jan ’05 – Aug ’15 2005 2006 2007 2008 2009 2010 2011 2012 2013 2014 2015 Jan 2078 1638 1539 877 1390 1529 1574 1552 1460 1330 1182 Feb 2048 1762 1658 1063 1497 1537 1648 1785 1597 1371 921 Mar 3210 2775 2248 1388 1916 2197 2399 2520 2289 1882 2068 Apr 3407 2595 2101 1664 2158 2245 2329 2517 2468 2402 2527 May 3376 2706 2270 1953 2355 2805 2369 2885 2780 2484 2407 Jun 3836 2847 2353 2123 2808 2592 2633 2639 2543 2456 2045 Jul 3396 2446 2136 2230 2788 2299 2238 2457 2643 1933 2769 Aug 3538 2668 1962 2244 2421 2196 2446 2525 2559 2255 2392 Sep 3312 2186 1223 2127 2503 2037 2144 2194 2258 2270 Oct 2881 2219 1426 2114 2577 1994 2008 2456 2404 2312 Nov 2667 2182 1328 1594 2138 1930 2038 2273 1899 1787 Dec 2408 2066 1201 1810 2325 2234 2201 2230 1859 1371 Aug '05 3538 Aug '06 2668 Aug '07 1962 Aug '08 2244 Aug '09 2421 Aug '10 2196 Aug '11 2446 Aug '12 2525 Aug '13 2559 Aug '14 2255 Aug '15 2392 Home Counties Closed Sales Variance to prior Years Home Counties - Single Family + Condo/Townhouse Closed Sales 8.9% -2.2% -5.3% -6.5% -32.4% -10.3% 21.9% 6.6% 6.1% -1.2% 0 500 1000 1500 2000 2500 3000 3500 4000 Aug '05 Aug '06 Aug '07 Aug '08 Aug '09 Aug '10 Aug '11 Aug '12 Aug '13 Aug '14 Aug '15 3538 2392
  • 15. MLSListings Inc Confidential Copyright 2015 15 15 Single Family Closed Sales – San Mateo, Santa Clara Counties Jan ’04 – Aug ’15
  • 16. MLSListings Inc Confidential Copyright 2015 16 16 Single Family Closed Sales – San Mateo, Santa Clara Counties Aug (2004 – 2015)
  • 17. MLSListings Inc Confidential Copyright 2015 17 17 Single Family Closed Sales – Monterey, San Benito, Santa Cruz Counties Jan ’04 – Aug ’15
  • 18. MLSListings Inc Confidential Copyright 2015 18 18 Single Family Closed Sales – Monterey, San Benito, Santa Cruz Counties Aug (2004 – 2015)
  • 19. MLSListings Inc Confidential Copyright 2015 19 19 Single Family Closed Sales – Home Counties Aug (2004 – 2015) Monterey County San Benito County San Mateo County Santa Clara County Santa Cruz County Aug '04 328 -35.1% 75 -57.3% 560 -30.5% 1547 -36.2% 257 -31.9% Aug '05 319 -33.2% 78 -59.0% 592 -34.3% 1404 -29.7% 228 -23.2% Aug '06 202 5.4% 39 -17.9% 464 -16.2% 1080 -8.6% 185 -5.4% Aug '07 127 67.7% 21 52.4% 371 4.9% 787 25.4% 137 27.7% Aug '08 319 -33.2% 62 -48.4% 376 3.5% 893 10.5% 153 14.4% Aug '09 361 -41.0% 43 -25.6% 365 6.6% 979 0.8% 160 9.4% Aug '10 274 -22.3% 27 18.5% 394 -1.3% 864 14.2% 150 16.7% Aug '11 269 -20.8% 41 -22.0% 430 -9.5% 991 -0.4% 164 6.7% Aug '12 257 -17.1% 46 -30.4% 422 -7.8% 1023 -3.5% 196 -10.7% Aug '13 218 -2.3% 44 -27.3% 419 -7.2% 990 -0.3% 191 -8.4% Aug '14 210 1.4% 37 -13.5% 408 -4.7% 858 15.0% 181 -3.3% Aug '15 213 32 389 987 175 Home Counties - Single Family Sales (2015 vs. Prior Years)
  • 20. MLSListings Inc Confidential Copyright 2015 20 20 Single Family Total Sales Dollars – San Mateo and Santa Clara Counties Jan ’04 – Aug ’15
  • 21. MLSListings Inc Confidential Copyright 2015 21 21 Single Family Total Sales Dollars – San Mateo, Santa Clara Counties Aug (2004 – 2015)
  • 22. MLSListings Inc Confidential Copyright 2015 22 22 Single Family Total Sales Dollars – Santa Cruz, Monterey, and San Benito Counties Jan ’04 – Aug ’15
  • 23. MLSListings Inc Confidential Copyright 2015 23 23 Single Family Total Sales Dollars – Monterey, San Benito, Santa Cruz Counties Aug (2004 – 2015)
  • 24. MLSListings Inc Confidential Copyright 2015 24 24 Single Family Total Sales Volume – Home Counties Aug (2004 – 2015) Monterey County San Benito County San Mateo County Santa Clara County Santa Cruz County Aug '04 $216,807,098 -31.7% $41,996,243 -62.2% $555,934,304 12.6% $1,148,599,581 7.4% $190,337,321 -26.4% Aug '05 $277,408,894 -46.6% $53,533,365 -70.3% $665,670,583 -6.0% $1,297,901,625 -5.0% $197,942,019 -29.2% Aug '06 $191,281,300 -22.6% $28,910,199 -45.1% $510,369,288 22.6% $1,019,524,309 21.0% $157,795,655 -11.2% Aug '07 $134,367,225 10.2% $21,420,575 -25.9% $434,235,019 44.1% $853,664,556 44.5% $121,868,583 15.0% Aug '08 $141,173,604 4.9% $20,999,900 -24.4% $370,591,052 68.9% $757,529,743 62.8% $104,069,935 34.7% Aug '09 $119,093,055 24.4% $12,584,300 26.2% $308,879,963 102.6% $682,020,325 80.8% $84,003,213 66.9% Aug '10 $103,284,475 43.4% $8,145,739 94.9% $395,896,062 58.1% $699,765,751 76.2% $86,723,995 61.6% Aug '11 $122,644,762 20.8% $11,899,647 33.4% $404,948,109 54.6% $758,617,125 62.6% $91,480,895 53.2% Aug '12 $115,804,973 27.9% $17,213,007 -7.8% $452,279,035 38.4% $878,463,947 40.4% $115,242,907 21.6% Aug '13 $144,686,100 2.4% $18,019,899 -11.9% $504,702,571 24.0% $1,004,467,681 22.8% $128,050,306 9.5% Aug '14 $165,826,383 -10.7% $17,820,600 -10.9% $539,946,100 15.9% $991,896,414 24.3% $133,207,244 5.2% Aug '15 $148,102,949 $15,878,145 $625,926,621 $1,233,207,623 $140,162,462 Home Counties - Single Family Total Sales Dollars (2015 vs. Prior Years)
  • 25. MLSListings Inc Confidential Copyright 2015 25 25 Single Family + Condo/Townhouse New Listings - Home Counties Jan ’03 – Aug ’15
  • 26. MLSListings Inc Confidential Copyright 2015 26 26 Single Family + Condo/Townhouse New Listings - Home Counties Jan ’04 – Aug ’15
  • 27. MLSListings Inc Confidential Copyright 2015 27 27 Single Family New Listings – San Mateo, Santa Clara Counties Aug ’04 – Aug ’15
  • 28. MLSListings Inc Confidential Copyright 2015 28 28 Single Family New Listings – Monterey, San Benito, Santa Cruz Counties Jan ’04 – Aug ’15
  • 29. MLSListings Inc Confidential Copyright 2015 29 29 Single Family New Listings – Monterey, San Benito, Santa Cruz Counties Aug ’04 – Aug ’15
  • 30. MLSListings Inc Confidential Copyright 2015 30 30 Single Family New Listings - Home Counties Aug (2004 – 2015) Monterey County San Benito County San Mateo County Santa Clara County Santa Cruz County Aug '04 442 -25.3% 103 -48.5% 674 -29.8% 2044 -41.1% 387 -37.2% Aug '05 648 -49.1% 131 -59.5% 749 -36.8% 2168 -44.5% 445 -45.4% Aug '06 625 -47.2% 132 -59.8% 730 -35.2% 2114 -43.0% 468 -48.1% Aug '07 556 -40.6% 119 -55.5% 680 -30.4% 1952 -38.3% 313 -22.4% Aug '08 654 -49.5% 113 -53.1% 588 -19.6% 1820 -33.8% 280 -13.2% Aug '09 478 -31.0% 86 -38.4% 566 -16.4% 1419 -15.2% 249 -2.4% Aug '10 449 -26.5% 88 -39.8% 616 -23.2% 1614 -25.4% 253 -4.0% Aug '11 269 22.7% 41 29.3% 430 10.0% 991 21.5% 164 48.2% Aug '12 334 -1.2% 75 -29.3% 521 -9.2% 1170 2.9% 220 10.5% Aug '13 327 0.9% 73 -27.4% 507 -6.7% 1205 -0.1% 244 -0.4% Aug '14 321 2.8% 53 0.0% 450 5.1% 1098 9.7% 219 11.0% Aug '15 330 53 473 1204 243 Home Counties - Single Family New Listings (2015 vs. Prior Years)
  • 31. MLSListings Inc Confidential Copyright 2015 31 31 Single Family New Listings - Home Counties Jan ‘05 – Aug ‘15 2005 2006 2007 2008 2009 2010 2011 2012 2013 2014 2015 Jan 3291 4061 3519 3947 3907 3334 3380 2890 2170 2164 1727 Feb 3561 4080 3508 4353 3867 3711 3373 3011 2534 2496 1616 Mar 4912 5140 4828 4785 4397 4649 3953 3313 3011 3081 3129 Apr 5359 4787 4745 5185 3909 4613 3916 3151 3499 3380 3324 May 5224 6019 5279 4934 3636 4044 3986 3551 3592 3520 3298 Jun 5392 6152 4894 4840 3820 4423 3784 3132 3358 3209 2480 Jul 5210 5523 4747 4530 3915 4089 3429 3096 3529 2420 3204 Aug 5450 5356 4720 4344 3612 3867 3342 2941 3163 2850 2962 Sep 5544 4810 4143 4632 3608 3726 3095 2619 3016 2924 Oct 5106 3763 4202 4468 3480 3267 2988 2732 2650 2497 Nov 3648 2646 3034 3098 2700 2657 2355 1923 1774 1531 Dec 1929 1666 2223 2656 2219 2088 1724 1237 1113 705 Aug '05 5450 Aug '06 5356 Aug '07 4720 Aug '08 4344 Aug '09 3612 Aug '10 3867 Aug '11 3342 Aug '12 2941 Aug '13 3163 Aug '14 2850 Aug '15 2962 -18.0% -23.4% Variance to prior Years Home Counties New Listings -45.7% -11.4% 0.7% -6.4% -44.7% -37.2% -31.8% Home Counties - Single Family + Condo/Townhouse New Listings 3.9% 0 1000 2000 3000 4000 5000 6000 Aug '05 Aug '06 Aug '07 Aug '08 Aug '09 Aug '10 Aug '11 Aug '12 Aug '13 Aug '14 Aug '15 5450 2962
  • 32. MLSListings Inc Confidential Copyright 2015 32 32 Single Family Median Prices – San Mateo, Santa Clara Counties Jan ’04 – Aug ’15
  • 33. MLSListings Inc Confidential Copyright 2015 33 33 Single Family Median Prices – Monterey, San Benito, Santa Cruz Counties Jan ’04 – Aug ’15
  • 34. MLSListings Inc Confidential Copyright 2015 34 34 Single Family Median Prices - Home Counties Aug (2004 – 2015)
  • 35. MLSListings Inc Confidential Copyright 2015 35 35 Single Family Median Prices - Home Counties Aug (2004 – 2015) Monterey County San Benito County San Mateo County Santa Clara County Santa Cruz County Aug '04 $555,000 -15.3% $530,000 -14.0% $779,000 58.5% $625,000 55.2% $639,000 11.9% Aug '05 $690,000 -31.9% $605,000 -24.6% $890,000 38.8% $760,000 27.6% $783,000 -8.7% Aug '06 $675,000 -30.4% $599,900 -24.0% $850,000 45.3% $770,000 26.0% $765,000 -6.5% Aug '07 $799,500 -41.2% $560,000 -18.6% $950,000 30.0% $860,000 12.8% $790,000 -9.5% Aug '08 $305,000 54.1% $307,500 48.3% $795,000 55.3% $651,750 48.8% $585,000 22.2% Aug '09 $235,000 100.0% $270,000 68.9% $682,500 81.0% $560,000 73.2% $497,750 43.6% Aug '10 $260,000 80.8% $280,000 62.9% $790,000 56.3% $629,500 54.1% $522,500 36.8% Aug '11 $252,000 86.5% $252,000 81.0% $750,000 64.7% $600,000 61.7% $490,000 45.9% Aug '12 $320,000 46.9% $335,500 35.9% $780,000 58.3% $671,250 44.5% $540,000 32.4% Aug '13 $416,000 13.0% $387,000 17.8% $989,500 24.8% $815,000 19.0% $630,000 13.5% Aug '14 $488,750 -3.8% $424,900 7.3% $1,000,000 23.5% $875,000 10.9% $650,000 10.0% Aug '15 $470,000 $456,000 $1,235,000 $970,000 $715,000 Home Counties - Single Family Median Price (2015 vs. Prior Years)
  • 36. MLSListings Inc Confidential Copyright 2015 36 36 Single Family + Condo/Townhouse Median Price - Home Counties Jan ’05 – Aug ’15 2005 2006 2007 2008 2009 2010 2011 2012 2013 2014 2015 Jan $625,000 $695,000 $699,000 $660,000 $380,000 $450,000 $435,500 $415,000 $540,000 $640,000 $683,000 Feb $651,000 $699,950 $705,000 $680,000 $381,000 $465,400 $420,000 $438,875 $555,000 $668,000 $823,188 Mar $669,000 $707,000 $740,000 $677,750 $369,000 $499,900 $460,000 $475,000 $615,000 $729,000 $840,000 Apr $685,000 $704,865 $775,000 $655,000 $404,000 $500,000 $480,000 $502,500 $676,250 $735,000 $825,000 May $685,000 $725,000 $775,000 $650,000 $415,000 $522,500 $477,750 $527,500 $688,945 $748,500 $850,000 Jun $708,000 $740,000 $768,500 $639,000 $460,000 $525,500 $515,000 $559,000 $670,000 $765,000 $837,375 Jul $700,000 $725,000 $759,975 $595,000 $487,750 $535,000 $484,500 $565,000 $692,000 $718,000 $835,000 Aug $710,000 $720,000 $761,000 $545,445 $476,000 $510,500 $490,000 $560,000 $670,000 $738,000 $825,000 Sep $695,000 $715,000 $750,000 $490,000 $469,825 $500,000 $465,000 $560,000 $670,000 $730,000 Oct $699,000 $711,500 $758,000 $477,200 $487,944 $500,000 $455,000 $567,000 $668,150 $750,000 Nov $700,000 $709,000 $750,000 $435,000 $500,000 $492,000 $437,500 $565,000 $659,250 $745,000 Dec $690,500 $695,000 $702,900 $410,000 $480,000 $463,750 $440,000 $563,000 $655,000 $801,000 Aug '05 $710,000 Aug '06 $720,000 Aug '07 $761,000 Aug '08 $545,445 Aug '09 $476,000 Aug '10 $510,500 Aug '11 $490,000 Aug '12 $560,000 Aug '13 $670,000 Aug '14 $738,000 Aug '15 $825,000 47.3% 23.1% 8.4% 51.3% 73.3% 61.6% 68.4% 11.8% Home Counties Median Price Variance to prior Years 16.2% 14.6% Home Counties - Single Family + Condo/Townhouse Median Price $0 $200,000 $400,000 $600,000 $800,000 $1,000,000 Aug '05 Aug '06 Aug '07 Aug '08 Aug '09 Aug '10 Aug '11 Aug '12 Aug '13 Aug '14 Aug '15 $761,000 $825,000
  • 37. MLSListings Inc Confidential Copyright 2015 37 37 Single Family Average Price – San Mateo, Santa Clara Counties Jan ’04 – Aug ’15
  • 38. MLSListings Inc Confidential Copyright 2015 38 38 Single Family Average Price – Monterey, San Benito, Santa Cruz Counties Jan ’04 – Aug ’15
  • 39. MLSListings Inc Confidential Copyright 2015 39 39 Single Family Average Price - Home Counties Aug (2004 – 2015)
  • 40. MLSListings Inc Confidential Copyright 2015 40 40 Single Family Average Price - Home Counties Aug (2004 – 2015) Monterey County San Benito County San Mateo County Santa Clara County Santa Cruz County Aug '04 $660,997 5.2% $559,950 -11.4% $992,740 62.1% $742,469 68.3% $740,612 8.1% Aug '05 $869,620 -20.0% $686,325 -27.7% $1,124,444 43.1% $924,431 35.2% $868,167 -7.7% Aug '06 $946,937 -26.6% $741,287 -33.1% $1,099,934 46.3% $944,004 32.4% $852,949 -6.1% Aug '07 $1,058,010 -34.3% $1,020,027 -51.4% $1,170,445 37.5% $1,084,707 15.2% $889,552 -10.0% Aug '08 $454,188 53.1% $338,708 46.5% $848,297 89.7% $985,614 26.8% $680,195 17.7% Aug '09 $391,965 77.4% $292,658 69.5% $848,571 89.6% $697,262 79.2% $525,020 52.6% Aug '10 $403,319 72.4% $301,694 64.5% $1,007,369 59.7% $809,914 54.3% $578,159 38.5% Aug '11 $441,707 57.4% $290,235 71.0% $943,934 70.5% $766,279 63.1% $557,810 43.6% Aug '12 $577,974 20.3% $374,195 32.6% $1,079,424 49.1% $859,553 45.4% $587,974 36.2% Aug '13 $613,770 13.3% $409,543 21.2% $1,219,088 32.0% $1,018,729 22.6% $670,420 19.5% Aug '14 $696,261 -0.1% $481,637 3.0% $1,329,916 21.0% $1,158,757 7.8% $735,951 8.8% Aug '15 $695,319 $496,192 $1,609,066 $1,249,450 $800,928 Home Counties - Single Family Average Price (2015 vs. Prior Years)
  • 41. MLSListings Inc Confidential Copyright 2015 41 41 Condo/Townhouse Market Outlook – Home Counties Aug ’14 vs. Aug ’15
  • 42. MLSListings Inc Confidential Copyright 2015 42 42 Condo/Townhouse Total Sales Dollars – San Mateo and Santa Clara Counties Jan ’04 – Aug ’15
  • 43. MLSListings Inc Confidential Copyright 2015 43 43 Condo/Townhouse Total Sales Dollars – San Mateo, Santa Clara Counties Aug ’04 – Aug ’15
  • 44. MLSListings Inc Confidential Copyright 2015 44 44 Condo/Townhouse Total Sales Dollars – Monterey, San Benito, Santa Cruz Counties Jan ’04 – Aug ‘15
  • 45. MLSListings Inc Confidential Copyright 2015 45 45 Condo/Townhouse Total Sales Dollars – Monterey, San Benito, Santa Cruz Counties Aug (2004 – 2015)
  • 46. MLSListings Inc Confidential Copyright 2015 46 46 Condo/Townhouse Total Sales Dollars – Home Counties Aug (2004 – 2015) Monterey County San Benito County San Mateo County Santa Clara County Santa Cruz County Aug '04 $216,807,098 -31.7% $41,996,243 -62.2% $555,934,304 12.6% $1,148,599,581 7.4% $190,337,321 -26.4% Aug '05 $277,408,894 -46.6% $53,533,365 -70.3% $665,670,583 -6.0% $1,297,901,625 -5.0% $197,942,019 -29.2% Aug '06 $191,281,300 -22.6% $28,910,199 -45.1% $510,369,288 22.6% $1,019,524,309 21.0% $157,795,655 -11.2% Aug '07 $134,367,225 10.2% $21,420,575 -25.9% $434,235,019 44.1% $853,664,556 44.5% $121,868,583 15.0% Aug '08 $141,173,604 4.9% $20,999,900 -24.4% $370,591,052 68.9% $757,529,743 62.8% $104,069,935 34.7% Aug '09 $119,093,055 24.4% $12,584,300 26.2% $308,879,963 102.6% $682,020,325 80.8% $84,003,213 66.9% Aug '10 $103,284,475 43.4% $8,145,739 94.9% $395,896,062 58.1% $699,765,751 76.2% $86,723,995 61.6% Aug '11 $122,644,762 20.8% $11,899,647 33.4% $404,948,109 54.6% $758,617,125 62.6% $91,480,895 53.2% Aug '12 $115,804,973 27.9% $17,213,007 -7.8% $452,279,035 38.4% $878,463,947 40.4% $115,242,907 21.6% Aug '13 $144,686,100 2.4% $18,019,899 -11.9% $504,702,571 24.0% $1,004,467,681 22.8% $128,050,306 9.5% Aug '14 $165,826,383 -10.7% $17,820,600 -10.9% $539,946,100 15.9% $991,896,414 24.3% $133,207,244 5.2% Aug '15 $148,102,949 $15,878,145 $625,926,621 $1,233,207,623 $140,162,462 Home Counties - Single Family Total Sales Dollars (2015 vs. Prior Years)
  • 47. MLSListings Inc Confidential Copyright 2014 47 47 Condo/Townhouse Months of Inventory – San Mateo, Santa Clara, Santa Cruz Mar ’03 – Aug ’15 (Rolling Three Month Average)
  • 48. MLSListings Inc Confidential Copyright 2015 48 48 Condo/Townhouse Months of Inventory – Monterey and San Benito Counties Mar ’03 – Aug ’15 (Rolling Three Month Average)