Process engineering economics i industrial engineering management
•
1 gefällt mir•218 views

Process Engineering Economics

Empfohlen
Empfohlen
Weitere ähnliche Inhalte
Was ist angesagt?
Was ist angesagt? (18)
Ähnlich wie Process engineering economics i industrial engineering management
Ähnlich wie Process engineering economics i industrial engineering management (20)
Mehr von Luis Cabrera
Mehr von Luis Cabrera (20)
Kürzlich hochgeladen
Kürzlich hochgeladen (20)
Process engineering economics i industrial engineering management
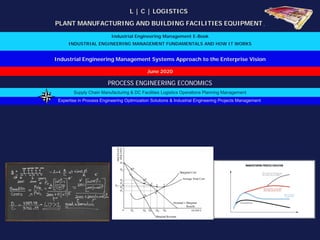
- 1. Industrial Engineering Management Systems Approach to the Enterprise Vision L | C | LOGISTICS PLANT MANUFACTURING AND BUILDING FACILITIES EQUIPMENT Industrial Engineering Management E-Book INDUSTRIAL ENGINEERING MANAGEMENT FUNDAMENTALS AND HOW IT WORKS June 2020 Expertise in Process Engineering Optimization Solutions & Industrial Engineering Projects Management Supply Chain Manufacturing & DC Facilities Logistics Operations Planning Management PROCESS ENGINEERING ECONOMICS
- 2. Process Engineering Economics Introduction: Process Engineering Economics considers a wide range of alternatives for profitable investing and for projecting outcomes in various engineering fields. It also explains how to monitor costs, finances, and economic limitations at every stage of engineering projects design, preparation, and evaluation It is also, the study of how businesses in different industries operate and compete against each other and why they succeed or fail One of the key issues in engineering economics is assessing whether a company is competitive. Competitive companies are normally good for consumers (although they might not always be feasible) Engineering Economics uses theoretical models to guide engineering decision making, and so engineers should expect to use diagrams and maybe some basic mathematical algebra and calculus models, including linear programming and zero game theory. In addition, engineers often develop empirical statistical and probability models to identify relationships between variables of interest: for example to understand the relationship between production cost, logistics cost, product price, advertising, profit We will focus on the balanced scorecard, which is a strategic management performance metric used to identify and improve various internal production and logistics operations; analyze their resulting external outcomes. Balanced scorecards are used to measure and provide feedback to management. Data collection is crucial to providing quantitative results as engineers gather and interpret the information and use it to make better decisions for management We will review some aspects of financial statements, budgets, estimation of capital requirements, estimation of operating expenses, time value of money, depreciation, cash flow concept, estimate of profitability, the economic balance; using some examples, and concluding comments
- 3. Process Engineering Economics The scorecard is a management system that aligns your company’s strategy with your tactical activities. Developed uniquely for your company, this system enables you to maintain focus. The scorecard includes your objectives, measures KPIs, the initiatives to reach those KPIs. The scorecard elements align with your company’s mission, vision, and values, and you develop each of these elements in different perspectives: financial, customer, internal business processes, learning and growth. These perspectives, taken together, give your scorecard the “balanced” approach. Financial Perspective: This indicates whether your strategy improves your company’s bottom line and how that strategy is implemented and executed. Customer Perspective: This is all about the value proposition that you give to your customers. From this, you can target the market segment that you want to address and maximize your strategies. Internal Business Processes Perspective: This ensures the stability and sound operation of your business. In this way, you can guarantee that your products and services meet your customer’s expectations. Learning and Growth Perspective: This consists of training and improvement for your workforce. It ensures that your employees have the skills and development to keep pace and exceed the competition. Part of the benefit of having a scorecard is that you will design it yourself. You and your team design and implement; so that it meets your unique business needs. Essentially, you are flushing out your business goals to determine the best and most realistic course to achieve them. You may then cascade those goals down through the structure of your business to maintain alignment. When using this management system, you should also perform a strategic mapping of your objectives. A strategy map gives your objectives cause-and-effect directionality.
- 4. Process Engineering Economics 3rd Party Logistics Business Objective FY 2020: 1. Retaining the Existing Contracts 2. Obtaining at least one warehouse project 3. New Business Growth + 20% Mr. TC Country Head (Thaialand) Learnings of F 19 & Business implications Financial performance (Local currency in MTB) Learnings of F19 Business Implication Parameter FY'16 FY'17 FY'18 **FY'19 P FY'20 P FY 21P Business size small with few contracts No significant Growth Thai COVID19 leading to factories closure PBT Loss ,Recovery expected in Q4 Revenue 137 88 110 80 138 193 OEMs having nominated Service Providers Entry barrier for OEM business % Growth 453% -57% 20% -37% 42% 29% Global OEMs having long BD cycle-New plants NB revenue Drop EBITDA 2.73 2.39 3.65 0.88 2.01 10.16 Rate renegotiation with Transporters Margin Improvement % Growth 1.99% 2.72% 3.32% 1.11% 1.46% 5.26% Services levels maintained with CS above 90% Business Rention with renewals PBT 2.39 2.06 3.35 0.29 1.31 8.82 Participation in Fairs ,Networking Brand visibility and more RFQ % Growth 1.74% 2.35% 3.06% 0.36% 0.95% 4.57% Need for matching competitors capability incl.ITTo retain wallet share with MSA Net Cash in Flow 4.6 -3.6 8.6 -1 -1 3 Assessment of opprtunity,capability and resources for implementing MESCO Tooling supply chain Revenue growth through' other verticals Critical Success Factors Critical Success factor Initiatives Holder Measure Services Rendered - Customer wise 1. Financial Excellence To acquire /form JV with local logistics company having capabilities/infrastructiure TC ธ.ค.-19 Customer name Material mgmt Warehouse mgmt Transport mgmt Freight mgmt Asset Based BOI approval for entry into new verticals Gokul ส.ค.-19 Mex Summit A Y 2. Operational Excellence Adherence of KPI Pomual No complaint Aapico Y To ensure CS above 90% Pomual 90% Aztec Kubota Y Tata Motors Thailand Y Y 3. Customer Excellence To scale up with new business development. Luis 30 MTB Mex Chanathon Y International casting Y Customer development with TMTL MSR Kumar 6 MTB Unity Y 4. IT Excellence To provide supply chain visibility and reports to MSA Pomual ก.ย.-19 Mahle Aztec Y Competition and other threats Threat Counter action 5. Talent Excellence To recruit BD Head and OPS Head TC พ.ค.-19 Wallet share reduction in Mex Summit due to CUEVITA Service level enhancement To train team on business verticals TC มิ.ย.-19 Local transporters competing with lower prices Value additions to customers To train the team on HR policies Madhu มิ.ย.-19 Critical business opportunity Opportunity Target Value Business from Volkswagen - inbound operations ก.ย.-20 RFQ from CAT - inbound operations ก.พ.-20 Key Business Metrics Business metric Value Turnover 138 MTB Business from Volkswagen ก.ย.-20 JV with GOLF ธ.ค.-20 Support required from management MESCO model implementation มี.ค.-20 Support required From Entry into large scale Warehousing ธ.ค.-20 Board approval for acquisition/JV Management Board
- 5. Process Engineering Economics What is EBITDA? EBITDA stands for Earnings Before Interest, Taxes, Depreciation, and Amortization and is a metric used to evaluate a company’s operating performance The EBITDA metric is a variation of operating income (EBIT) because it excludes non-operating expenses and certain non-cash expenses. The purpose of these deductions is to remove the factors that business owners have discretion over, such as debt financing, capital structure, methods of depreciation, and taxes (to some extent). It can be used to showcase a firm’s financial performance without accounting for its capital structure. EBITDA focuses on the operating decisions of a business because it looks at the business’ profitability from its core operations before the impact of capital structure, leverage and non-cash items like depreciation are taken into account EBITDA Formula EBITDA = Net Income + Interest + Taxes + Depreciation + Amortization OR EBITDA = Operating Profit + Depreciation + Amortization The EBITDA metric is commonly used as a proxy for cash flow. It can give an analyst a quick estimate of the value of the company In addition, when a company is not making a profit, investors can turn to EBITDA to evaluate a company. Many private equity firms use this metric because it is very good for comparing similar companies in the same industry. Business owners use it to compare their performance against their competitors.
- 6. Process Engineering Economics Interest is excluded from EBITDA, as it depends on the financing structure of a company. It comes from the money it has borrowed to fund its business activities. Different companies have different capital structures, resulting in different interest expenses. Hence, it is easier to compare the relative performance of companies by adding back interest and ignoring the impact of capital structure on the business. Note that interest payments are tax deductible, meaning corporations can take advantage of this benefit in what is called a corporate tax shield Taxes vary and depend on the region where the business is in operating in. Taxes are an expense of a business that must be paid to the government in the jurisdiction of the company. They are a function of tax rules, which are not really part of assessing a management team’s performance, and thus many financial analysts prefer to add them back when comparing businesses. Depreciation and amortization (D&A) depend on the historical investments the company has made and not on the current operating performance of the business. Companies invest in long-term fixed assets (such as buildings or vehicles) that lose value due to wear and tear. The depreciation expense is based on a portion of the company’s tangible fixed assets deteriorating. Amortization expense is incurred if the asset is intangible. Intangible assets such as patents are amortized because they have a limited useful life (competitive protection) before expiration. D&A is heavily influenced by assumptions regarding useful economic life, salvage value, and the depreciation method used. Because of this, analysts may find that operating income is different than what they think the number should be, and therefore D&A is backed out of the EBITDA calculation. The D&A expense can be located in the firm’s cash flow statement under the cash from operating activities section. Since depreciation and amortization is a non-cash expense, it is added back (the expense is usually a positive number for this reason) while on the cash flow statement.
- 7. Process Engineering Economics <Pos name> Status Update Sheet for the month of _____________ <Position head> Financial Update Business metric update Parameter Year Month YTD Metric Target Actual FY'19 Plan FY'20 LoS FY'20 Bud Apr'20 Act Apr'20 Act Apr'19 GOLY Bud YTD Act YTD FY'19 YTD GOLY Revenue EBITDA PBT Free cash flow Initiative Update Strategic Objective Initiatives Holder Apr May Jun Jul Aug Sep Oct Nov Dec Jan Feb Mar Target Date Financial Excellence To acquire /form JV with local logistics company having capabilities/infrastructiure TC Dec20 BOI approval for entry into new verticals Gokul Aug20 Operation Excellence Adherence of KPI Pomual No complaint To ensure CSI above 90% for pareto customers Pomual 90% Customer Excellence To scale up business with New business development Luis 30 MTB Customer development with TMTL MSR Kumar 6 MTB IT Excellence To provide supply chain visibility and reports to MSA Pomual Sep20 Talent Excellence To recruit BD Head and OPS Head TC May20 To train team on other verticals TC Jun20 To train team on HR policies and PMS Madhu Jun20 Other updates Critical Business opportunities Support from management External threat Business opportunity Status Support needed From Status Counter action Status
- 8. Process Engineering Economics S.No Strategic Objective Organisational Measurement Initiatives Lead indicator Lag indicator Impact to organization 1 Financial Excellence Growth in PBT To form a JV with GOLF LOI sign off Due diligence Milestones plan JV agreement sign off Annual profit of 20MTB Return on Equity Incremental Free Cash Flow 2 Customer Excellence Contract retention (% of Value)1 Revenue growth % % of annualised encirclement2 /new business obtained from pareto/targeted Customers TATA Motors CKD exports into Thailand and Indonesia Periodic customer viisits deal sign off Business contract sign off Growth with global customer in Far east 3 Operational Excellence Exceeding the agreed ISI / CSI / SLA norms To ensure CSI above 90% service level adherance CSI Customer Retention Create operational excellence capabilities in each business unit3 4 IT Excellence All the review data come from the system To provide supply chain visibility and reports to MSA Operations and IT interactive meetings and solutionning System generated Reports Increased revenue by 15 MTB with 0.5MTB profit Transfer of IT Knowledge/Cross implementation of technology practices across organizations New customer solutions through IT 5 Talent Excellence Talent Retention & Sucession planning - % of management with Succession plans Talent retention,Succession plan-% mgmt with Succession plan Attrition % Talent Acquisition - Availability of right people in the key positions To recruit BD Head and Ops Head and train on other verticals Meeting with Vertical experts Generating business enquiries Entry into warehousing operation and Tooling supply chain Consequence management
- 9. Process Engineering Economics <TC> Status Update Sheet for the month of _____________ Initiative Update Strategic Objective Organisational Measurement Initiatives Ap r Ma y Ju n Jul Au g Se p Oc t No v De c Ja n Fe b Ma r Target date Financial Excellence Growth in PBT 1 To form a JV with GOLF ธ.ค.-20 Return on Equity 2 Incremental Free Cash Flow 3 Customer Excellence Contract retention (% of Value) 4 Revenue growth % 5 % of annualised enc/NB obtained from pareto/targeted Customers 6 TATA Motors CKD exports into Thailand and Indonesia ธ.ค.-20 Operational Excellence Exceeding agreed ISI / CS / SLA 7 To ensure CS above 90% Monthly Create ops excellence capabilities in each Bus unit 8 Information Technology Excellence All the review data from system 9 To provide supply chain visibility and reports to MSA Sep20 Transfer of IT Knowledge/CI of technology practices across org 10 New customer solutions through' IT 11 Talent Excellence Talent retention,Succession plan- % mgmt with Succession plan 12 Attrition % 13 Talent Acq - Available of right ppl in key pos (% green in key pos) 14 To recruit BD Head and Ops Head and train on other verticals Jun 20 Consequence management 15
- 10. Process Engineering Economics Actual Revenue FY 2020 Projects เม.ย.-19 พ.ค.-19 มิ.ย.-19 ก.ค.-19 ส.ค.-19 ก.ย.-19 ต.ค.-19 พ.ย.-19 ธ.ค.-19 ม.ค.-20 ก.พ.-20 มี.ค.-20 Total AA 256,858 270,705 283,009 228,925 213,185 226,428 181,529 168,102 192,310 210,065 208,645 155,512 2,595,274 AF 667,904 878,057 950,679 950,311 1,347,396 1,387,390 1,650,694 1,401,352 1,481,152 1,222,801 1,334,941 1,418,429 14,691,107 AH - - - - - - - - - - - - - SKC 574,895 922,089 851,979 758,536 818,718 750,354 476,359 494,034 415,178 577,064 663,934 749,834 8,052,974 MSA - - - - - - - - - - - - - TCT - - - - - - - - - - - - - YMPT 187,518 187,518 187,518 187,518 187,518 187,518 187,518 187,518 187,518 187,518 145,754 131,885 2,152,817 TMTL / SFL 100,000 100,000 100,000 200,000 200,000 200,000 200,000 200,000 200,000 300,000 300,000 300,000 2,400,000 TMTL / Unity 302,720 302,720 302,720 302,720 302,720 302,720 302,720 302,720 302,720 302,720 302,720 302,720 3,632,640 2,089,894 2,661,089 2,675,905 2,628,010 3,069,537 3,054,410 2,998,820 2,753,726 2,778,877 2,800,168 2,955,994 3,058,380 33,524,811 Contract Renewals FY 2020 MSA 3,126,133 4,494,173 4,132,766 3,312,419 4,097,480 4,666,121 4,723,291 4,168,965 4,496,266 4,294,991 4,006,614 3,680,290 49,199,510 TCT 512,024 846,032 969,106 966,209 1,106,175 876,275 604,844 443,813 571,562 729,423 721,179 537,695 8,884,334 3,638,157 5,340,205 5,101,871 4,278,628 5,203,655 5,542,395 5,328,135 4,612,777 5,067,828 5,024,414 4,727,792 4,217,985 58,083,844 Encirclements FY 2020 AA - Interunit Transfer 800,000 800,000 800,000 800,000 800,000 800,000 800,000 800,000 800,000 - - - 7,200,000 SKC n - New Routes & SP WH Oper 450,000 450,000 450,000 450,000 450,000 450,000 2,700,000 SKC n - Inbound Milkrun Operation 350,000 350,000 350,000 350,000 350,000 350,000 2,100,000 800,000 800,000 800,000 800,000 800,000 800,000 1,600,000 1,600,000 1,600,000 800,000 800,000 800,000 12,000,000
- 11. Process Engineering Economics New Projects Started FY 2020 SKT 287,447 461,045 425,989 379,268 409,359 375,177 238,180 247,017 207,589 288,532 331,967 374,917 2,472,738 287,447 461,045 425,989 379,268 409,359 375,177 238,180 247,017 207,589 288,532 331,967 374,917 2,472,738 New Projects Pipeline FY 2020 ASP - - - 297,602 277,140 294,356 363,058 336,204 384,620 630,196 625,936 466,537 3,378,047 - - - 297,602 277,140 294,356 363,058 336,204 384,620 630,196 625,936 466,537 3,675,649 Business Development (Plan) - SKE 650,000 650,000 650,000 650,000 650,000 650,000 Volkswagen CAT New Project 1 800,000 800,000 800,000 800,000 800,000 800,000 800,000 800,000 800,000 New Project 2 800,000 800,000 800,000 800,000 800,000 800,000 New Project 3 1,200,000 1,200,000 1,200,000 1,200,000 1,200,000 1,200,000 New Project 3 1,200,000 1,200,000 1,200,000 - - - 800,000 800,000 800,000 3,450,000 3,450,000 3,450,000 4,650,000 4,650,000 4,650,000 26,700,000 Total Revenue / Month FY 2020 เม.ย.-19 พ.ค.-19 มิ.ย.-19 ก.ค.-19 ส.ค.-19 ก.ย.-19 ต.ค.-19 พ.ย.-19 ธ.ค.-19 ม.ค.-20 ก.พ.-20 มี.ค.-20 Existing Project 2,089,894 2,661,089 2,675,905 2,628,010 3,069,537 3,054,410 2,998,820 2,753,726 2,778,877 2,800,168 2,955,994 3,058,380 33,524,811 Contract Renuwals 3,638,157 5,340,205 5,101,871 4,278,628 5,203,655 5,542,395 5,328,135 4,612,777 5,067,828 5,024,414 4,727,792 4,217,985 58,083,844 Encirclement 800,000 800,000 800,000 800,000 800,000 800,000 1,600,000 1,600,000 1,600,000 800,000 800,000 800,000 12,000,000 New Projects Converted 287,447 461,045 425,989 379,268 409,359 375,177 238,180 247,017 207,589 288,532 331,967 374,917 4,026,487 New Project in Pipeline - - - 297,602 277,140 294,356 363,058 336,204 384,620 630,196 625,936 466,537 3,675,649 New Business Development (Plan) - - - 800,000 800,000 800,000 3,450,000 3,450,000 3,450,000 4,650,000 4,650,000 4,650,000 26,700,000 Toal 6,815,498 9,262,339 9,003,766 9,183,509 10,559,692 10,866,338 13,978,192 12,999,725 13,488,914 14,193,310 14,091,689 13,567,819 138,010,792
- 12. Process Engineering Economics Existing Average / Month (THB) (%) Required Average / Month (THB) (%) Revenue Growth for Brake Even (THB/Month) FY20 PLAN (%) Revenue 8,550,767 12,372,280 3,821,513 138,010,792 Direct Variable Expenses (C1) 7,361,461 86.10 % 10,528,810 85.10 % 117,447,184 85.10 % Direct Fixed Expenses (C2) 542,552 6.35% 785,640 6.35% 8,763,685 6.35% Corporate Expenses (C7) 381,745 4.50% 940,000 7.60% 10,488,820 7.60% PBT 265,008 3.10% 117,830 0.95% 1,311,103 0.95%
- 13. Process Engineering Economics The production cost calculation of production is the determination of costs in terms of money per unit of goods, works or services. The calculation includes direct and indirect costs. Direct is the cost of materials, wages of workers, etc. Indirect costs: planned profit, transportation, the purchase price, issued by the supplier; transportation expenses for the delivery of goods to the warehouse; duty and customs fees, if we import goods from abroad. We calculate the production cost price - the planned production cost, the costs that the company will incur for the delivery of products. Each company calculates the planned production cost in its own way. Enterprises bear different costs depending on the type of activity; calculation contain a decoding of the costs of materials and wages. The calculation of the planned production cost price begins with the determination of the production cost of raw materials and materials used for the production of goods (which are directly involved in the technological process). The expenses of raw materials is included in the expenses of the standards approved by the enterprise minus technological losses Direct costs is the wages of production workers. The basic salary and additional are taken into account. The principles of the salary is charged (piece-work, time-based, from output),
- 14. Process Engineering Economics Year 1 2 3 4 5 6 7 8 9 10 price t7.5 ton ruck 1,685,000 price box 240,000 Total 1,925,000 1,925,000 1,540,000 1,155,000 770,000 385,000 308,000 231,000 154,000 77,000 - dpreciation 20%/1-5 385,000 385,000 385,000 385,000 385,000 385,000 depreciation 20% 6-10 77,000 77,000 77,000 77,000 77,000 77,000 maintenance 6% 101,100 101,100 101,100 101,100 101,100 101,100 maintenance 9% 151,650 151,650 151,650 maintenance 12% 202,200 202,200 202,200 202,200 truck & cargo insurance 14,400 14,400 14,400 14,400 14,400 14,400 14,400 14,400 14,400 14,400 14,400 finance cost per year 115,500 115,500 115,500 115,500 115,500 115,500 23,100 23,100 23,100 23,100 23,100 Finance 6% Total Truck cost/year 616,000 616,000 616,000 616,000 616,000 266,150 266,150 316,700 316,700 316,700 12,320 12,320 12,320 12,320 12,320 5,323 5,323 6,334 6,334 6,334 2,053 2,053 2,053 2,053 2,053 887 887 1,056 1,056 1,056 Cash Flow/year 385,000 385,000 385,000 385,000 385,000 77,000 77,000 77,000 77,000 77,000 7,700 7,700 7,700 7,700 7,700 1,540 1,540 1,540 1,540 1,540 1,283 1,283 1,283 1,283 1,283 257 257 257 257 257 km/lit 1-5 6.5 1 1 1 1 1 km/lit 6-7 5.5 1.18 1.18 km/lt 8-10 5 1.3 1.3 1.3 Diesel 31.03 31.63 24.33 24.33 24.33 24.33 24.33 26.76 26.76 31.63 31.63 31.63 Km/year target 100,000 100,000 200,000 300,000 400,000 500,000 600,000 700,000 800,000 900,000 1,000,000 km/week (50 wk/year) 50 2,000 2,000 2,000 2,000 2,000 2,000 2,000 2,000 2,000 2,000 km/day (6 days/week) 6 333.33 333 333 333 333 333 333 333 333 333 fuel lits/day 51.28 51.28 51.28 51.28 51.28 60.61 60.61 66.67 66.67 66.67 fuel bath/day 1,622 1,622 1,622 1,622 1,622 1,917 1,917 2,109 2,109 2,109 total cost/day 3,675 3,675 3,675 3,675 3,675 2,804 2,804 3,164 3,164 3,164 Other rmothly Expenses Driver wages/mth 14,000 Driver travel expenses 720 Driver communication 1,000 Administration cost 14,000 GPS cost 16,000 total other expenses 45,720 grand total/day 1,524 5,199 5,199 5,199 5,199 5,199 4,328 4,328 4,688 4,688 4,688 gross profit 16% 16% 6,031 6,031 6,031 6,031 6,031 5,021 5,021 5,438 5,438 5,438 load max capacity kg 7,000 0.53 0.53 0.53 0.53 0.53 0.40 0.40 0.45 0.45 0.45 load max capacity m3 34.848 105.47 105.47 105.47 105.47 105.47 80.47 80.47 90.80 90.80 90.80 load max 600ml bottles 11,667 0.32 0.32 0.32 0.32 0.32 0.24 0.24 0.27 0.27 0.27 load max 1500ml bottles 4,667 0.79 0.79 0.79 0.79 0.79 0.60 0.60 0.68 0.68 0.68
- 15. Process Engineering Economics Fixed Change (Increase or decrease) Rates Parameter P/Up 5.5 Mtr Box 7.2 Mtr Box 0 ~ 50 Kms (Min Chg) 40.00 55.00 65.00 0 ~ 50 Kms 0.50 0.91 1.00 51 ~ 80 Kms 0.50 0.91 1.00 81 ~ 200 Kms 0.50 0.91 1.00 200 Kms & Above 0.50 0.91 1.00 Proposal A (-) 1 Level 14.00~18.99 AFP- 16.50 Proposal B (Base STD) (-) 0 Level 19.00~23.99 AFP- 21.50 Parameter P/Up 5.5 Mtr Box 7.2 Mtr Box Parameter P/Up 5.5 Mtr Box 7.2 Mtr Box 0 ~ 50 Kms (Min Chg) 410.00 485.00 575.00 0 ~ 50 Kms (Min Chg) 450.00 540.00 640.00 0 ~ 50 Kms 9.45 16.64 18.89 0 ~ 50 Kms 9.95 17.55 19.89 51 ~ 80 Kms 8.87 14.89 16.55 51 ~ 80 Kms 9.37 15.80 17.55 81 ~ 200 Kms 7.78 13.49 15.09 81 ~ 200 Kms 8.28 14.40 16.09 200 Kms & Above 6.88 11.74 12.23 201 Kms & Above 7.38 12.65 13.23 Proposal C (+) 1 Level 24.00~28.99 AFP- 26.50 Proposal D (+) 2 Level 29.00~33.99 AFP- 31.50 Parameter P/Up 5.5 Mtr Box 7.2 Mtr Box Parameter P/Up 5.5 Mtr Box 7.2 Mtr Box 0 ~ 50 Kms (Min Chg) 490.00 595.00 705.00 0 ~ 50 Kms (Min Chg) 530.00 650.00 770.00 0 ~ 50 Kms 10.45 18.46 20.89 0 ~ 50 Kms 10.95 19.37 21.89 51 ~ 80 Kms 9.87 16.71 18.55 51 ~ 80 Kms 10.37 17.62 19.55 81 ~ 200 Kms 8.78 15.31 17.09 81 ~ 200 Kms 9.28 16.22 18.09 201 Kms & Above 7.88 13.56 14.23 201 Kms & Above 8.38 14.47 15.23 Proposal E (+) 3 Level 34.00~38.99 AFP- 36.50 Proposal F (+) 4 Level 39.00~43.99 AFP- 41.50 Parameter P/Up 5.5 Mtr Box 7.2 Mtr Box Parameter P/Up 5.5 Mtr Box 7.2 Mtr Box 0 ~ 50 Kms (Min Chg) 570.00 705.00 835.00 0 ~ 50 Kms (Min Chg) 610.00 760.00 900.00 0 ~ 50 Kms 11.45 20.28 22.89 0 ~ 50 Kms 11.95 21.19 23.89 51 ~ 80 Kms 10.87 18.53 20.55 51 ~ 80 Kms 11.37 19.44 21.55 81 ~ 200 Kms 9.78 17.13 19.09 81 ~ 200 Kms 10.28 18.04 20.09 201 Kms & Above 8.88 15.38 16.23 201 Kms & Above 9.38 16.29 17.23 Particular Pick Up 6 W 5.5/7.2 Mt. 1. Waiting Time In MSA Place >90 Min (Hourly Charge) 100 250 2. Waiting Time In Customer Place > 120 Min (Hourly Charge) 100 250 3. Charge per drop (Distance < 5 KM) 180 300 4. Charge Manpower Loader per Trip 200 350 5. Charge Return empty package - - 6. Charge Return with part x 1.3 x 1.3 Cost Calculation-Proposal Validity Period: 23-Mar-2020 to 31-Mar-2021
- 16. Process Engineering Economics Validity 23-Mar-2020 to 31-Mar- 2025 Average Fuel Price (AFP) 31.50 Fuel Price Range (FPR) 29.00 ~ 33.99 A TRANSPORTATION COST (ZONE A) - MSA Rate / KM 5.5 M Box Truck Rate / KM 7.2 M Box Truck Per Trip Per Drop Per Part Per Trip Per Drop Per Part ลําดับที่ โซน ลูกค้า เขตย่อย เขตหลัก KM Charge Charge Charge Charge Charge Charge 2.01 A LAKESIDE VILLAGE BANGNA TRAD KM 8 บางนา- ตราด Bangna-Trad 10 MIN 650.00 950.00 845.00 MIN 770.00 1,070.00 1,001.00 2.02 A SAB กม.12 บางนา- ตราด Bangna-Trad 12 MIN 650.00 950.00 845.00 MIN 770.00 1,070.00 1,001.00 2.03 A AAP กม.17 บางนา- ตราด Bangna-Trad 13 MIN 650.00 950.00 845.00 MIN 770.00 1,070.00 1,001.00 2.04 A DANZAS กม.18 บางนา- ตราด Bangna-Trad 13 MIN 650.00 950.00 845.00 MIN 770.00 1,070.00 1,001.00 2.05 A นิวสมไทย กม.13 NEWSOMTHAI บางนา- ตราด Bangna-Trad 14 MIN 650.00 950.00 845.00 MIN 770.00 1,070.00 1,001.00 2.06 A Baan Avare torn (บ้านเอื้ออาทร) บางโฉลง Bangchalong 16 MIN 650.00 950.00 845.00 MIN 770.00 1,070.00 1,001.00 2.07 A Nisuki - Km4 (นิซูกิ) เคหะบางพลี บางนา- ตราด Bangna-Trad 16 MIN 650.00 950.00 845.00 MIN 770.00 1,070.00 1,001.00 2.08 A COSMO บางนาตราด บางนา- ตราด Bangna-Trad 17 MIN 650.00 950.00 845.00 MIN 770.00 1,070.00 1,001.00 2.09 A AMAIR กม.19 Bangna-trad km.19 20 MIN 650.00 950.00 845.00 MIN 770.00 1,070.00 1,001.00 2.10 A เดโชโมลด์ ซ.วัดศรีวารีน้อย DESHOMOLD บางนา- ตราด Bangna-Trad 20 MIN 650.00 950.00 845.00 MIN 770.00 1,070.00 1,001.00 2.11 A QCC ซอยกิ่งแก้ว กิ่งแก้ว Kingkaew 20 MIN 650.00 950.00 845.00 MIN 770.00 1,070.00 1,001.00 2.12 A YNP ซอยกิ่งแก้ว กิ่งแก้ว Kingkaew 20 MIN 650.00 950.00 845.00 MIN 770.00 1,070.00 1,001.00 2.13 A MSC-Km19 บางนา- ตราด Bangna-Trad 21 MIN 650.00 950.00 845.00 MIN 770.00 1,070.00 1,001.00 2.14 A BENZ-Km19 บางนา- ตราด Bangna-Trad 21 MIN 650.00 950.00 845.00 MIN 770.00 1,070.00 1,001.00 2.15 A ไปรษณีย์ กม.13 บางนา- ตราด Bangna-Trad 21 MIN 650.00 950.00 845.00 MIN 770.00 1,070.00 1,001.00 2.16 A โรงชุบ VPP กม.13 บางนา- ตราด Bangna-Trad 21 MIN 650.00 950.00 845.00 MIN 770.00 1,070.00 1,001.00 2.17 A FORD ซอยเซลล์ล็อค บางนา- ตราด Bangna-Trad 21 MIN 650.00 950.00 845.00 MIN 770.00 1,070.00 1,001.00 2.18 A DIHATSUKE กิ่งแก้ว 22 MIN 650.00 950.00 845.00 MIN 770.00 1,070.00 1,001.00 2.19 A THAI CHANATON กม.22 บางนา- ตราด Bangna-Trad 22 MIN 650.00 950.00 845.00 MIN 770.00 1,070.00 1,001.00 2.20 A THAI HONDA บางนา-ตราด กม 20 23 MIN 650.00 950.00 845.00 MIN 770.00 1,070.00 1,001.00 2.21 A K- LINE กม.18 บางนา- ตราด Bangna-Trad 24 MIN 650.00 950.00 845.00 MIN 770.00 1,070.00 1,001.00
- 17. Process Engineering Economics What Is a Profit and Loss Statement (P&L) The profit and loss (P&L) statement is a financial statement that summarizes the revenues, costs, and expenses incurred during a specified period, usually a fiscal quarter or year The P&L statement is synonymous with the income statement. These records provide information about a company's ability or inability to generate profit by increasing revenue, reducing costs, or both Some refer to the P&L statement as a statement of profit and loss, income statement, statement of operations, statement of financial results or income, earnings statement or expense statement P&L management refers to how a company handles its P&L statement through revenue and cost management A balance sheet is a statement of the financial position of a business that lists the assets, liabilities, and owner's equity at a particular point in time. The balance sheet illustrates your business's net worth The balance sheet may also have details from previous years so you can do a back-to-back comparison of two consecutive years. This data will help you track your performance and will identify ways to build up your finances and see where you need to improve The income statement, which shows net income for a specific period of time, such as a month, quarter, or year. Net income equals revenue minus expenses for the period The cash flow statement, which shows the movements of cash and cash equivalents in and out of the business. Chronic negative cash flows are symptomatic of troubled businesses
- 23. Process Engineering Economics Calculating the Present Value The PV, or Present Value, of an investment, is the total amount that a series of future payments is worth presently. The syntax of the PV function is as follows: =PV(rate, nper, pmt,[fv],[type]) The fv and type arguments are optional arguments in the function (indicated by the square brackets). The fv argument is the future value or cash balance that you want to have after making your last payment. If you omit the fv argument, Excel assumes a future value of zero (0) The type argument indicates whether the payment is made at the beginning or end of the period: Enter 0 (or omit the type argument) when the payment is made at the end of the period, and use 1 when it is made at the beginning of the period Calculating the Net Present Value The NPV function calculates the net present value based on a series of cash flows. The syntax of this function is =NPV(rate,value1,[value2],[...])where value1, value2, and so on are between 1 and 13 Value arguments representing a series of payments (negative values) and income (positive values), each of which is equally spaced in time and occurs at the end of the period The NPV investment begins one period before the period of the value1 cash flow and ends with the last cash flow in the argument list. If your first cash flow occurs at the beginning of the period, you must add it to the result of the NPV function rather than include it as one of the arguments
- 24. Process Engineering Economics Calculating the Future Value The FV function calculates the future value of an investment. The syntax of this function is =FV(rate, nper,pmt,[pv],[type]) The rate, nper, pmt, and type arguments are the same as those used by the PV function The pv argument is the present value or lump-sum amount for which you want to calculate the future value. As with the fv and type arguments in the PV function, both the pv and type arguments are optional in the FV function Break-Even Analysis: Break-even analysis seeks to investigate the interrelationships among a firm’s sales revenue or total turnover, cost, and profits as they relate to alternate levels of output A profit-maximizing firm’s initial objective is to cover all costs, and thus to reach the break-even point, and make net profit thereafter The break-even point refers to the level of output at which total revenue equals total cost what happens to profits (or losses) at various rates of output Therefore, the primary objective of using break-even charts as an analytical device is to study the effects of changes in output and sales on total revenue, total cost, and ultimately on total profit Break-even analysis is a very generalized approach for dealing with a wide variety of questions associated with profit planning and forecasting
- 25. Process Engineering Economics The horizontal axis measures the rate of output, and revenues and costs, measured in rupees, are shown on the vertical axis. Figure 21.1 combines an inverted U-shaped total revenue (TR) curve and the familiar S-shaped short run total cost curve (TC) The curvilinear shape of the total revenue curve follows from the assumption that the firm faces a downward-sloping demand curve and must reduce its price to be able to sell more The law of diminishing returns accounts for the curvilinear shape of the total cost curve The vertical distance between TR and TC measures the profit or loss associated with any specific level of output. To the left of Qa and to the right of Qb total costs exceed total revenues, and there are losses So there are two break-even points. Between these two points, profits are positive because TR exceeds TC. The point at which profits are maximized (that is, the point at which the vertical distance between TR and TC is the largest) is shown as Q
- 26. Process Engineering Economics When managing a project, Engineers are required to make a lot of key decisions There is always something that needs executing, and often that something is critical to the success of the venture. Because of the high stakes, good engineers don’t just make decisions based on gut instinct. They prefer to minimize risk to the best of their ability and act only when there is more certainty than uncertainty But how can you accomplish that in a world with myriad variables and constantly shifting economics? The answer: consult hard data collected with reporting tools, charts and spreadsheets. You can then use that data to evaluate your decisions with a process called cost benefit analysis (CBA) An intelligent use of cost benefit analysis will help you minimize risks and maximize gains both for your project and your organization.
- 27. Process Engineering Economics Fundamentally, Engineering Economics involves formulating, estimating, and evaluating the economic outcomes when alternatives to accomplish a defined purpose are available Engineering economics is the application of economic principles and calculations to engineering projects it is important to all fields of engineering because no matter how technically sound an engineering project is, it will fail if it is not economically feasible Energy Cost Saving Projects: The term energy cost savings means “a reduction in the cost of energy and related operation and maintenance expenses, from a base cost established through a methodology set forth in an energy saving performance Plant Manufacturing Energy Cost Saving are related to the efficient use of: Natural Gas, Electricity, Water, Oil Fuel, Bio mass Fuel, and other means of clean energy It is important to understand the Energy consumption, and to establish the source of energy waste before any calculation and analysis is made, concluding in energy saving investment projects. See the following examples on Energy Consumption Cost Savings 140,000 145,000 150,000 155,000 160,000 165,000 1-ก .ย. 8-ก .ย. 15- ก. ย. 22- ก. ย. 29- ก. ย. 6-ต . ค. 13- ต .ค . 20- ต .ค . 27- ต .ค . 3-พ. ย. 10- พ.ย. 17- พ.ย. 24- พ.ย. 1-ธ .ค . 8-ธ .ค . 15- ธ. ค. 22- ธ. ค. 29- ธ. ค. 115KV MAIN ELECTRICITY METER UCL LCL Xbar
- 29. Process Engineering Economics Electric Energy consumption is mainly used by: electric motors, compressed air systems, AHU systems, Cold rooms, buildings lighting, water pump systems electric ovens, electronic instruments, computer systems, and others Natural Gas Energy consumption is mainly used by: NG burners – ovens, steam boilers Water is consumption is mainly used as: Raw water, soft water, R/O water, re-cycled water, waste water processing Examples of Energy waste are found in: Compressed Air piping systems leakages, leading to continuous air compressors work and electricity waste Ovens Burners unbalanced Air-Gas ratio, and ovens heat leakages leading to continuous NG waste Steam Boilers efficiency and uncompleted equipment installation such as economiser, steam returns, steam piping design mistakes, damaged steam pipe insulation, steam actuator valves malfunctioning Water usage waste comes from processing soft water, R/O water, re-cycling water, waste water, equipment washing machines water usage, piping aging failures Once you understand the root cause of the Plant Energy waste; a cost analysis follows to estimate potential energy cost saving required investments, and cost benefits conclusions prior to making an investment decision, and engaging any equipment contractors
- 30. Process Engineering Economics Plant 1 2015 2016 2017 2018 2019 2020 January 1,584,502 1,173,434 1,851,207 1,535,772 1,689,748 2,473,714 February 1,383,031 1,268,758 1,749,744 1,575,928 1,679,466 2,311,073 March 1,700,982 1,841,194 2,033,637 1,783,275 2,153,925 2,702,010 April 1,462,977 1,823,260 1,918,790 1,635,801 2,193,097 2,504,667 May 1,544,436 1,621,002 1,874,619 1,819,953 2,357,211 June 1,574,544 1,627,904 1,896,683 2,079,005 2,386,242 July 1,453,443 1,906,307 1,353,242 1,914,124 2,329,013 August 1,630,153 1,725,914 1,650,914 1,947,478 2,473,756 September 1,689,154 1,360,173 1,302,461 1,902,891 2,342,349 October 1,718,004 1,813,577 1,459,299 2,103,848 2,439,218 November 1,835,952 1,756,616 1,307,245 1,897,287 2,403,492 December 1,605,919 1,868,358 1,592,638 1,702,497 2,432,658 Total BHT 19,183,097 19,786,497 19,990,479 21,897,859 26,880,175 9,991,464 103% 101% 110% 123% 129% Plant 2 2015 2016 2017 2018 2019 2020 January 3,117,774 3,996,372 3,910,245 February 3,322,417 3,446,784 2,918,717 March 3,561,146 3,780,029 4,481,138 April 3,405,219 3,462,174 4,045,921 May 3,844,521 4,025,210 June 3,768,321 4,046,746 July 3,787,748 399,338 August 4,093,875 4,116,481 September 4,043,660 4,128,146 October 3,916,376 4,590,396 November 4,219,210 441,969 December 3,627,409 4,303,542 Total BHT 44,707,676 40,737,187 15,356,021 91% 105% Plant 3 2015 2016 2017 2018 2019 2020 January 7,705,923 8,650,571 10,343,786 February 8,361,009 8,308,289 9,822,165 March 9,402,385 10,819,802 11,886,061 April 8,323,215 10,844,272 11,165,402 May 9,140,886 10,879,063 June 9,301,139 10,940,645 July 9,672,440 10,908,295 August 9,744,290 11,072,479 September 9,925,602 10,295,468 October 9,431,265 11,160,312 November 10,258,533 11,003,514 December 9,715,509 10,288,206 Total BHT 110,982,196 125,170,916 43,217,414 113% 112%
- 31. Process Engineering Economics y = 8.252x5 - 596.4x4 + 13493x3 - 82224x2 - 23371x + 1E+07 R² = 0.306 ELECTRICITY BILL Baht 2017 /2018 /2019 y = 4.931x5 - 365.4x4 + 8878.x3 - 73668x2 + 13175x + 6E+06 R² = 0.325y = -0.546x6 + 59.06x5 - 2409.x4 + 45531x3 - 38886x2 + 1E+06x + 5E+06 R² = 0.341 2017/ 2018/ 2019 KW day M-F KWH night M-F KWH weekend P P OP Poly. (OP) Poly. (OP)
- 32. Process Engineering Economics y = -12.02x5 + 972.9x4 - 27720x3 + 33297x2 - 1E+06x + 1E+07 R² = 0.77 Total ( Gas bill Baht ) 2017/2018/2019 y = -0.054x5 + 4.618x4 - 138.8x3 + 1750.x2 - 6748x + 40695 R² = 0.826 y = -0.054x5 + 4.618x4 - 138.8x3 + 1750.x2 - 6748x + 40695 R² = 0.826 y = -0.054x5 + 4.618x4 - 138.8x3 + 1750.x2 - 6748x + 40695 R² = 0.826
- 33. Process Engineering Economics y = 18.32x5 - 1387.x4 + 36822x3 - 40654x2 + 2E+06x + 5E+06 R² = 0.595 Water Bill Bht y = 0.264x5 - 21.93x4 + 635.3x3 - 7337.x2 + 25872x + 22890 R² = 0.436 Water Consumption 2017/2018/2019 fresh water recycled water used water waste water Poly. (fresh water)
- 34. Process Engineering Economics max natural Boiler No 2 pressure test pressure test working pressure efficiency Celcius capacit y BHP gas 9.1 kg/c m2 12kg/cm2 7kg/cm2 80% 183 5600 kg/ hr 358 409m3/hr 9.6 kg/c m2 max natural Boiler No 3 pressure test pressure test working pressure efficiency Celcius capacit y BHP gas 9 kg/c m2 12kg/cm2 7kg/cm2 90% 183 16000 kg/ hr 1023 1170 9.3 kg/c m2 9.6 kg/c m2 max natural Boiler No 4 pressure test pressure test working pressure efficiency Celcius capacit y BHP gas 9.2 kg/c m2 12kg/cm2 7kg/cm2 90% 183 16000 kg/ hr 1023 1170m3/hr 9.5 kg/c m2
- 35. Process Engineering Economics Total soft water consumption (average) 250 m3/day Total Boiler make up water Consumption 213 m3/day 8.9 m3/hrs. Total Steam Supply (Average) 22 m3/hrs. 75% Condensate return 16.5 m3/hrs. Soft water make up 5.5 m3/hrs. Condensate Overflow 3.4 m3/hrs. Cost of Soft water 26 THB 87.21 THB/hrs. Cost saving of softwater 732,550 THB/Year Specific Entraphy of Water at 85 OC 356 kj/kg Specific Entraphy of Water at 35 OC 147 kj/kg Delta Enthralpy of condensate (85OC - 35OC) 209 kj/kg Total Energy loss of overflow water 5,732,184,591 kj/year NG Price 300.00 Baht/mmBTU 0.0003165180 Baht/kj Cost saving of NG 1,814,340 THB/Year 77 % Efficiency of NG Boiler 2,356,285 THB/Year Total Saving (Soft Water + NG) 2,546,890 THB/Year Safety Factor 70% 1,782,823 THB/Year 55,436 USD/Year Investment Cost 1,399,000 THB 43,501 USD ROI 0.78 Year IRR 119%
- 36. Process Engineering Economics CAH Rayon water usage Old plantOld plantOld plant Pineapple Process water Pineapple On line chlorination Phase On line chlorination 144 m3/day (In plan) Cleaning water (398.304+346.464) x 3 = 2,234.304 m3/day Water tank change 46.352 x 3 = 139.056 m3/day Total process water 2,373.36 m3/day Target: 2,500 m3/day Amata City water m3/day High 7,900 Average 7,200 Low 6,960 Target: 10,000 300 m3/hr. Sand filter Carbon filter 300 m3/hr. x 3 300 m3/hr. x 3 Fire fighting pump storage tank 850m3 Static storage Amberlite IR 120Na Manganes Sulfte Resine filter 1 x 150 m3/hr. Plan + 2 x 150 m3/h. Feeding Tank 100 m3 CAP Pw1 DSP Utility Cooling 175 m3/d Toilet 340 m3/d Garden 20 m3/d Canteen/other 140 m3/d Chlorine 1 1,500 m3/d Chlorine 2 1,500 m3/d Forming 3,200 m3/d Di-chlorine water D1 1,500 m3/d D2 1,500 m3/d Hot water 3,000 m3/d Recycle water RO water 3,000 + 1,500 m3/d Target 6,000 m3/d Waste water for Amata City Scrubber Chlorine water processing plant 150 m3/d (in Plan) Mix compound Latex 800 m3/d Soft water tank 150 m3 CAP 200 m3/hr 150 m3/hr D1 Dii-chlorine water treatment 1,500 m3/d BOD/COD <<< 300 m3/hr. PW storage tank CAP 600 m3 Boiler 300 m3/d
- 37. Process Engineering Economics Di Chlorine # 1 COD, BOD Not meet standards 1,500 m3/day Di Chlorine # 2 COD, BOD Within standards 1,500 m3/day Recycle Plant EQ 1,500+3,000 = 4,500 m3/day Efficiency 50% 2,000 to 2,200 m3/d Di Chlorine # 1 EQ = 100 m3 1,500 m3/day BOD < 20 ppm COD < 120 ppm pH reactor & DAF 4,500 m3/day BOD, COD within standards Hot Water 3,000 m3/day 47 Celsius Hot Water 3,000 m3/day 47 Celsius Cooling Tower Target 38 Celsius Efficiency 42 Celsius pH reactor & DAF 1,500 m3/day BOD, COD within standards RO plant Input 6,000 m3/day Output 4,000 m3/day RO plant Input 6,000 m3/day Output 4,000 m3/day Amata water supply average 7,200 m3/day 300 m3/hr Amata water supply average 7,200 m3/day 300 m3/hr Process waterProcess water Process Water Other usages 1,200 m3/day Process Water Other usages 1,200 m3/day 2 x Rocket Heat Exchanger in series 2 x Rocket Heat Exchanger in series
- 38. Process Engineering Economics RO plant Input 6,000 m3/day Output efficiency 4,560 m3/day 4,000 m3/day RO plant Input 6,000 m3/day Output efficiency 4,560 m3/day 4,000 m3/day RO – 301 CAPACITY 54 membranes 30 m3/hr 720 m3/day RO – 301 CAPACITY 54 membranes 30 m3/hr 720 m3/day RO – 302 CAPACITY 72 membranes 40 m3/hr 960 m3/day RO – 302 CAPACITY 72 membranes 40 m3/hr 960 m3/day RO – 303 CAPACITY New 72 membranes 40 m3/hr 960 m3/day RO – 304 CAPACITY 72 membranes 40 m3/hr 960 m3/day RO – 304 CAPACITY 72 membranes 40 m3/hr 960 m3/day Di-Chlorine 1,500 m3/day COD > 300 BOD > 50 Ph > 10 New adjustment Sulfuric Acid Coagulant Alum Coagulant Polymer New EQ tank capacity 100 m3 New or repaired DAF RO plantRO plant RO – 305 CAPACITY New 72 membranes 40 m3/hr 960 m3/day New MBR Membrane Might be required
- 39. Process Engineering Economics utilities expenses Bht/month Bht/year Gas 20million 12 240million 52.6% electricity 13million 12 156million 34.2% Compressor No 4 1200CFM overhaul water 5million 12 60million 13.2% Compressor No 6 2400CFM improve % Compressor No 7 2400CFM improve 456 5.5% 25.08million Bht compressed air leakage 1060CFM eliminate Boilers 2 15.0% 30.0% Burners 2 plants 1 70.0% 70.0% Actual capacity avilable 3740CFM 100.0% Chlorination 14.0% air compressor 6&4 3600CFM improve forming Plant 1 Lines 9 42.0% air compressor 7&4 3600CFM improve forming Plant pineaple Lines 3 14.0% 70.0% 156,250 compressed air leakage 5.00million/year Boiler 2 5.6ton/hr 14.9% Boiler 3 16ton/hr 42.6% 57.4% 15.984 RO water daily supply min average max Boiler 4 16ton/hr 42.6% 85.1% 23.68 2500 2900 3900 23.5from City Amata 37.6ton/hr 100.0%efficiency 74% 27.824ton/hr 13.5from RO Boiler 1 30.0% 10.0saving saving from using 0.325 32.5% 16 T and 5.6 T instead of 15.984 1,000 increase RO output 16 T x 2 boilers 23.68 9.8% 10,000 saving/day 3.00 million/year utilities saving originally from 240million Bht 250,000 25 3,000,000 12 savings from replacing 1 of 16 ton boiler 23.4 million Bht with the 5.6 Ton/hr boiler 32 93,750 saving target 25.08million Bht
- 40. Process Engineering Economics Air Compressor CFM bar KW psi KW/CF M Air Compressor test bar test CFM test KW KW/CF M 24 355 3.12 32 AC4 1200 8.2 250 1050.2083 AC4 KW KW Bht US$ AC6 2469.1 8.2 370 1050.1499 AC6 7.0 1857.1 413 0.2223 8975 AC7 2469.1 8.2 410 1050.1661 AC7 7.0 2141 406 0.1896 3101 compressed air leaking 440.7 5.55 compressed air leaking 1084 7.02 0.1579 5229 223.3 0.2060 1038 5,359. 6 1,902,64 6 5,936,25 5 185,50 8 1540 7.42 Compressed Air leakages 1000 Compressed Air leakages 850 175.1 4,203 1,491,92 7 4,654,81 3 145,46 3 Energy saving at 85% 85% Energy saving at 85% Savings comes from continuous fixing of compressed air leakages throughout the year
- 41. Process Engineering Economics at 90% Ton/hr Nm3/hr kcal/N m3 kcal/hr IF Heat Supply number of lines 17 Boiler # 4 16.0 1,259 940011,834,600 steam usage 15,000 kg/hr Boiler # 3 16.0 1,259 940011,834,600 11,834,600 condensate 15,000 kg/hr Boiler # 2 5.6 356 94003,346,400 3,346,400 steam pressure 0.75Mpa steam temp 170 Celsius 21.6 1,615 15,181,000 drain out temp 160 Celsius at 90 % 19.44 cost in Bth per Nm3 9.50 15,343 Bht/hr 368,220Bht/day tank return temp 135 Celsius 11,046,600 Bht/mth estimated energy 450,000 kcal/hr Heat Requirements water tanks steam pineapple 526 94004,944,000 heat exchanger water tanks steam old plant 789 94007,415,100 steam usage 2,000 kg/hr chemical tanks pineapple 17 9400 162,000 condensate 2,000 kg/hr chemical tanks old plant 32 9400 297,000 steam pressure 0.75 Mpa steam temp 170 Celsius 1,364 12,818,100 84% drain out temp 160 Celsius tank return temp 135 Celsius estimated energy 60,000 kcal/hr
- 42. Process Engineering Economics at 90% Ton/hr Nm3/hr kcal/N m3 kcal/hr IF Heat Loss Estimation pineaple 150,000 recovery tank old plant 300,000 lost in evaporation 800kg/hr plate heat exchange 60,000 condensate vol 14,600 kg/hr tank return temp 135 Celsius returned condense tank 511,000 deareation tank 100Celsius condense overflow 180,000 estimated energy 511,000 kcaL/hr 127.77 94001,201,000 discharge pipe Savings hot water discharge 2400kg/hr Baht to Nm3 9.5 discharge temp 100Celsius Baht/hr 1 1,214 top up water temp 25Celsius Baht/day 24 29,131 estimated energy 180,000 kcal/hr Baht/mth 25 728,266 Baht/year 12 8,739,191 Baht to US $ 32.59 268,156
- 43. Process Engineering Economics US$ Investment estimated water lost 3200kg/hr closed system 15 T in US$ 170,000 estimated requirement 16.24ton/hr ROI in years 0.63 closed system Capacity 18ton/hr Recommendation closed system 18 T in US$ 204,000 open system as backup in US$ 30,000 contingency in US$ 10,000 Water RO Water Hot Water+ di- chlorine waste water Raw Water 9,200 m3/day 4,200 m3/day 6,200 m3/day 5,000 m3/day 80% of raw water charged as ww 7,360 m3/day Latex Mix compound tanks 800 m3/day 800 m3/day Forming old plant 3,000 m3/day hot 3,000 m3/day DSP pineapple plant 1,500 m3/day Chlorination 3,400 m3/day 3,400 m3/day chlo 3,200 m3/day Admin General usage 500 m3/day cost in Bht/m3 23.50 Bht/m3 13.5Bht/m3 hot 122.74Bht/m3 80% raw water is waste water charge 10.00 Bht/m3 processed soft water cost 0.13 Bth/m3 di-chlorine process water chlo Bht/m3 Total cost/day 291,028 Bht/day 56,700 Bht/day 368,220 Bht/day 715,948 Bht/day 21,478,428 Bht/mth
- 44. Process Engineering Economics Utility Activity มี.ค.-20 เม.ย.-20 พ.ค.-20 มิ.ย.-20 Electricit y W12 W13 W14 W15 W16 W17 W18 W19 W20 W21 W22 W23 W24 W25 W26 Compresor #4 Overhaul compressed air leakages Compressor # 4 & 7 or 10 Gas condense closed system steam leakages & gasket open system backup Water di-chlorine water treatment PW + Hot water supply RO pineapple on-line chlorine water
- 45. Process Engineering Economics Required Compressed Air Vlume Flow : 82,080 CFM/Day Running Air Comp. Cap. 2400 + 2400 CFM Spec Energy Kwh Total Cap. & Energy Actual Cap. & Energy MC HP Kw Cap CFM Perfor mance Run Rate KW/day Kw/CFM 0.31 CFM/day Kw/Day Kew/Mont h Cap. CFM Kw/Day Kw/Month Air Comp.# 1 335 250 1200 60% 0% 6,000 0.2083 0.0646 17,280 6,000 180,000 0 0 0 Air Comp.# 2 335 250 1200 0% 0% 0.2083 0.0646 0 0 0 Air Comp.# 3 335 250 1200 60% 0% 6,000 0.2083 0.0646 17,280 6,000 180,000 0 0 0 Air Comp.# 4 335 250 1200 90% 0% 6,000 0.2083 0.0646 25,920 6,000 180,000 0 0 0 Air Comp.# 5 120 90 600 95% 0% 2,160 0.1500 0.0465 13,680 18,144 544,320 0 0 0 Air Comp.# 6 500 370 2469.1 67.38% 100% 8,880 0.1499 0.0465 39,928 8,880 266,400 39,928 8,880 266,400 Air Comp.# 7 500 410 2469.1 87.57% 100% 9,840 0.1661 0.0515 51,893 9,840 295,200 51,893 9,840 295,200 38,880 - 165,981 54,864 1,645,920 91,821 18,720 561,600 Air Comp #6 & #7 18,720 91,821 18,720 561,600 Energy Cost 1,853,280 THB/Mon th
- 46. Process Engineering Economics Energy Consumption Accural for June 2020 Type of Energy Consumption Unit price Demand (Baht) Cost (Baht) Electrical 4,358,846 3.12 N/A 13,605,854.72 Gas 69,051 316.69 709,389.13 22,576,773.56 Water 237,328 23.50 N/A 5,577,208.00 Waste water 189,862.40 10.00 N/A 1,898,624.00 Recycling Water 36,322 14.75 N/A 535,749.50 Total 44,194,209.78
- 47. Process Engineering Economics Project Prioritization Criteria Weight- age # 1 # 2 # 3 # 4 # 5 Plant Cost Saving Project Prioritization Matrix Financial Impact/ Annual saving Easeof Completion /Technical Customer Impact Complexity CAP Investment UoM US$ Score Score Score US$ Score 9 >250 high none none <50 9 3 <250 >100 medium low low <250 >50 3 1 <100 >50 low medium medium <1000 >250 1 0 <50 none high high >1000 0 93,100.69 R A N K I N G O F I M P O R T A N C E (1-5, 5 is Highest) Project Name Brief Description of Project Annual savings / (USD '000) FY20 savings / (USD '000) 5 4 3 4 3 TOTAL 1 Inkuff Combined Glove reverse/ink-marking & cuffing as one process to get the HC reduction 1950 0 9 3 3 1 0 70 2 Manpower optimization for changeover in forming (6HC) RTI project 24 HC (12 in plant-1 & 12 in DSP) 269 269 9 9 9 9 9 171 3 OEE/OEU improvement (Chlorination) 2% Efficiency improvement (5HC) 52 52 1 9 9 9 9 131 4 OEE/OEU improvement (Packaging) 3% Efficiency improvement (reduce RTI = 9HC) 94 94 1 3 9 9 9 107 5 Semi-auto print case label 9HC reduction 94 94 1 3 9 9 9 107 6 DL allocation CAH : Outsource DL rate by outsource TBD TBD 3 9 9 9 9 141 7 Latex premium Vol allocation between Thai rubber & SriTrang 84 84 1 9 9 9 9 131 8 Shoprene Price Price Negotiate (LRP $1.995) 0 0 9 9 9 9 9 171 9 BST Price reduction New tier pricing TBD TBD 9 9 9 9 9 171 10 Kraton volume discount Price reduction due to volume 1017 1017 9 9 9 9 9 171 11 Michemlube Local Allocation, Price negotiation, target 15% reduction from FY18 Budget (LRP THB102) TBD TBD 0 12 MG Paper (second source) Alternative source FY19 SCG (30%) TBD TBD 0 13 GP contract TBD TBD 0 14 Replacement of silicone Implement silicone 0349 to replace SM2140 on others product codes (PTY family) 100 100 1 9 3 9 9 113 15 Dispenser box 16 to 15 inches TBD TBD 0 16 1GL DC Price Negotiate 0 0 3 3 3 1 3 49 17 Prius5 DP blended for PI / PI classic / PI Ortho 104 0 3 1 3 1 3 41 18 Silicone MEM39 and 349 Alternative source (Momentive Rayong Thailand), target price reduction 10% from FY18 Budget 25 25 3 9 3 3 9 99 19 Corn Starch Powder 100% National Starch 41 41 0 9 3 3 9 84 20 Shipping Case Alternative source, target price reduction 10% from FY18 Budget TBD TBD 0 21 Steam reduction Pineapple Heat exchanger saving carry over from FY18 0
- 48. Process Engineering Economics Project Name Brief Description of Project Annual savings / (USD '000) FY20 savings / (USD '000) 5 4 3 4 3 TOTAL 24 OH Cost Rationalization TBD 0 25 Lean Warehouse External WH Stroage cost reduction 0 27 Localize mold holder and accessories DP reduction 70 70 1 3 3 3 3 47 28 Ink (second soure) Alternative source 0 29 Convert acid online mold cleaning Material cost reduction 100 0 3 9 3 9 3 105 30 Chlorination Blank Cycle Time Reduction Improve Chlorinator Cycle time 151 151 3 9 3 9 9 123 31 10-20% Chlorination Load size Increasing of Protexis Latex Essential Capacity Improvement 35 35 0 9 3 9 9 108 33 Biomass Boiler readiness to work as back up anytime N/A 0 34 reduce amata raw water increase RO w/supply reduce amata raw water increase RO w/supply 90,909 35 improve the usage of steam boilers improve the usage of steam boilers N/A 36 eliminate fast steam from the condense tank eliminate fast steam from the condense tank N/A 37 Reduce steam leakages Reduce steam leakages N/A 38 Reduce compressed air leakages minimize compressed air leakages in process N/A 0 39 Maintenance spare parts inventory cost reduction agrupate parts by volume/value/supplier/common N/A 0 40 Blend back pump back latex of PI Blue Blend 5% of pump back for the 1st 3 tanks @ 5 days only. 115 115 1 3 9 3 9 83 41 Extend pot life of PI Blue latex 10 days to 12 days 45 45 0 9 9 9 9 126 42 Auto strip air blow - reverse strip 18HC reduction 43 AP machine 15 HC reduction 44 Reduce rinse water cycle time 45 Hybrid chlorination OLC donning side, Offline Chlo grip side combined with reverse strip. 1000 46 On-line ink marking 47 On-line mold cleaning 48 Spray system for Nitrile blend and base 49 PI double dip 50 PI line speed 60 51 Short length industrial product Reduce glove length Esteem/Duraprene CP 5 mm and Protegrity 10 mm to standardize with other PF Surgical product. 60 52 Linshi Alternate low cost PI material (18-20% lower price). 300 53 New powder free coagulant and polymer for chlorine free process New powder free coagulant and polymer for chlorine free process 54 Development of surfactant use in PI compound Support on development the surfactant use in PI compound to give us a robust process for higher line speed. 5,705 93,101
- 49. Process Engineering Economics Closing Comments: Business culture, the skills and competencies of employees, and organizational structure are all important factors that influence how an organization can achieve its stated goals, objectives Inflexible companies may find it difficult to succeed in a changing business environment. Creating a barrier between the development of strategies and their implementation can make it difficult for managers to determine whether objectives have been efficiently met While an organization’s upper management is ultimately responsible for its strategy, the strategies themselves are often sparked by actions and ideas from lower-level managers and employees An organization may have several employees devoted to strategy rather than relying solely on the chief executive officer (CEO) for guidance Because of this reality, organizational leaders focus on learning from past strategies and examining the environment at large. The collective knowledge is then used to develop future strategies and to guide the behaviour of employees to ensure that the entire organization is moving forward For these reasons, effective strategic management requires both an inward and outward perspective. Upper Management is usually tight up by Corporate Management policies and strategies; for the Plant Engineers, there is always a political compromise to enter into either “Continuous Improvements or FAST and FURIOUS Turn around management mode” However, it is more productive to work by the Plant process than by the rush of accumulating Six Sigma Continuous Improvements and KAIZEN projects. It is always best to Audit the complete Plant facilities design and performance; fixing all low performing systems, and use sound Engineering approach
- 50. Process Engineering Economics 3rd Party Logistics Business Objective FY 2020: 1. Retaining the Existing Contracts 2. Obtaining at least one warehouse project 3. New Business Growth + 20% Mr. TC Country Head (Thaialand) Learnings of F 19 & Business implications Financial performance (Local currency in MTB) Learnings of F19 Business Implication Parameter FY'16 FY'17 FY'18 **FY'19 P FY'20 P FY 21P Business size small with few contracts No significant Growth Thai COVID19 leading to factories closure PBT Loss ,Recovery expected in Q4 Revenue 137 88 110 80 138 193 OEMs having nominated Service Providers Entry barrier for OEM business % Growth 453% -57% 20% -37% 42% 29% Global OEMs having long BD cycle-New plants NB revenue Drop EBITDA 2.73 2.39 3.65 0.88 2.01 10.16 Rate renegotiation with Transporters Margin Improvement % Growth 1.99% 2.72% 3.32% 1.11% 1.46% 5.26% Services levels maintained with CS above 90% Business Rention with renewals PBT 2.39 2.06 3.35 0.29 1.31 8.82 Participation in Fairs ,Networking Brand visibility and more RFQ % Growth 1.74% 2.35% 3.06% 0.36% 0.95% 4.57% Need for matching competitors capability incl.ITTo retain wallet share with MSA Net Cash in Flow 4.6 -3.6 8.6 -1 -1 3 Assessment of opprtunity,capability and resources for implementing MESCO Tooling supply chain Revenue growth through' other verticals Critical Success Factors Critical Success factor Initiatives Holder Measure Services Rendered - Customer wise 1. Financial Excellence To acquire /form JV with local logistics company having capabilities/infrastructiure TC ธ.ค.-19 Customer name Material mgmt Warehouse mgmt Transport mgmt Freight mgmt Asset Based BOI approval for entry into new verticals Gokul ส.ค.-19 Mex Summit A Y 2. Operational Excellence Adherence of KPI Pomual No complaint Aapico Y To ensure CS above 90% Pomual 90% Aztec Kubota Y Tata Motors Thailand Y Y 3. Customer Excellence To scale up with new business development. Luis 30 MTB Mex Chanathon Y International casting Y Customer development with TMTL MSR Kumar 6 MTB Unity Y 4. IT Excellence To provide supply chain visibility and reports to MSA Pomual ก.ย.-19 Mahle Aztec Y Competition and other threats Threat Counter action 5. Talent Excellence To recruit BD Head and OPS Head TC พ.ค.-19 Wallet share reduction in Mex Summit due to CUEVITA Service level enhancement To train team on business verticals TC มิ.ย.-19 Local transporters competing with lower prices Value additions to customers To train the team on HR policies Madhu มิ.ย.-19 Critical business opportunity Opportunity Target Value Business from Volkswagen - inbound operations ก.ย.-20 RFQ from CAT - inbound operations ก.พ.-20 Key Business Metrics Business metric Value Turnover 138 MTB Business from Volkswagen ก.ย.-20 JV with GOLF ธ.ค.-20 Support required from management MESCO model implementation มี.ค.-20 Support required From Entry into large scale Warehousing ธ.ค.-20 Board approval for acquisition/JV Management Board
- 51. Thank You L | C | LOGISTICS PLANT MANUFACTURING AND BUILDING FACILITIES EQUIPMENT Industrial Engineering Management E-Book INDUSTRIAL ENGINEERING MANAGEMENT FUNDAMENTALS AND HOW IT WORKS PROCESS ENGINEERING ECONOMICS