International Indicators of Quality Education Wera Paper Draft. By some authors. November 2013
•
3 gefällt mir•2,501 views

International indicators of quality education wera paper draft. Connections: The Learning Sciences Platform work is focus on: - Educational Support “in situ” - Professional Development - Educational Research This work is complemented with “in situ” accomplaniment and joint research. Visit our social networks - Website: http://thelearningsciences.com - Facebook: https://www.facebook.com/connectionstlsp/ - Instagram: ConexionesPCA2017 - Slideshare: https://www.slideshare.net/Lascienciasdelaprendizaje - YouTube: https://www.youtube.com/channel/UCyUDsQmjsiJl8T2w5-EF78g - Linkedin: https://www.linkedin.com/company-beta/16212567/ Contact us: E-mail: info@thelearningsciences.com Mobile: +593 995 615 247

Empfohlen
Weitere ähnliche Inhalte
Was ist angesagt?
Was ist angesagt? (18)
Andere mochten auch
Andere mochten auch (18)
Ähnlich wie International Indicators of Quality Education Wera Paper Draft. By some authors. November 2013
Ähnlich wie International Indicators of Quality Education Wera Paper Draft. By some authors. November 2013 (20)
Mehr von Conexiones: The Learning Sciences Platform
Mehr von Conexiones: The Learning Sciences Platform (20)
Kürzlich hochgeladen
Kürzlich hochgeladen (20)
International Indicators of Quality Education Wera Paper Draft. By some authors. November 2013
- 1. Tokuhama-‐Espinosa, Rivera, Tobar, Solano, Proaño, Tirira & Merino Nov 2013 WERA Selection of Quality Indicators in Education 1 INTERNATIONAL INDICATORS OF QUALITY EDUCATION: HOW ECONOMIC STATUS, UNITS OF ANALYSIS AND CULTURE CAN INFLUENCE COUNTRY CHOICES OF KEY QUALITY INDICATORS IN EDUCATION By Tracey Tokuhama-Espinosa, Ph.D. Mariana Rivera Claudia Tobar Isabel Solano Scarlet Proaño Mishel Tirira Isabel Merino November 2013 Universidad San Francisco de Quito, Ecuador Suggested citation: Tokuhama-‐Espinosa, T. Rivera, M., Tobar, C., Solano, I., Proaño, S., Tirira, M. & Merino, I. (2013). International indicators of quality education: How economic status, units of analysis and culture can influence country choices of key quality indicators in education. Paper presented at the World Education Research Association (WERA) Focal Meeting and 12th National Conference on Educational Research, Guanajato, Mexico, 18-‐22 November 2013.
- 2. Tokuhama-‐Espinosa, Rivera, Tobar, Solano, Proaño, Tirira & Merino Nov 2013 WERA Selection of Quality Indicators in Education 2 Table of Contents Introduction ................................................................................................................................................................. 7 Background Information ................................................................................................................................... 7 High Quality Education and Development ............................................................................................ 8 Existing Quality Indicators ........................................................................................................................... 8 Why Agreeing on Quality Education Indicators Is So Hard ........................................................... 9 A Decision-‐Making Model ............................................................................................................................... 10 The Objective of Formal Education: “Quality” .................................................................................. 10 Floors and Ceilings. ................................................................................................................................. 11 The Current Reality ........................................................................................................................................... 12 Research Questions ........................................................................................................................................... 13 Definitions ............................................................................................................................................................. 13 Conceptual Framework: .................................................................................................................................. 19 Backward Design ........................................................................................................................................... 19 John Hattie’s Work ........................................................................................................................................ 20 Significance of the Study ................................................................................................................................. 21 Literature Review ................................................................................................................................................... 22 Themes ................................................................................................................................................................... 22 Indicator Categories: How Quality Education is Measured ........................................................ 23 Category 1: Access or Coverage ......................................................................................................... 23 Category 2: Equality and Equity ........................................................................................................ 34 Category 3: Retention, Completion, Staying-‐rates ..................................................................... 42 Category 4: Standards ............................................................................................................................ 51 Category 5: Academic Achievement ................................................................................................. 55 National Exams ......................................................................................................................................... 62 Category 6: Teachers and Teaching ................................................................................................. 65 Category 7: Evaluation ........................................................................................................................... 75 Category 8: Financing ............................................................................................................................. 81 Category 9: Governance ........................................................................................................................ 88 Category 10: Family and Community .............................................................................................. 92 Category 11: Context (Culture, Legal system and Demographics) ..................................... 98 Evaluations of Quality Education Indicator Frameworks ......................................................... 101 Bottani’s OECD 1998 study ................................................................................................................ 101 Cheng and Tam’s Seven Multi-‐models of quality in education framework (1997) ... 102 Jaap Scheerens (2004) Conceptual Framework for Measuring Quality ......................... 103 Sahlberg’s comparison of current versus optimal indicators (2011, 2012) ................ 108 John Hattie’s Mata-‐Analysis of 900+ Meta-‐Analyses ................................................................... 110 Methodology ........................................................................................................................................................... 114 Analysis ..................................................................................................................................................................... 118 Product, Process, Progress ........................................................................................................................... 119 Unit of Analysis ................................................................................................................................................. 121 Basic Educational Quality, Proficient Educational Quality, Sophisticated Educational Quality or Advanced Educational Quality ............................................................................................. 130 Low, Medium, High Fidelity Data .............................................................................................................. 137 Low, Medium, High Cost ............................................................................................................................... 147 Relatively Low, Medium, High Complexity (data gathering) ........................................................ 155
- 3. Tokuhama-‐Espinosa, Rivera, Tobar, Solano, Proaño, Tirira & Merino Nov 2013 WERA Selection of Quality Indicators in Education 3 Frequency of application (Low=Less than annually; Medium=Annually High=Always up-‐ to-‐date) ................................................................................................................................................................. 169 Summary of the Seven Questions ............................................................................................................. 176 A Framework for Decision-‐Making Processes .................................................................................... 177 Understanding By Design ........................................................................................................................ 177 What Should Be Measured? .................................................................................................................... 178 Influence on Choice of Indicators: Culture and Values .......................................................... 179 What Should Not Be Measured? ........................................................................................................... 179 Influence on Choice of Indicators: A Tradition of Measurement? ..................................... 179 Influence on Choice of Indicators: Non-‐Issues .......................................................................... 180 Proposal: International Indicators of Quality Education Framework ................................. 181 Cycle of Innovation ..................................................................................................................................... 182 Critique of Accepted Indicators ................................................................................................................. 183 Conclusions .............................................................................................................................................................. 184 1. Economic Status and Indicator Choice .............................................................................................. 184 2. Unit of Analysis and Indicator Choice ................................................................................................ 185 3. Culture, Values, History and Indicator Choice ................................................................................ 186 Reflection and Discussion ............................................................................................................................ 187 Limitations of this Study ............................................................................................................................... 187 Recommendations for Future Studies .................................................................................................... 188 Final Thoughts ................................................................................................................................................... 188 References ................................................................................................................................................................ 190 Appendix A Frameworks for Classifying Quality Indicators in Education ................................... 218
- 4. Tokuhama-‐Espinosa, Rivera, Tobar, Solano, Proaño, Tirira & Merino Nov 2013 WERA Selection of Quality Indicators in Education 4 Figures Figure 1. Units of Analysis ...................................................................................................................................... 7 Figure 2. Household income in OECD nations ............................................................................................ 12 Figure 3. Education Quality ................................................................................................................................ 14 Figure 4. Last Year (Age) of Compulsory Education in OECD Countries ........................................ 24 Figure 5. Attendance, Compulsory Education in OECD Countries, 2012 ........................................ 25 Figure 6. Enrollment in Pre-‐Primary 2010 .................................................................................................. 26 Figure 7. Pre-‐Primary Attendance in OECD countries ............................................................................ 27 Figure 8. Total Net and Total Gross Enrollment Rates for Upper Secondary Education in OECD Nations, 2004 ..................................................................................................................................... 28 Figure 9. Access to Tertiary (Type B) Technical Education and Tertiary Type A University Education .......................................................................................................................................................... 29 Figure 10. Access to tertiary-‐type A education, 2011 ............................................................................. 30 Figure 11. Expected Years in Education from Ages 5 through 39 by Gender (2011) ............... 38 Figure 12. Average Income in OECD Countries ......................................................................................... 40 Figure 13. Education Age and Level Correspondence ............................................................................ 43 Figure 14 Model of Instructional Organization, Kindergarten through Grade 12 (K-‐12) ....... 43 Figure 15. Enrollment Rates at Different Levels of Education in OECD Countries, 2009 ........ 45 Figure 16. Upper Secondary Graduation Rates (2011) .......................................................................... 46 Figure 17. Upper Secondary Graduate Rates (2011) in OECD Countries ....................................... 47 Figure 18. Tertiary Graduation Rates and Average Ages of OECD Members 2011 .................... 49 Figure 19. Entry, Graduation and Completion Rates of Tertiary Education, OECD, 2011 ...... 50 Figure 20. Correlation of Low SES with PISA Scores ............................................................................... 56 Figure 21. Reading Rates Correlated with Expected SES Influence .................................................. 57 Figure 22. PISA Scores, 2009 ............................................................................................................................. 59 Figure 23. Distribution of Mathematics Achievement on TIMSS 2011 ........................................... 61 Figure 24. PIRLS Results, 2011 ......................................................................................................................... 62 Figure 25. Researcher per 10,000 People Employed .............................................................................. 64 Figure 26. Employment Rates Among 25-‐64-‐Year-‐Olds by Educational Attainment ............... 65 Figure 27. Teacher Training Program Durations in OECD Countries, 2012 ................................. 68 Figure 28. Support For Teacher Professional Development, 2011c ................................................. 70 Figure 29. OECD Teachers’ Salaries, 2012 ................................................................................................... 72 Figure 30. Ratio of Students to Teaching Staff ........................................................................................... 74 Figure 31. Teaching Hours in OECD Countries, 2011 ............................................................................. 75 Figure 32. Percent of GDP Spent on Education in OECD Nations 2000-‐2010 .............................. 84 Figure 33. Expenditure on Educational Instruction as a Percentage of GPD, 2010 ................... 86 Figure 34. Functional Distribution of Sub-‐central Government Spending (2009) ..................... 89 Figure 35. Decentralization in OECD Countries, 2011. ........................................................................... 91 Figure 36: Public Spending on Family Benefits in Cash, Services and Tax Measures (in per cent of GDP) 2009 ......................................................................................................................................... 97 Figure 37: The Influence of Parental Backgrounds on Student Achievement in Secondary Education Varies Widely Across OECD Countries. ....................................................................... 100 Figure 38. Scheerens’s Input-‐Process-‐Outcomes-‐Context Framework (2011) ......................... 105 Figure 39. “Ordering of the OECD-‐INES education indicator set, according to a context– input, process and outcome scheme” ................................................................................................. 107
- 5. Tokuhama-‐Espinosa, Rivera, Tobar, Solano, Proaño, Tirira & Merino Nov 2013 WERA Selection of Quality Indicators in Education 5 Figure 40. Stages of the process on educational systems. ................................................................... 108 Figure 41. John Hattie’s Relative Ranking of 150 Different Influences on Student Learning Outcomes ........................................................................................................................................................ 110 Figure 42. Terms Associated with Quality Categories of Indicators .............................................. 114 Figure. 43 Educational Quality Indicators as Used by the 34 OECD Countries .......................... 117 Figure 44. Cumulative List of Possible Indicators to Measure Quality Education .................... 117 Figure 45 Product, Process, Progress .......................................................................................................... 119 Figure 46 Examples of Product, Process, and Progress Indicators ................................................. 120 Figure 47. Scheerens’s 2011 Overview of Educational Input, Process, Outcome and Context indicators ........................................................................................................................................................ 121 Figure 48. Units of Analysis .............................................................................................................................. 122 Figure 49. Indicators Divided By Units of Analysis ................................................................................ 122 Figure 50. Indicators Divided By Basic, Proficient, Sophisticated or Advanced Education Quality .............................................................................................................................................................. 130 Figure 51. Description of Indicators Divided By Data Fidelity ......................................................... 138 Figure 52. All Indicators Divided By Data Fidelity ................................................................................. 139 Figure 53. Indicators Divided By Costs ....................................................................................................... 147 Figure 54. Indicators Divided By Data Complexity (Gathering) ....................................................... 155 Figure 55. Indicators Divided By Data Complexity (Analysis) .......................................................... 162 Figure 56. Indicators Divided By Frequency ............................................................................................ 170 Figure 57. Backward Design (Wiggins and McTighe, 2005) .............................................................. 178 Figure 58. International Indicators of Quality Education Framework .......................................... 181 Figure 59. Cycle of Innovation ......................................................................................................................... 182
- 6. Tokuhama-‐Espinosa, Rivera, Tobar, Solano, Proaño, Tirira & Merino Nov 2013 WERA Selection of Quality Indicators in Education 6 Abstract In addition to being considered a fundamental human right (Inter-Agency Commission, 1990), high quality education has implications for the economic well being of nations (Denison, 1962; Hanushek & Wößmann, 2007). Quality education is related to both individual as well as societal welfare (Behrman & Stacey, 1997). Nearly every government in the world is undergoing some type of educational reform in hopes of improving outcomes (Robinson, 2010) in order to better their citizen’s livelihood and country growth. Each educational reform or policy change has consequences, which governments do their best to measure. Given that there are many indicator choice options but limited available resources, countries must prioritize key quality indicators and only measure a few annually. How is this selection best conducted? This paper professes a systematic look at (1) what indicators exist to measure quality education; (2) which indicators are used by which countries and why depending on how priorities are decided, (3) and finally proposes a suggested framework for decision-making. Throughout, we discuss the differences between country choices based on economic status and development, the units of analysis chosen as the focus of measurement, and possible influences of culture. It was found that there are 217 different indicators that have been used to measure educational quality over the past 15 years by OECD nations. These indicators range from “basic” to “advanced” and can be used to mark “floors” (minimum standards) and “ceilings” (ultimate goals) in education. Different countries choose to measure different indicators for a variety of reasons, among them due to economic restraints, ease of data gathering or analysis, specific units of analysis as they reflect policies, and a country’s cultural context. This study ends with an analysis of various existing frameworks for decision-making and suggests a new process meant to pose appropriate questions that guide choices rather than prescribe indicators for measuring educational quality.
- 7. Tokuhama-‐Espinosa, Rivera, Tobar, Solano, Proaño, Tirira & Merino Nov 2013 WERA Selection of Quality Indicators in Education 7 Introduction Background Information This paper begins with the premise that quality education is a multi- dimensional concept and cannot be easily assessed but which must be undertaken despite the current limitations of measuring tools. The complexity of the teaching-learning process, formal education structures, and the various possible units of analysis (from individual student learning outcomes, to teachers, to achievement by school districts to international country comparisons) (Figure 1), mean that measuring quality must be approached on several fronts if it is to succeed (Scheerens, 2011). This paper also presumes that many of the most important factors related to educational quality are not easily measureable with current evaluation tools. Figure 1. Units of Analysis The purpose of this study is to better understand how countries that have gone beyond the minimum quality indicators suggested by international organizations such as UNESCO (e.g., universal primary school access) currently choose what deserves measurement and why, and then to identify other as-of-yet unused gauges that may potentially offer improved information for better educational decisions. In part, this paper humbly seeks to respond to the daunting question, “Which indicators should we use to measure quality?” • Individual • Community or Province • National • International Country comparative studies Ministry of Education System Student Teacher Administrator Parents School Board School Circuit School
- 8. Tokuhama-‐Espinosa, Rivera, Tobar, Solano, Proaño, Tirira & Merino Nov 2013 WERA Selection of Quality Indicators in Education 8 High Quality Education and Development There is a direct link between quality education and development (Ball, 2013; Hanushek, 2011), individual well-being, economic stability and the generation of improved “human capital and capacity to acquire means for the satisfaction of other basic needs (Vos, 1998, p.1). In 2012, Hanushek and Woessmann developed a metric for the distribution of educational achievement across countries that tracks cognitive skill distribution with countries over time. They found “a close relationship between educational achievement and GDP growth that is remarkably stable across extensive sensitivity analyses of specification, time period, and country samples” (p.267). They further suggest that “school policy can be an important instrument to spur growth” (p.267), meaning the correct choice of educational indicators to measure quality is vital to both the individual’s cognitive prowess and to a country’s economic well being. As educational budgets are a costly investment for governments with many nations spending around 4.9% of their GDP, in this area (World Bank, 2013; 5.5% for OECD nations), countries seek to maximize the return on resources in their systems. Just as good investments yield improved results in education, poor investments in the wrong educational choices can actually cause harm and damage potential human capital: “Assessment of the impact of educational investments thus requires a close monitoring of the quantity and coverage of educational services as well as of the quality of these services” (Vos, 1998, p.1). Existing Quality Indicators While there is general consensus on quality indicators in international comparative education, they are numerous (n=50) (Bottani, 1998), and “[i]t is virtually impossible to measure all of the factors which might have an impact” (Bottani, 1998, p.62). This number is quadrupled in Scheerens’s analysis (2011) to more than 200 different indicators that can be measured in education that are shown to indicate “quality” at some level. A significant amount of money is invested in measuring quality education and as a result many countries reflect profoundly on which indicators will best reflect outcomes, confirm policies, or suggest areas for improvement. However, many governments have difficulty choosing the correct indicators due to insufficient experience in this type of decision-making or due to political pressures (Biesta, 2007), resulting in the possibility that some countries resort to measuring easily available or less costly data, as opposed to appropriate indicators for their objectives. In Norberto Bottani’s review for the OECD on quality indicators on education in 1998 he noted, “[i]t is difficult to identify criteria for selecting indicators. This operation requires a conceptual framework reflecting the aims of the evaluation and of the education system” (p.61). This implies that context, cultural influences, value-systems, existing laws and demographics also have an influence on the correct choice of indicators to measure quality education. The development of a proper conceptual framework has been in progress for several decades. After models from the 1980s were rejected due to their “emphasis on causality and lack of interpretive power,” (Bottani, 1998, p.62), the International Indicators of Education Systems (INES) was devised and explained in The OECD
- 9. Tokuhama-‐Espinosa, Rivera, Tobar, Solano, Proaño, Tirira & Merino Nov 2013 WERA Selection of Quality Indicators in Education 9 International Education Indicators: A Framework for Analysis (1992b) and Making Education Count: Developing and Using International Indicators (1994). Subsequent to this international effort, several think-tanks, NGOs, universities and other organizations also contributed to the development of appropriate frameworks for decision-making primarily focused on evidence-based models (Davies, 1999; Slavin, 2002; Whitehurst, 2002). The current study builds off of the best attempts over the past 20 years to reach a descriptive model. Additionally, the current study takes into consideration not only the historical development of these frameworks, but also new studies about what impacts students learning outcomes (Hattie, 2009; 2012; Hattie & Armstrong, 2013) in hopes of contributing to a fresh perspective on the choice of appropriate quality education indicators. Why Agreeing on Quality Education Indicators Is So Hard Like other social institutions, standards are debated in education, but unlike other institutions, consensus about educational goals is not always coherent with what is measured. That is, while most countries on earth have embraced the importance of developing deep and critical thinkers, for example, they continue to use indicators such as multiple-choice tests that can only tackle superficial knowledge (Darling-Hammond, 2007) (for evidence of the characteristics of ideal “21st century learners, including critical thinkers, please see Binkley, Erstad, Herman, Raizen, & Ripley, 2010; European Parliament, 2007; European Parliament, 2007; Gardner, 2008; Jerald, 2009; Metiri Group, 2003; Mishra & Kereluik, 2011; Organisation for Economic Co-operation and Development, 2005; Partnership for 21st Century Skills, 2007; Trilling & Fadel, 2009; Zhao, 2012). An interesting contrast is provided by the car industry’s search for quality indicators. In the car industry, after much discussion, there are now agreed upon standard heights for bumpers, air bag installation and other common features to help homogenize car quality delivery. Though laborious and not without dispute, the decades-long discussion finally permits all drivers to expect the same level of quality in their cars in all of the countries that have agreed on these standards. In another on-going example, the International Standards Organization (ISO) seeks to find agreement in various industries such as agriculture and clothing manufacturing in order to create minimum expectations of producers in these fields. Related to education, the ISO has resorted to using consensus driven, qualitative, measureable outcomes. Unfortunately, ISO standards in education are limited to educational technology and ergonomics and how they influence learning outcomes but have not yet expanded to areas of quality instruction, for example. Education, being a social science and not exact engineering, may never master an agreed upon universal set of processes of quality indicators that reflect the goals of education, but it has agreed on certain minimums. According to Adams (1993), quality education is difficult to measure “[b]ecause of differences in national, regional and local expectations and values, [meaning] a universally accepted definition is unlikely to be found” (p.1). This is why Bottani concluded, “when selecting indicators able to correctly and quickly inform users of education systems about the performance and the state of education, certain choices must be made” (Bottani, 1998, p.62). These choices are not simple or neutral. The choice of
- 10. Tokuhama-‐Espinosa, Rivera, Tobar, Solano, Proaño, Tirira & Merino Nov 2013 WERA Selection of Quality Indicators in Education 10 which indicators to use are worrisome because “decisions about indicators--what to measure, who determines it, and how to make sense of the data—have the potential for very significant effects on education,” (Aschbacher, 1999, p.5). This means that choosing correct indicators is not an easy task and carries significant consequences. The minimum indicators are those generally espoused by international organizations, such as UNICEF (2000). In choosing indicators, most nations elect to meet these minimum standards and then reflect on additional indicators that are indicative of policy objectives. Once a nation has met minimum expectations in education a myriad of choices become apparent and selection of indicators becomes more individualized. A Decision-Making Model In Backward Design (Wiggins & McTighe, 2005), there are three basic steps towards guaranteeing measureable success. First, one must clarify the objective(s) being sought. Second, one must determine what will be acceptable indicators or evidence that the objective has been reached. Third, activities are executed which will provide the evidence or indicators necessary. The most important and as of yet unmet challenge in the selection of indicators to measure quality education is the agreement of what “quality” means in international comparative studies in terms of objectives. Several models of quality have been suggested over the past decade, pitting philosophical questions of competition versus collaboration; risk-taking versus “convergation” ([sic], Sahlberg, 2011C); and standardization versus innovation and creativity (Sahlberg, 2010). In order to choose the right evaluation tools and indicators we must have clear objectives, without which we will not be able to measure the achievement of quality education. The Objective of Formal Education: “Quality” If the objective of formal education is “quality,” what exactly does quality education means and how can it best be measured? The lack of consensus on the definition of quality education has created difficulties in measuring its existence (Harvey & Green, 1993). Is quality education based on how much is spent on education (Hanushek, 1981; Hanushek, 1989; Schultz, 1961)? How well prepared the teachers are (Darling-Hammond, 1997; Early, Maxwell, Burchinal, Alva, Bender, Bryant et al., 2007; Wilson, 2009)? How many performance indicators are met (Cave, 1997; Riley & Nuttall, 1994)? How many kids go to school (Barro & Lee, 2001; Alegre, M. À., & Ferrer, G. (2010)? How equitable our system is (Darling-Hammond, 2013; Lupton, 2005; Polat, 2011)? How engaged students are (Kuh, 2009; McCormick, Kinzie & Gonyea, 2013)? How well serviced the community is (Hill, 1995)? How big our class sizes are (Angrist & Lavy, 1999; Blatchford & Martin, 1998;)? How many graduates have good post-school jobs (Hanushek & Kimko, 2000; Harvey, 2001)? How well managed the system is (Galiani, Schargrodsky, Hanushek & Tommasi, 2002; Hill, 1995; Sallis, 1996)? Or how well a country fairs in international standardized tests comparisons (Hanushek & Woessmann, 2010)? Or is it possible that all of the above can and must be taken into consideration?
- 11. Tokuhama-‐Espinosa, Rivera, Tobar, Solano, Proaño, Tirira & Merino Nov 2013 WERA Selection of Quality Indicators in Education 11 In some cases quality education measurement is somewhat of a tautology: The easy but unhelpful solution is to decide that “quality” is merely the sum of what can be measured and nothing more. “As many researchers and other have noted, whatever is measured tends to take on heightened importance, or as H.D. Hoover wittily captured the notion: “WYTIWYG-what you test is what you get (1996) (Aschbacher, 1999, p.6). There are different ways to go about choosing what to measure that range from employability of students who graduate from the school system, to ranking on international exams, level of access by students with special needs, educational level of teachers, among others, which reflects values and choices by individual governments. This last point means that response-to-community demands are also an indicator of quality education. Floors and Ceilings. Many “minimum” indicators of quality relate to the concepts of equity and access as they are rooted in the belief that education is a fundamental right. For example, at a minimum, the Millennium Development Goals consider universal primary education as a core indicator for basic education (United Nations, 2000). This points to floors, upon which further indicators can be constructed to developed quality education goals. These floors do not specify ceilings, or ultimate or the highest goals, however. This means that international organizations such as UNESCO have helped establish the minimum acceptable levels in education, but they have not delineated the maximum or highest point at which education should be directed. This paper will look at decision-making parameters of countries that have achieved beyond the minimum: Once we have floors, how high do we construct ceilings? Once they reach the minimum, how do countries decide what indicators come next? Some international organizations have done a thorough job of noting key minimum quality indicators in education, including UNESCO, UNICEF and the OECD. These quality education indicators have structured the international community’s efforts into reliable groups of indicators for measuring minimum requirements to create the circumstances for quality (see UNESCO, 2000). If the choice of indicators were straightforward, all countries would have embraced a clear path, or step-by-step process of adding on more and more complex indicators as they passed minimum milestones, but not all nations have such a plan. All of the countries (n=34) included in this study have already reached the bare minimum level of achieving universal primary education. In fact, all have also gone beyond primary education to include taking the PISA exams aimed at 15-year-olds, meaning they have also achieved the goal of 10 years of basic education. This means that the countries considered in this study, unlike the majority of nations in the world, now focused on determining their “ceilings” and not on the “floors”. The average yearly income of individuals living in OECD nations is $19,000 (OECD, 2011) indicating that the countries considered in this study are well-off and none considered to be developing in status. This disparity of data will be discussed further in the conclusions.
- 12. Tokuhama-‐Espinosa, Rivera, Tobar, Solano, Proaño, Tirira & Merino Nov 2013 WERA Selection of Quality Indicators in Education 12 Figure 2. Household Income in OECD Nations, 2007 Source: OECD, 2011e This study sought to take into consideration all of the indicators currently used to measure quality education and understand the way different countries make choices in this field. As will be discussed in the conclusion, the decision-making process should be iterative and ever-spiraling towards better refinement of choices; there is no single or best way to choose the right indicators to measure quality, but there are steps to assure a logical process. The Current Reality The decision-making process of countries undertaking quality education evaluations has many facets. How does a country know which indicators are the best to measure “quality” in their context? This is question faced by many new governments and many experienced politicians. Some countries, as mentioned above, prioritize indicator selection based on recommendations from international organizations such as the UNICEF, UNESCO and the OECD. Others choose to measure what is economically feasible or what is easy to measure. Yet others choose to measure what they know they will do well in, in hopes of prolonging their mandates in power. Some ministers of education ask, “What are the most commonly used indicators” as if popularity were the criteria by which to choose. However frequency of use yields different data from other types of questions, such as “when in a country’s developmental history do government’s use certain indicators?” or “how is indicator choice influenced by one’s socio-economic status, political goals, or the unit of inquiry?” To put order into the government decision-
- 13. Tokuhama-‐Espinosa, Rivera, Tobar, Solano, Proaño, Tirira & Merino Nov 2013 WERA Selection of Quality Indicators in Education 13 making structure, Vos (1998) suggests that the “relevant types of information depends on what one wishes to analyze for which policy need” (p.2). That is, each case will be different. Therefore, the parameters for decision-making are more useful than a prescription suggestion or laundry list of indicators. Research Questions The main research questions in this paper are the following: How and to what extent do economic status, chosen units of analysis and cultural and historical perspective influence the choice of educational quality? To answer this question, the question is sub-divided into three parts: 1. Does the economic status of a country influence which variables are considered quality indicators? 2. How does the unit of analysis change priorities? And, 3. To what extent do cultural and historical variables influence the choice of indicators selected? Definitions “Education literature is frequently imprecise and inconsistent in the use of the terms quality, efficiency, effectiveness and equity” (Adams, 1993, p.4), which means the definition of terminology is vital for a shared understanding of concepts. The terms for this paper are in English. Where English translation was necessary, they were derived using program translators and confirmed by a second online translation source. Where there were conflicts, a third source was used. For the purpose of this paper, we will adhere to internationally agreed upon definitions for core vocabulary share by international organizations and/or academic journals. Example definitions of “quality education” There are a myriad of examples of quality education definitions, some of the most prominent mentioned below. It should be remembered that these definitions are often distinguished by those related to outputs, outcomes, process or inputs (Adams, 1993). Quality in education. Quality in education is usually bound to interpretations of the user, and often synonymous with effectiveness (Adams, 1993). In other contexts, quality is bound to a particular actor, as in student or teacher outcomes, or as in school or district performance. In other instances, quality is bound to an actor’s reputation, resources and inputs, process, content, outputs and outcomes (Adams, 1993). It is important to note that Adams (1993) identifies more than 50 different definitions of “quality education” in the literature. UNICEF (2000) According to UNICEF (2000):
- 14. Tokuhama-‐Espinosa, Rivera, Tobar, Solano, Proaño, Tirira & Merino Nov 2013 WERA Selection of Quality Indicators in Education 14 Quality education includes: Learners who are healthy, well-nourished and ready to participate and learn, and supported in learning by their families and communities; Environments that are healthy, safe, protective and gender- sensitive, and provide adequate resources and facilities; Content that is reflected in relevant curricula and materials for the acquisition of basic skills, especially in the areas of literacy, numeracy and skills for life, and knowledge in such areas as gender, health, nutrition, HIV/AIDS prevention and peace. Processes through which trained teachers use child-centrered teaching approaches in well-managed classrooms and schools and skillful assessment to facilitate learning and reduce disparities. Outcomes that encompass knowledge, skills and attitudes, and are linked to national goals for education and positive participation in society. (UNICEF, 2000, p.3) Global Monitoring Report (2005) The Global Monitoring Report (2005) summarized the various definitions of quality over the past few decades and returned to an idea agreed upon in 1990 during the World Declaration on Education for All (below) (Education For All, 2005, p.29), which essential equates quality education with access for all. Such an education is dependent on healthy, motivated students, good processes including the work of competent teachers, and strong governance. Figure 3. Education Quality Source: Education for All, 2005, p. For the purposes of this study, the following terms used throughout this study are mentioned below with a definition, which will be applied throughout in order to harmonize dialogue. Assessment.
- 15. Tokuhama-‐Espinosa, Rivera, Tobar, Solano, Proaño, Tirira & Merino Nov 2013 WERA Selection of Quality Indicators in Education 15 The systematic process of determining educational objectives, gathering, analyzing and using information about student learning outcomes to make decisions about programs, individual student progress, and/or accountability (Looney, 2009, p. 16). Culture. According to the Merriam-Webster dictionary, culture can be defined as “the beliefs, customs, arts, etc., of a particular society, group, place, or time,” and as “a way of thinking, behaving, or working that exists in a place or organization” (2013). Economic indicator. An economic indicator is a statistics that indicates the direction of an economy. These can be leasing indicators (i.e, consumer variables and buying trends) or coincident indicators (i.e. GDP, employment levels). Some examples of economic indictors includes GDP per capita, unemployment, and inflation rates (Business Dictionary.com, 2013) Efficiency. According to Vos (1998), “[t]here are two sides to efficiency in education: internal efficiency and external efficiency. The external efficiency has to do with the extent to which the educational system generates the necessary skills for a smooth running of the economy and society in a broader sense… Internal efficiency is concerned with the relationship between inputs and immediate goals (output) in education, such as the number of graduates, the quality of education and the earning capacity of graduates” (pp.10-11). Adams believes “Efficiency may be defined simply as the relation of outputs to inputs” in which this relationship is maximized (1993, p.4). Effectiveness. Closely related to efficiency, effectiveness in education is “the costs of educational inputs and processes … related to benefits,” which result in effectiveness (Adams, 1993, p.4). “Efficiency is typically seen by managers and planners as a requisite of institutions in order to maximize the use of, and to avoid the wastage of, human and other resources in the attainment of outputs and outcomes” (p.5). Equity. For the purpose of this paper, equity is defined “in terms of opportunities, distribution, or consequences (Adams, 1993, pp.5-6). For the purpose of this paper, equity in education means “fairness between distinguishable groups in terms of access to, participation in, and achievement of the educational system,” (Cobb, 1990, as cited in Adams, 1993, p.6). Evaluation.
- 16. Tokuhama-‐Espinosa, Rivera, Tobar, Solano, Proaño, Tirira & Merino Nov 2013 WERA Selection of Quality Indicators in Education 16 Evaluation is the process of gathering information to make a judgment about the quality or worth of some program or performance (NCME, 2013). In teaching and learning evaluation is “a systematic process aimed at judging the effectiveness of any teaching and learning program” (UNESCO, 2013, p. 29). The OECD states that evaluation is The systematic and objective assessment of an on-going or completed project, program or policy, its design, implementation and results. The aim is to determine the relevance and fulfillment of objectives, development efficiency, effectiveness, impact and sustainability. An evaluation should provide information that is credible and useful, enabling the incorporation of lessons learned into the decision-making process of both recipients and donors”. “Evaluation also refers to the process of determining the worth or significance of an activity, policy or program. An assessment, as systematic and objective as possible, of a planned, on-going, or completed development intervention…Note: Evaluation in some instances involves the definition of appropriate standards, the examination of performance against those standards, an assessment of actual and expected results and the identification of relevant lessons. (OECD, 2002, pp. 21-22). Good governance. Good governance is characterized by participation, transparency, accountability, rule of law, effectiveness, equity, etc. Examples of good governance can be seen when policy-makers adopt strategic orientations to identify emerging issues and develop policies that work . It is well known for its individual country surveys and reviews (OECD, 2013a). Indicator. “There are statistics that typically measure some aspects of desired educational outcomes or describe essential features of the education system. They are meant to be used by policymakers and others to assess how a school, district, states, or the nation is doing against a standard, over time, or in comparison with others (Oakes, 1986 as cited in Aschbacher, 1999, p.4). Carvalho and White (1994) remind us in a World Bank study that indicators are literally only indicative of a trend and cannot replace an in-depth analysis and evaluation. “Indicators tend to be classified depending on whether they reflect the means, the process, or the end in achieving the objective of a particular set of development policies, programs or projects” (Vos, 1998, p.3) and include input indicators [i.e., budgets, number of teachers, school buildings, teaching materials], access indicators [i.e., geographical distance to school, staying rates for different family and cultural backgrounds, direct barriers such as uniforms, books and fees], output indicators [i.e., test scores, improved enrollment rates, improved retention rates], and outcome indicators [i.e., improved employment prospects], as well as performance indicators and social indicators. In short, “an education indicator provides information about the health of the educational system,” (Kaagan & Smith, 1985, p.21).
- 17. Tokuhama-‐Espinosa, Rivera, Tobar, Solano, Proaño, Tirira & Merino Nov 2013 WERA Selection of Quality Indicators in Education 17 Inputs. According to Adams (1993, p.4), “Inputs, if limited to factors subject to policy manipulation, include characteristics of teachers, pupils, facilities, curriculum, and fiscal and other resources necessary for the maintenance or change of the educational enterprise. In a broader sense contextual influences may also be considered as inputs.” Measurement. The process of assigning a number to a person, or a person’s trait, according to specified rules. Often the rules involve using a test and counting the number of items each person answered correctly. That number represents how much of the trait the person has, and it can be compared with other information to obtain further meaning about their performance (NCME, 2013). Outputs. According to Adams (1993, p.4), “Outputs typically refer to changes in student achievement, completion rates, certification, skills, and certain attitudes and values” which are the result of inputs, such as budgetary prioritization, policy measures or other strategic planning measures. Outcomes. According to Adams (1993, p.4), “Outcomes, if distinguished from outputs, are conceptualized as the longer term consequences of education such as employment, earnings and changes overtime in attitudes, values, and behavior.” Bottani extends on this definition: “Outcomes are seen in part as reflecting general social, economic and historical conditions affecting education in each country, and partly as reflecting the combined effects of the policies, programmes, practices and educational decisions constituting schooling in each country” (Bottani, 1998, p.65). Process. According to Adams (1993, p.4), “Process is usually interpreted as the forms of interaction between teachers, students, administrators, materials and technology in educational activities.” Primary education. Education at a Glance defines primary education as the following: “Designed to provide a sound basic education in reading, writing and mathematics and a basic understanding of some other subjects. Entry age: between 5 and 7. Duration: 6 years” (2013, p.22). Pre-primary education.
- 18. Tokuhama-‐Espinosa, Rivera, Tobar, Solano, Proaño, Tirira & Merino Nov 2013 WERA Selection of Quality Indicators in Education 18 According to the OECD (2013, p.22), Pre-primary education is “The first stage of organized instruction designed to introduce very young children to the school atmosphere. Minimum entry age of 3”. Productivity The relationship between inputs and output, which can be applied to individual factors of production or collectively (The Economist, 2013). Secondary education. Secondary education is divided into two levels, according to the OECD publication, Education at a Glance (2013, p.22): Lower secondary education: Completes provision of basic education, usually in a more subject oriented way with more specialist teachers. Entry follows 6 years of primary education; duration is 3 years. In some countries, the end of this level marks the end of compulsory education. (Subcategories: 2A prepares students for continuing academic education, leading to 3A; 2A has stronger vocational focus, leading to 3B; 2C offers preparation of entering workforce) Upper secondary education: Stronger subject specialization than at lower secondary level, with teachers usually more qualified. Students typically expected to have completed 9 years of education or lower secondary schooling before entry and are generally 15 or 16 years old. Standards. A standard is a document that provides requirements, specifications, guidelines or characteristics that can be used consistently to ensure that materials, products, processes and services are fit for their purpose (UNESCO, 2013, p.57). Tertiary education. Education at a Glance (OECD, 2013, p.23) defines tertiary education in the following two categories: Tertiary-type A education: Largely theory-based programs designed to provide sufficient qualifications for entry to advanced research programs and professions with high skill requirements, such as medicine, dentistry or architecture. Duration at least 3 years full-time, though usually 4 or more years. These programs are not exclusively offered at universities; and not all programs nationally recognized as university programs fulfill the criteria to be classified as tertiary-type A. Tertiary- type A programs include second-degree programs, such as the American master’s degree. Tertiary-type B education: Programs are typically shorter than those of tertiary- type A and focus on practical, technical or occupational skills for direct entry into the labor market, although some theoretical foundations may be covered in the
- 19. Tokuhama-‐Espinosa, Rivera, Tobar, Solano, Proaño, Tirira & Merino Nov 2013 WERA Selection of Quality Indicators in Education 19 respective programs. They have a minimum duration of two years full-time equivalent at the tertiary level. Unit of Analysis. A unit of analysis describes the unit to be measured. Units can be micro to macro, as from the individual level to the national systems level. In some educational policy settings the unit may be the student (as measured through student learning outcomes, for example), the school (as measured by institutional achievement to offer equal access of some service to all members of the community, for example), the nation (e.g., the average number of years of education teachers have; average years of schooling for all age groups; average test scores, etc.). In principle, the statistical unit should be uniform, within sectors, for all countries. In practice, however, this goal is never fully achieved. One reason is that structures are different and names are different (or misleadingly similar). Another is interaction with the reporting unit. If the reporting unit is larger than the statistical unit, problems may arise for distributing the data among the appropriate classification units (OECD, 2002). Values. Values are subjective and closely liked to judgment criteria, which can be influenced by one’s surroundings. According to the Oxford Dictionary (2013), values are “principles or standards of behaviour; one’s judgment of what is important in life”. Conceptual Framework: The conceptual framework of this paper is based on a combination of Wiggins and McTighe’s (2005) Understanding By Design structure for educational planning, and four indicator decision-making frameworks between 1997 and 2012: (1) Bottani’s OECD 1998 study; (2) Cheng and Tam’s Seven Multi-models of quality in education framework (1997, 2006); (3) Sahlberg’s comparison of current versus optimal indicators (2011, 2012); and (4) Jaap Scheerens (2004; 2011) Conceptual Framework for Measuring Quality. Finally, this view applies John Hattie’s milestone research in education related to the indicators most indicative in measuring student learning outcomes. The structure for educational planning, the frameworks and Hattie’s research are explained briefly below. Backward Design Wiggins and McTighe (2005) challenge educational planners at all levels from micro, in-class lesson design to macro, state-level decision-making. They make the case that by starting with the end in mind – the final objective – then one is more likely to reach stated goals. In macro educational planning, this begins with the questions, “Why educate?” “What is education for?” or “What is the goal of formal education?” The three steps in understanding by design are to clarify objectives, decide what will be the indicators of success and how they will be measured, and then plan activities that will provide the data needed.
- 20. Tokuhama-‐Espinosa, Rivera, Tobar, Solano, Proaño, Tirira & Merino Nov 2013 WERA Selection of Quality Indicators in Education 20 Frameworks Bottani (1998) conducted a study for the OECD in which he explained what he detected as patterns in decision making by different governments as they grappled with the choices of how to organize key quality indicators in education. He notes the importance of three types of organization: conceptual, pragmatic or around policy issues. Cheng and Tam (1997) believe that the choice of quality education indicators is complex and that there is benefit to conceptualizing the process in seven different types of models which different countries will choose to adopt at different stages of their development: (1) the goals and specifications model; (2) the resources input model; (3) the process model; (4) the satisfaction model; (5) the legitimacy model; (6) the absence of problems model; and (7) the organizational learning model. Jaap Scheerens’ (2004) Conceptual Framework for Measuring Quality and his Perspectives on Educational Quality (2011) have added immensely to the discussion on indicator selection. In 2004, Scheerens suggested a vision different from Bottani and Cheng and Tam’s models in that he suggests that distinct mind frames accompany choices, which can be divided into six different ways: “the productivity view” (in which education is viewed as a process to be completed); “instrumental effectiveness view” (in which results are measured by the quality of the input received); “adaptation perspective” (in which broader, more macro philosophical educational goals are prioritized over subject-area dominance); “equity perspective” (in which the sole goal is to create equal opportunity for all); “efficiency perspective” (in which economics leads educational decision); and the “disjointed view” (in which actions are executed without a real plan). In later work, Scheerens summarized six categories, which will be discussed further in the literature review. Finally, Pasi Sahlberg of Finland has become a renowned spokesperson for education by humbly noting his country’s not-so-smooth road to its current leadership position on the global comparative stage. Sahlberg’s view is distinct from the previous models in that he unabashedly acknowledges the importance of deep thinking to produce deep thinkers. That is, without a clear—and usually time consuming—plan, countries cannot progress. Sahlberg suggests there is a chronology towards educational maturity in three stages. First, there must be a profound “rethinking the theoretical and methodological foundations of schooling”. Once this is achieved and priorities are set, one can move on to “improving through networking and self-regulated change” which involves learning from others. When a country has managed to decide what it is in comparison with others and to regulate its own behavior, it can move on to the final stage, which is to develop “efficiency of structures and administration” (Sahlberg, 2011, p.9). These four frameworks serve as the theoretical backdrop against which the information was analyzed and conclusions drawn. They will be explained in more detailed in the literature review. John Hattie’s Work
- 21. Tokuhama-‐Espinosa, Rivera, Tobar, Solano, Proaño, Tirira & Merino Nov 2013 WERA Selection of Quality Indicators in Education 21 John Hattie, director of the Education Research Institute at the University of Melbourne, Australia, and honorary professor at the University of Auckland, completed a 15-year comparison of over 50,000 studies involving more than 240 million students from around the world to determine which factors impact achievement (Hattie, 2012). He devised a methodological scheme in which he could compare the effect sizes of different interventions and came to the conclusion that almost everything we do to improve learning works, but that some things work better than others. Hattie’s research shows that after a student’s own self-perception as a learner, the role of the teacher and good teaching have the greatest impacts on students learning outcomes. His work shows that while budgets, infrastructure, curriculum choices, governance issues and school size can influence learning they have less of an impact than the teacher as a personality or teaching. This study uses Hattie’s work as the backdrop against which quality education indicators should be chosen, emphasizing the role of the teacher in quality education processes. Significance of the Study The significance of this study is that it calls attention to the variety of ways in which the term “quality education” is defined around the world and highlights both the implications as well as types of choices governments must make in order to identify the correct combination of indicators right for them. It is suggested that one way to work through the difficult choice of determining key indicators can be executed via “backward design”: Identify desired results, clarify how this will be evaluated, then conduct activities. It is hoped that this paper can serve as an aid to governments, and individual institutions to improve their evaluation systems through methodological responses that help reveal their priorities and prioritize indicators that match their cultural, economic, historic and reality backgrounds. While there is no perfect group of indicators for all, there can be improved choices of indicators for each situation. We now turn to the literature review, which first considers all of the currently used indicators by the OECD members, and then a summary of the framework decision- making models suggested in the conceptual framework.
- 22. Tokuhama-‐Espinosa, Rivera, Tobar, Solano, Proaño, Tirira & Merino Nov 2013 WERA Selection of Quality Indicators in Education 22 Literature Review The literature review began by considering official documents from the United Nations (UNESCO, UNICEF), OECD, World Bank, International Development Bank, and dozens of private and NGO studies, including those from universities. Only official documents and country webpages were used to compile data for the indicator list. Peer- review journals, international comparative studies, university studies and NGO research were also considered in the literature review, as were evaluations of quality education indicator frameworks by individuals at reputable organizations. All of the following sources were considered in the analysis: Aga Khan Foundation (AKF) Annenberg Institute for School Reform at Brown University Canadian Education Quality and Accountability Office Center on International Education Benchmarking, NCEE Education International, Brussels, Belgium European Commission on Educational and Culture Institute for International Research European Network of Educational Councils European Trade Union Committee for Education Gates Foundation INDES Inter-American Development Bank International Bank for Reconstruction and Development (IBRD or World Bank) International Institute for Educational Planning International Working Group on Education, UNESCO Organisation for Economic Cultural Development National Center for Educational Statistics (U.S.) National Association for the Education of Young Children, NAEYC Save The Children Swedish International Development Cooperation Agency (Sida) United Nations Educational, Scientific and Cultural Organization (UNESCO) United Nations; Children’s Fund (UNICEF) United States Agency for International Development (USAID) Themes There are three primary themes in the Literature Review: (1) Indicator categories (based on this review, eleven major categories of quality education indicators were identified around which all countries base their evaluation work). (2) Frameworks for
- 23. Tokuhama-‐Espinosa, Rivera, Tobar, Solano, Proaño, Tirira & Merino Nov 2013 WERA Selection of Quality Indicators in Education 23 organizing indicators; and (3) John Hattie’s meta-analysis of 900+ meta analyses that influence student learning outcomes. Indicator Categories: How Quality Education is Measured Upon review of Bottani’s (1998) previous categorization of quality education indicators (1998) and consideration of OECD publications from 2000-2013, the authors sorted the indicators into eleven main categories, nine of which can be influenced by direct government policies, and two of which explain the circumstances within which policy is made. The nine policy areas are: (a) Access or Coverage; (b) Equality and Equity; (c) Retention and Completion (Staying rates); (d) Standards; (e) Academic Achievement; (f) Teachers and Teaching; (g) Evaluation; (h) Finance and; (i) Governance. The two circumstance categories are (i) Family and Community and (j) Context (Culture, Legal system and Demographics). Each category and its corresponding indicators are explained below. Category 1: Access or Coverage “Access” or “coverage” is a macro indicator that analyzes the total number of students enrolled in distinct levels of education (preschool through university level). Access can also be defined as the availability of students to resources, such as technology, or to special assistance, as in multilingual education or special needs institutions or programs. In some countries, access is also measured by the total number of educational institutions available to meet demographic demands, as in the total amount of schools accessible to rural populations. Indicators in the Coverage and Access category are divided by level of education: 1. Preschool access 2. Primary school access 3. Lower and Upper Secondary school access 4. Tertiary education access 5. Vocational education access 6. Technology access 7. Multilingual education access 8. Special needs education access (learning) All 34 OECD nations researched here use access indicators as a measurement of quality, and do so at all education levels (preschool, primary, secondary, tertiary). Not all countries measured access to available resources, however. While not all of the official documents from these countries showed data through 2013, they have all measured access indicators at some point over the past five years. A great majority of the countries report “compulsory education” figures in addition to different levels, combining figures from primary through secondary to reach the obligatory average of 10 years found in OECD countries, from age 5 to age 15. Access to compulsory education.
- 24. Tokuhama-‐Espinosa, Rivera, Tobar, Solano, Proaño, Tirira & Merino Nov 2013 WERA Selection of Quality Indicators in Education 24 Compulsory education has become virtually universal in OECD countries (OECD, 2013a). According to OECD reports, “…between the ages of 5 and 14 in all OECD and other G20 countries, enrolment rates are above 90%; and in all countries except Chile, Poland, the Russian Federation and Turkey, the rates in 2009 were higher than 95%” (OECD, 2011, p.294). Compulsory education is regulated by each individual country’s laws and can range from 14 years of age in Turkey to 18 years of age in The Netherlands, Hungary, and Portugal. Some countries allow for flexible access to school and completion rates are estimated at 25-years of age (as in Iceland, see Heckmann & Marin, 2013c; OECD 2012b). Figure 4. Last Year (Age) of Compulsory Education in OECD Countries Source: OECD, 2012k Despite the compulsory nature of minimum levels, not all countries achieve their objectives. In Germany, 84.5% of the population complies with the obligatory schooling minimum (OECD, 2012i), which is 4- through 18-years-old (OECD, 2013x). The United Kingdom achieves 100% compliances with compulsory education (OECD, 2013a), which is through age 16. Globally, OECD countries, manage a completion rate of 100% for 10- years compulsory education (OECD, 2013x), through age 15. 17 15 18 17 18 15 16 16 16 16 18 15 18 16 16 17 16 15 14 15 15 18 16 16 16 18 16 14 16 16 15 14 16 17 0 2 4 6 8 10 12 14 16 18 20 Australia Austria Belgium Canada Chile Czech Republic Denmark Estonia Finland France Germany Greece Hungary Iceland Ireland Israel Italy Japan Korea Luxembourg Mexico Netherlands New Zealand Norway Poland Portugal Slovak Republic Slovenia Spain Sweden Switzerland Turkey United Kingdom United States Last Year of Compulsory Education
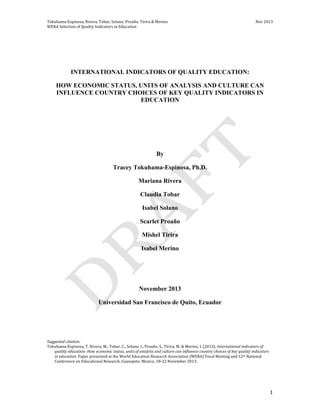
- 25. Tokuhama-‐Espinosa, Rivera, Tobar, Solano, Proaño, Tirira & Merino Nov 2013 WERA Selection of Quality Indicators in Education 25 Figure 5. Attendance, Compulsory Education in OECD Countries, 2012 Source: OECD 2012l Access to Education at the Preschool Level “Preschool” education means anything before regular primary school, which therefore includes any schooling before the average primary start age of five-years-old. In some countries this can be as early as three months of age while in others this is limited to age three. Preschool education is not obligatory in all countries, though there is a broadening movement for a minimum five-years of age start in some countries such as Australia, Slovenia and Greece (OECD, 2013x). Low preschool rates can be found in many countries, which encourage homecare in the early years before the primary school years. For example, in some countries like Switzerland compulsory education begins in primary school, and just 42% of preschool age students attend preschool programs as most prefer to stay at home with their mothers. In Sweden they believe that early years formation is the role of the home (Ministry of Education and Science of Sweden, 1999), meaning that not only availability of services influence access but values do so as well. Different countries respond to the importance of early years formation in different ways. In Luxembourg, for example, child protection laws stipulate that the best place for early childhood formation is in the home, and therefore permit that one of the parents stays at home with the child until he is at least three-years-old, explaining in part why only 16% of children are in preschool services (Ministry of National Education and Vocational Luxemburg, 2011). A similar trend can be found in Finland as well (Ministry of Education Finland, 2009) in which many parents decide to stay at home despite the offer of free, high quality preschool. In other countries, such as Mexico, parents indicate that “tradition” encourages the mother to stay at home until the child is at least three-years-old (Secretaría de Educación Pública, Mexico, 2010). In yet other countries, such as the United States, parents report that they do not have the luxury of staying at home as a two-family income is needed to maintain a certain level of lifestyle (US Department of Commerce Economics and Statistics Administration, 2010). In a contrasting example, however, reflecting a global trend, in Sweden there is a 96% compliance rate for preschool education in which the curriculum includes values and 0% 20% 40% 60% 80% 100% Australia Austria Belgium Canada Czech Denmark Estonia Finland France Germany Greece Hungary Iceland Ireland Israel Italy Korea Luxembourg Mexico Netherlands New Zealand Norway Poland Portugal Slovenia Spain Sweden Switzerland Turkey United United States Attendance, compulsory education in OECD countries reporting data, 2012
- 26. Tokuhama-‐Espinosa, Rivera, Tobar, Solano, Proaño, Tirira & Merino Nov 2013 WERA Selection of Quality Indicators in Education 26 social skills development (Lalancette & Marin, 2013f), indicating that different countries respond to values formation in distinct ways for different reasons. Figure 6. Enrollment in Pre-Primary 2010 Source: OECD, 2012k To consolidate data in a single format, OECD reports were used to compare access and attendance at the preschool level at age four. Attendance at the preschool level in OECD countries ranges from 17% in Turkey to 100% attendance in France (OECD 2012j), independent of starting age.
- 27. Tokuhama-‐Espinosa, Rivera, Tobar, Solano, Proaño, Tirira & Merino Nov 2013 WERA Selection of Quality Indicators in Education 27 Figure 7. Pre-Primary Attendance in OECD countries Source: OECD, 2012j Access to Education at Primary Level Primary school education is generally defined as starting at five-years of age (OECD, 2013a) by the countries in this study. Primary school education in many countries is considered the first six years of obligatory education, while secondary is considered the next six years. As the primary years include compulsory education, it is both free and obligatory in all of the countries studied here. It is not surprising to find that all of the OECD countries reviewed here have 100% achievement of primary school education. As a minimum level recommendation, UNICEF, the OECD, OEI and other organizations consider basic primary school education a fundamental indicator of access. Access to Education at Secondary Level Secondary education, for the purpose of this paper, is considered the second six years of education after primary school. In some countries all six years are compulsory (Holland, Hungary and Portugal, for example), but in others, only the first four of the six are obligatory (as in Japan, Mexico, Switzerland and Germany). All OECD nations report data for compulsory education, as noted above, but not for all years of secondary education. Secondary education is divided into lower secondary, which all countries reach almost 100% completion, and upper secondary, for which only about 63% (of the reporting 23 OECD member countries reporting), graduate prepared for tertiary type A (university) education. In all OECD countries there is an average of between 90-92% of age-appropriate students enrolling in upper secondary school, and approximately 70% completion rates at the same level (Cuadra & Moreno, 2005). 52% 85% 98% 47% 77% 85% 98% 90% 56% 100% 95% 53% 93% 97% 67% 85% 97% 97% 83% 97% 98% 98% 96% 97% 59% 85% 73% 87% 99% 93% 42% 17% 97% 69% 0% 20% 40% 60% 80% 100% Australia Austria Belgium Canada Chile Czech Denmark Estonia Finland France Germany Greece Hungary Iceland Ireland Israel Italy Japan Korea Luxembourg Mexico Netherlands New Zealand Norway Poland Portugal Slovak Slovenia Spain Sweden Switzerland Turkey United United States Pre-‐primary school attendance
- 28. Tokuhama-‐Espinosa, Rivera, Tobar, Solano, Proaño, Tirira & Merino Nov 2013 WERA Selection of Quality Indicators in Education 28 Figure 8. Total Net and Total Gross Enrollment Rates for Upper Secondary Education in OECD Nations, 2004 Source: Sahlberg, 2007, p.4 Historically there have been social class divisions separating people who should follow academic paths from those who should follow basic labor paths, which still has residual effects today. Several countries continue to divide students in late primary or lower secondary based on their potential to study at university or not. In Iceland, for example, while the gap is narrowing, the population continues to be characterized by those who are “laborers” and those who are “academics,” and as a result, upper secondary attainment is low by international standards. Only 71% of 25-64 year-olds and 75% of the younger generation (25-34 year-olds) in Iceland hold at least an upper secondary qualification, in comparison with the OECD average of 75% and 82% respectively (Heckmann & Marin, 2013c). On the other hand in Ireland, if current patterns of graduation continue, 89% of young people in Ireland today will obtain an upper secondary qualification in the course of their lifetimes (Castaneda Valle & Heckmann, 2013), a general education level higher than at any other time in the history of the nation. Access to Education at Tertiary Level Tertiary level education is generally expected to be formal education obtained after secondary school, including university study as well as technical training programs. This means that the percentages reported included are of the total number of age- appropriate populations, divided between type a (university) and type B (technical
- 29. Tokuhama-‐Espinosa, Rivera, Tobar, Solano, Proaño, Tirira & Merino Nov 2013 WERA Selection of Quality Indicators in Education 29 degrees). There was comparative data available on tertiary education levels for all OECD nations included in this study (OECD, 2012k). In the OECD member countries, access to tertiary level education depends on successful secondary level completion. Figures for upper secondary completion and entry to tertiary education are noted in the graph below. Figure 9. Access to Tertiary (Type B) Technical Education and Tertiary Type A University Education Source: OECD, 2013a, p.292
- 30. Tokuhama-‐Espinosa, Rivera, Tobar, Solano, Proaño, Tirira & Merino Nov 2013 WERA Selection of Quality Indicators in Education 30 Figure 10. Access to tertiary-type A education, 2011 Source: OECD, 2013a, p.47 Some countries allow far greater access to education, such as Australia and Portugal who admit nearly 100% of the students seeking admissions, but which only graduate 81% and 67% respectively. Among all OECD nations reporting data (n=23), the average entry rates are 60% of the population, and 40% of those graduate (for a completion rate of 70%).1 The importance of tertiary education is being led globally, in great part, by members of the OECD, who have begun passing legislation to emphasize the role of higher education on economic well-being. For example, Estonia (European Commission, 2012) has recently made it an issue of national legislation to ensure the internationally competitive quality of higher education offered in Estonia; to ensure that both study and research activities are better targeted towards the needs of the development of the Estonian economy and society; to ensure a capacity of higher education study that reflects the needs of the Estonian society, taking into account both the preferences of students as well as the needs of the labor market; to develop an effective higher education structure through ensuring that educational institutions offer the fields of study that take into account the needs and resources of Estonia; to ensure that Estonian-language 1 It is important to note that the OECD divides tertiary education into types: Type-A is mainly universities (i.e. largely theoretical university-based programs) and Type-B is shorter, more vocational programs. While OECD countries have noted a small decline in Type-A applicants, there has been an increase in Type-B applications, for an overall gain. For example, the proportion of young adults in Hungary expected to enter tertiary Type-A education declined by 3 percentage points between 2000 and 2011, but this was counterbalanced by an increase of 16 percentage points in entry rates into Type-B programs during the same period (OECD, 2013).
- 31. Tokuhama-‐Espinosa, Rivera, Tobar, Solano, Proaño, Tirira & Merino Nov 2013 WERA Selection of Quality Indicators in Education 31 higher education studies continue and develop within the European open education space. (Ministry of Education Estonia, 2013) Access to tertiary education is far less regular than other levels of education and can include populations who come directly from secondary school well into old age, meaning much of the data is not confined to a specific age range. According to the OECD’s Education at a Glance (2013a), “Entry rates into tertiary-type A programmes are still higher for women (67%) than for men (53%) on average across OECD countries,” (OECD, 2013a, p.291) and that “it is estimated that an average of 19% of today’s young adults (20% women and 18% of men) will enter tertiary type B (shorter and largely vocational) programmes over the lifetimes” (p.291). Access to Education at Technical Level Technical education can range from post-secondary education that leads to a non- academic degrees (as in a car mechanic, electrical technician, beautician, etc.), to extra courses taken in order to improve job options (as in a computer certificate, safety certification programs or language levels). Most technical programs are considered “vocational education” as they refine skill sets for specific work areas. For example, Norway presents a variety of offerings for Vocational Education Programs (Ministry of Education and Research Norway, 2013): • Program for Building and Construction • Program for Design, Arts and Crafts • Program for Electricity and Electronics • Program for Health and Social Care • Program for Media and Communication • Program for Agriculture, Fishing and Forestry • Program for Restaurant and Food Processing • Program for Service and Transport • Program for Technical and Industrial Production. (Ministry of Education and Research Norway, 2013) Access to Technology Another sub-indicator in Access and Coverage includes access to technology. Technology is a broad term used to encompass all digital media, the Internet, as well as interactive learning tools. Of the 34 countries researched in this paper, all countries identified technology as a key indicator in quality education.2 2 Center on International Education Benchmarking Canada 2012; Department of Education Australia, 2013; Department of Education UK, 2012; Department of Education of United States of America, 2013; Department of Education, Employment and Workplace Relations of Austria, 2013; Department of education and skills Ireland, 2013; Federal Ministry for Education, the Arts and Culture of Austria, 2012; Federal Ministry of Education and Research of Germany, 2013; Ministerio de Educación, Cultura y Deporte de España, 2013; Ministerio de Educación República de Chile, 2013; Ministry of Education Estonia, 2013; Ministry of Education Greece, 2013; Ministry of Education Hungary, 2010; Ministry of Education Netherlands, 2013; Ministry of Education New Zealand, 2013;
- 32. Tokuhama-‐Espinosa, Rivera, Tobar, Solano, Proaño, Tirira & Merino Nov 2013 WERA Selection of Quality Indicators in Education 32 Information and Communication Technology is used in education for supporting students’ learning or for development of competences, in other words for helping to reach the goals of education. The quality of learning depends on how ICT is used in learning, (Meisalo & Lavonen, 2010). Ministries and departments of education in countries as diverse as New Zealand, Norway, Luxembourg, the United States and Mexico consider that access and training in technology to be vital elements of quality education. Some schools measure this indicator by identifying how the level of Internet access in schools. Iceland has a widespread access to technology at their primary level, reaching a 99% of Internet use in the classrooms (UNESCO, 2011f), for example. Some governments are investing in studying the implications of technology in schools and making recommendations about appropriate use, as in the Danish study on digital well-being (Ministry of Education and Culture Denmark, 2013). Others measure support tools that leverage technology for improved learning opportunities. For example, the Chilean government runs an educational portal called Yo Estudio, in which they upload educational resources to reinforce classroom study (Ministerio de Educación, Chile, 2013). Other OECD members are using innovative techniques to apply technology for improved subject area learning, including foreign languages (for an example, see Ministry of Education Estonia, 2013). Finally, many OECD countries recognize the dynamic and ever-changing face of technology in the classrooms and are considering global national plans to define its best use in schools. For example, the Finnish government is studying a development plan for education research to consider what role digital media should plan in education: “According to the plan, materials and modes of action which promote media education and literacy will be developed, measures will be taken to ensure equal access to media education and teachers' competencies in media education will be upgraded ” (Ministry of Education Finland, 2009). Access to Multilingual Education There are more than 4,500 languages in the world (Tokuhama-Espinosa, 2008). In the OECD nations, there are a total of 26 official languages. Despite the variety, most national schooling systems offer education in just one main language, with second and third language options in the upper grades with a few exceptions (see Switzerland, Luxembourg, Ireland, Israel for examples). The variety of languages spoken in the home as compared with school offerings is dramatic and therefore most OECD nations offer some form of multilingual or bilingual education support, especially those in Europe. Access to good education is dependent on language sufficiency (Center for Research on Ministry of Education Republic of Korea, 2008; Ministry of Education Turkey, 2013; Ministry of Education and Culture Denmark, 2013; Ministry of Education and Culture Finland, 2009; Ministry of Education and Culture of the State of Israel, 2013; Ministry of Education, Culture, Sports, Science and Technology Japan, 2013; Ministry of Education and Research Sweden, 2010; Ministry of Education and Research Norway, 2013; Ministry of Education and Science Portugal, 2013; Ministry of Education, Science and Culture Iceland, 2008; Ministry of Education, Science and Sports, Republic of Slovenia, 2013; Ministry of Education, University and Research Italy, 2009; Ministry of National Education and Professional Development of Luxemburg, 2013; Ministry of National Education of France, 2013; Ministry of National Education of Poland, 2011; OECD, 2013y; OECD, 2013z; Secretaría de Educación Pública de México, 2010; The Swiss Conference of Cantonal Ministers of Education, 2012.