SlideShare a Scribd company logo
1 of 332
““DEMYSTIFYING CLINICALDEMYSTIFYING CLINICAL
ELECTROCARDIOGRAPHY”ELECTROCARDIOGRAPHY”
…… HHighlightingighlighting Myocardial Ischemia, Injury & Infarct
©Kristy Molnar, Partner, Critical Care Consultants, 2013©Kristy Molnar, Partner, Critical Care Consultants, 2013
PHILIPS HEALTHCARE
Patient Care & Clinical Informatics
Continuing Education for
Healthcare Professionals
EDUCATIONALEDUCATIONAL
SERVICESSERVICES
© Copyright, 2013
Critical Care Consultants
Kristy Molnar
Partner, Nursing Education Consultant
CRITICAL CARE CONSULTANTS
Demystifying ClinicalDemystifying Clinical
Electrocardiography …Electrocardiography …
Goals of ECG MonitoringGoals of ECG Monitoring
To detect and document cardiacTo detect and document cardiac
arrhythmiasarrhythmias
To detect and document ST changes andTo detect and document ST changes and
evolving ischemiaevolving ischemia
To detect prolonged QT interval syndromeTo detect prolonged QT interval syndrome
To evaluate the effectiveness of treatmentTo evaluate the effectiveness of treatment
We’ve come a LONG Way!We’ve come a LONG Way!
http://www.ecglibrary.com/ecghist.html
Goals of ECG MonitoringGoals of ECG Monitoring
In order to meet the goals of ECG
monitoring, it should ideally be continuous
and should reflect a minimum of 12 leads
simultaneously.
Ideally 16 leads
Goals of ECG MonitoringGoals of ECG Monitoring
Comprehensive arrhythmia diagnosis often
requires a MULTI-LEAD perspective,
Ischemia detection can only occur IF the
associated leads are viewed,
Transient events of diagnostic/therapeutic
importance may not persist LONG
ENOUGH to allow documentation with a
standand ECG.
Patient Monitoring Survey-Patient Monitoring Survey-
THEN vs NOWTHEN vs NOW
Independent survey at AACN’s Advanced
Practice Institute Conference (1998)
N=400 (Acute care Nurses and Clinical
Specialists)
69% of respondents did not have the
clinical capability
31% had the ability to monitor continuous
12-Lead ECG.
Continuous ECG MonitoringContinuous ECG Monitoring
Those using continuous 12-Lead ECG
monitoring indicated that their primary
reasons are for:
– assessment of cardiac condition
– changes in condition
– differentiation of abnormal or irregular
rhythms.
Continuous ECG MonitoringContinuous ECG Monitoring
The reasons for infrequent use included
lack of training, “not a requirement”, and
no perceived need.
66% of participants responded that there
were barriers to continuous 12-lead
monitoring … number of electrodes … lack
of training was the primary barrier
The IdealThe Ideal
Monitoring Situation:Monitoring Situation:
Continuous, real-time
Multi-lead perspective
Sensitive and specific
Convenient and stable electrode positions
Easy to landmark (consistent, quick and
reproducible)
Patient comfort and low interference with
clinical procedures.
2004 Practice Standards …2004 Practice Standards …
Practice Standards,Practice Standards,
the beginningthe beginning
Source: Drew, BJ et al Circulation, 2004
October 26; 110(17):2721-46.
Full text article: www.circ.ahajournals.org
Guidelines: www.guideline.gov
2009 AHA, ACC, HRS Practice Standards2009 AHA, ACC, HRS Practice Standards
Recommendations for the Standardization and Interpretation of the
Electrocardiogram – Part IV (Feb. 19, 2009)
Learning Needs? …Learning Needs? …
it appears so!it appears so!
Ongoing Investigations …Ongoing Investigations …
20132013
Review of ElectrocardiographicReview of Electrocardiographic
PrinciplesPrinciples
Functional Anatomy
& Physiology
Electrical SystemElectrical System
The heart has an intrinsic electrical
system that allows for the
origination and transmission of
an electrical impulse.
– The electrical stimulus (initiating
factor)
– Depolarization (proliferating
factor)
Cardiac Cell PropertiesCardiac Cell Properties
Automaticity
Excitability
Conductivity
Contractility
Electrical Conduction SystemElectrical Conduction System
SA Node
“Internodal Pathways”
AV Junction
Bundle of His
Bundle Branches
Purkinje Fibres
Sinoatrial (SA) NodeSinoatrial (SA) Node
Right atrium (superior, right orientation)
Close to the superior vena cava
Specialized piece of conduction tissue with
the property of automaticity.
60-100 bpm, fastest rate of automaticity
normally, thereby setting the pace of the
heart.
The SA Node -The SA Node -
Automaticity & ExcitabiltyAutomaticity & Excitabilty
 Innervated by the autonomic nervous system.
 Sympathetic stimulation can accelerate the SA
node up to a rate of 150-160/min.
 Parasympathetic stimulation can slow the heart
rate to less than 60/min.
 If the heart was separated from the body’s nervous
system, the SA node could still initiate its own
impulses.
ConductivityConductivity
Once an electrical stimulus is originated, it
spreads throughout the remainder of the
conduction system and the heart muscle.
ConductivityConductivity
When the impulse is released from the SA
node, it travels throughout the atria, causing
them to depolarize and subsequently,
contract.
The depolarization wave arrives at the AV
node, which is located on the inferior-right
side of the intra-atrial septum.
ConductivityConductivity
The wave is delayed there for
approximately .10 seconds before arriving
at the Bundle of His … allowing for atrial
contraction to precede ventricular
contraction (contributing to adequate
ventricular filling, an additional 20-30% of
preload).
AV JunctionAV Junction
Under normal conditions, the AV junctional
tissue is not the pacemaker of the heart –
since it has a lower rate of automaticity than
the SA Node.
The rate of impulse formation in the AV
junctional tissue is normally 40-60/min.
A-V ConductionA-V Conduction
The cardiac impulse spreads to the thin
bundle of “threads” known as the bundle of
His
The bundle of His connects the AV junction
to the bundle branches (located in the right
side of the intra-atrial septum just above the
ventricles)
Intraventricular ConductionIntraventricular Conduction
The conduction structures in the ventricles
consist of the conduction structures below
the bundle of His, also known as the His-
Purkinje network.
The impulse passes down the Left and
Right bundle branches in a sequential
fashion.
Intraventricular ConductionIntraventricular Conduction
Bundle Branch ConductionBundle Branch Conduction
Repolarization is faster in the Left Bundle
Branch, therefore it is ready to conduct
earlier than the Right Bundle Branch.
Conduction of the impulse is normally Left
before Right.
Left vs. Right Bundle BranchLeft vs. Right Bundle Branch
The Right bundle is a slender fascicle that
runs along the right side of the
intraventicular septum and supplies the
electrical impulses to the Right ventricle.
The Left bundle supplies the electrical
impulses to the Left ventricle. It runs along
the left side of the intraventricular septum
and divides almost immediately into an
anterior and posterior division (fascicle).
Divisions of the Left BundleDivisions of the Left Bundle
Anterior Fascicle – much longer and
thinner of the two and supplies the anterior
and superior portions of the Left Ventricle
with electrical impulses
Posterior Fascicle – shorter and thicker
and supplies the posterior and inferior
portions of the Left Ventricle with electrical
impulses.
Purkinje Network (Fibers)Purkinje Network (Fibers)
The bundle branches terminate in a network
of fibers that are located in both the left and
right ventricular walls.
The impulse travels into the Purkinje Fibers
and cause ventricular depolarization (and
subsequently, contraction)
What is anWhat is an
Electrocardiogram?Electrocardiogram?
Electrocardiogram (ECG)Electrocardiogram (ECG)
Depolarization and subsequent
Repolarization spreading throughout the
heart can be recorded (on paper or
electronically)
Recorded process is called the
electrocardiogram.
Changes in cellular polarity (charges)
occurring during depolarization and
repolarization produces deflections on the
recording, forming an “ECG complex”.
ElectrocardiogramElectrocardiogram
““P,Q,R,S,T & U”P,Q,R,S,T & U”
Waves, Complexes, Intervals & Segments
Waves and ComplexesWaves and Complexes
Deviations from isoelectric
Positive or Negative?
May be Biphasic, Notched or “Flattened”
A complex may contain multiple waves
P waveP wave
Atrial depolarization
P wave = Atrial Depolarization
Upright and slightly rounded
< 2.5 mm amplitude; 2.5 small squares (.10
sec) duration; not notched or peaked
Ta wave (Repolarization) normally not seen
– coincides with QRS … opposite polarity
to P wave
QRS ComplexQRS Complex
Wave of depolarization reaches
the ventricular myocardium via
the Purkinje fibres
Ventricular depolarization
Represented by the “QRS”
complex
Morphology of QRSMorphology of QRS
Complexes – “Rules”Complexes – “Rules”
QRS may be composed of a Q wave, R
wave and an S wave, or various
combinations
Positive versus Negative deflections?
R is always positive
Q and S are always negative
Q must precede an R
S must follow an R
Morphology of QRSMorphology of QRS
Complexes – “Questions”Complexes – “Questions”
R wave?
Q wave or a q wave?
S wave?
QS complex or a pathological Q?
RsR1
and other configurations?
Examples of QRS ComplexesExamples of QRS Complexes
Changes in R waveChanges in R wave
or a new Q wave?or a new Q wave?
R wave changes can be clinically
significant in an acute situation (conduction
abnormality or decrease in depolarization
forces) … CAUTION – Lead Placement &
Filters
What about the development of a new Q
wave?
T waveT wave
Ventricular repolarization is
represented by the T wave
Normally upright and slightly
rounded
Same polarity as mean QRS
vector
Should not exceed 1/3-1/4 of the
total QRS height
U waveU wave
Sometimes seen after a T wave
Thought to relate to events of later
repolarization of the ventricles
Same polarity as the T wave
Intervals and SegmentsIntervals and Segments
Intervals contain waves
Segments are between the waves
PR IntervalPR Interval
From the beginning of the P
wave to the beginning of the
QRS complex.
Represents depolarization of the
atria and the spread of the
depolarization wave up to and
including the Purkinje fibres
His Bundle ElectrocardiogramHis Bundle Electrocardiogram
PR SegmentPR Segment
Represents the period of
time between the P wave
and the subsequent QRS
complex.
This should be isoelectric
? PR sagging … atrial
repolarization
abnormalities
QRS IntervalQRS Interval
 Should be less than .
10 sec in duration
 Duration of .10 or >
should be suspect
 R-wave should not be
slanted or slurred
 No notching of R or S
Intervals and Segments –Intervals and Segments –
VATVAT
 Ventricular Activation Time (VAT)
 Beginning of the QRS to the peak of the R wave
(or R1
)
 Time necessary for the depolarization wave to
travel from the endocardium to the epicardium
 Time longer for LV than RV due to relative
muscle mass
 Earlier & more sensitive indicator than a global
increase in QRS duration
Ventricular Activation TimeVentricular Activation Time
ST SegmentST Segment
From the end of the QRS complex (at
junction point) to the onset of the ascending
limb of the T wave
Should be isoelectric … look for depression
or elevation
ST SegmentST Segment
Sensitive indicator of myocardial ischemia or injury!!
QT IntervalQT Interval
The time from the beginning of the QRS
complex to the end of the T wave
Represents both ventricular depolarization
and repolarization
Prolongation increases the risk of
significant dysrhythmias
QTc an important calculation and ongoing
assessment criteria
QT IntervalQT Interval
QT/QTc Interval MonitoringQT/QTc Interval Monitoring
Who, What, When, Where, Why??
Importance – and challenge –Importance – and challenge –
of QT monitoringof QT monitoring
QT prolongation can indicate a risk of severe
arrhythmias, torsades de pointes, and sudden
cardiac death.
Significance of QTcSignificance of QTc
MonitoringMonitoring
Importance – and challenge –Importance – and challenge –
of QT monitoringof QT monitoring
A growing number of anti-arrhythmic, anti-
psychotic, and antibiotic medications can
cause QT prolongation
A combination of variables can put your
patient at risk.
Increased Risk for TorsadesIncreased Risk for Torsades
de Pointesde Pointes
QT prolonging drugs (this list is LONG)
Females
Older Patients
Bradycardia
Impaired LV function (ischemia, LV
hypertrophy)
Hypokalemia
Hypomagnesemia
QT and QTcQT and QTc
The QT has an inverse relationship to HR.
QT = QTc at a HR of 60 bpm only
Heart rate corrected QT interval is
abbreviated as QTc
Correction formulas, including the Bazett
and Fridericia, are population based & may
not be representative for a particular patient
Drugs may also change the relationship
between QT and HR
Normal QTc values?Normal QTc values?
Regardless of the 4 correction formulas
used, a QTc of < 460 ms in women and <
460 ms in men is considered normal.
Clinical Guidelines suggest that Bazett and
Fridericia formulas be included in all drug
study submissions. Philips defaults to
Bazett, but the configuration supports both.
CompatibilityCompatibility
Continuous QT/QTc measurement is part of
the Philips ST/Arrhythmia algorithm
Available on all IntelliVue Patient
Monitors, Information Centre and
Telemetry Systems.
3-Lead, 5-Lead, 6-Lead, EASI-derived 12-
Lead & 12-Lead systems
““Normal” ECG WaveformNormal” ECG Waveform
Understanding MonitoringUnderstanding Monitoring
Principles and ConceptsPrinciples and Concepts
Vectors, Leads, Polarity and
Deflections …
How are they all related?
Recording of Electrical ForcesRecording of Electrical Forces
– The Lead Concept– The Lead Concept
A lead is an electrical system to record
electrical activity
Multiple Leads are used in cardiac
monitoring and ECG recording systems
A lead is composed on a negative and a
positive pole
Sense the direction and magnitude of
electrical forces
Recording of Electrical ForcesRecording of Electrical Forces
– The Lead Concept– The Lead Concept
Record surface information from different
regions (or walls) of the myocardium.
The positive pole on any respective lead is
the “sensing electrode”
It records electrical activity according to its
perspective only (narrow and limited view)
Recording of Electrical ForcesRecording of Electrical Forces
– The Lead Concept– The Lead Concept
Electrical forces traveling TOWARD a
positive pole, will be recorded as a
POSITIVE (upright) deflection.
Forces traveling AWAY FROM the leads
positive pole (toward it’s negative pole) will
be recorded as a NEGATIVE (downwards)
deflection.
The Positive Electrode’s ViewThe Positive Electrode’s View
TOWARD =
POSITIVE
DEFLECTION
AWAY =
NEGATIVE
DEFLECTION
Planes of the HeartPlanes of the Heart
Frontal
Horizontal
Sagittal
Frontal PlaneFrontal Plane
Superior
Inferior
LeftRight
The 6 Frontal Plane LeadsThe 6 Frontal Plane Leads
Lead I
Lead II
Lead III
aVR
aVL
aVF
Horizontal PlaneHorizontal Plane
LeftRight Anterior
Posterior
The Horizontal Plane LeadsThe Horizontal Plane Leads
 V1
 V2
 V3
 V4
 V5
 V6
The Horizontal Plane LeadsThe Horizontal Plane Leads
 (V7)
 (V8)
 (V9)
 V1R
 V2R
 V3R
 V4R
 V5R
 V6R
(Sagittal Plane)(Sagittal Plane)
RightLeft
Posterior
Anterior
Standard 12 LeadStandard 12 Lead
2D - Frontal and Horizontal Plane Views
Bipolar LeadsBipolar Leads
Each lead has two physical poles, a positive
pole and a negative pole
Lead I, II and III
(also referred to as limb leads or extremity
leads, because of their placement on the
body)
Einthoven’s Triangle
Einthoven’s 1st ECG MachineEinthoven’s 1st ECG Machine
1896
1912
Leads I, II and III
form the equilateral “Einthoven’s Triangle”
Einthoven’s TriangleEinthoven’s Triangle
Placement of Limb LeadsPlacement of Limb Leads
Formation of the Triaxial SystemFormation of the Triaxial System
Unipolar LeadsUnipolar Leads
Many years following Einthoven’s simple
invention, the ECG was improved by
adding the unipolar leads (Wilson, 1934)
These leads are unipolar since there is only
a designated positive electrode
The negative pole is electrically averaged
by the ECG machine and the voltage
augmented (Goldberger, 1942)
Unipolar LeadsUnipolar Leads
Augmented (by 50%) Voltage …
Right, Left, Foot
aVR, aVL, aVF
aVR, aVL, aVFaVR, aVL, aVF
Unipolar Augmented Leads – Frontal Plane
Frontal Plane LeadsFrontal Plane Leads
The Hexaxial SystemThe Hexaxial System
Horizontal Plane LeadsHorizontal Plane Leads
 The horizontal plane is traditionally viewed by six
unipolar leads … additional leads are sometimes
applied.
 Also referred to as “Precordial Leads”, “Chest
Leads” or “V Leads”
 Positive pole is determined by the physical
placement on the chest
 The negative pole is electrically averaged (from
all three extremity electrodes) and is situated
somewhere in the middle of the chest cavity.
Horizontal Plane LeadsHorizontal Plane Leads
The “V” or Chest LeadsThe “V” or Chest Leads
Anatomical Landmarking ofAnatomical Landmarking of
Chest LeadsChest Leads
V1 – 4th
ICS immediately to the right of the
sternum
V2 – 4th
ICS immediately to the left of
sternum
V3 – Directly between V2 and V4
V4 – 5th
ICS, left mid-clavicular line
V5 – 5th
ICS, left anterior axillary line
V6 – 5th
ICS, left mid-axillary line
Cardiac LandmarksCardiac Landmarks
Placement of Chest LeadsPlacement of Chest Leads
2
3
4
5
The Resultant 12 LeadsThe Resultant 12 Leads
Right-sided Chest LeadsRight-sided Chest Leads
V1R– 4th
ICS immediately to the left of the
sternum
V2R – 4th
ICS immediately to the right of
sternum
V3R – Directly between V2R and V4R
V4R – 5th
ICS, right mid-clavicular line
V5R – 5th
ICS, right anterior axillary line
V6R – 5th
ICS, right mid-axillary line
MIRROR IMAGE OF LEFT-SIDED CHEST LEADS
Right Ventricular LeadsRight Ventricular Leads
Right Ventricular InfarctRight Ventricular Infarct
Posterior Chest LeadsPosterior Chest Leads
V7 – 5th
ICS posterior axillary line
V8 – 5th
ICS midscapular line
V9 – 5th
ICS midspinal line
EXTENSION OF LEADS TO LATERAL-POSTERIOR
12-Lead Electrocardiogram12-Lead Electrocardiogram
Lead Options for Clinical Monitoring
and Diagnostic Purposes
Lead Options for ClinicalLead Options for Clinical
Monitoring and DiagnosisMonitoring and Diagnosis
CONVENTIONAL: 10 Leads applied with
Standard Limb Lead placement
MODIFIED: 10 Leads applied with
Modified Limb Lead placement (Mason-
Likar, 1966 - for exercise testing)
EASITM
Lead Placement: 5 Leads (derived
12-Lead, using vectorcardiography)
Conventional versus ModifiedConventional versus Modified
Lead Placement for 12 LeadLead Placement for 12 Lead
CONVENTIONAL (Standard): Limb
electrode placement on the limbs (forearms
and lower legs)
MODIFIED (Mason-Likar): Limb electrode
placement on the torso (in same locations,
as used for standard continuous ECG
monitoring ... BUT!)
Modified lead placement not to be used for
Diagnostic ECG Interpretation
EASIEASI® 12 Lead® 12 Lead
Continuous, Real-time & Trending
12-Lead and ST Segment Monitoring
EASIEASI® 12 Lead® 12 Lead
Provides 12-lead data from 5 electrodes,
instead of the standard 10 electrode system.
Uses vectorcardiography, with leads placed
in a modified X,Y, Z configuration
When compared to conventional 5-Lead
ECG monitoring systems, EASI provides
more data and has been shown to be
superior at detecting myocardial ischemia
and cardiac arrhythmias.
EASIEASI® 12 Lead® 12 Lead
Innovative, clinically validated approach to
ECG monitoring
Derivation of 12 ECG leads using a 5-
electrode configuration
Science behind EASI is based on Dr.
Gordon Dower’s adaptation of 3-D
vectorcardiography (modified Frank vector
leads)
EASIEASI® 12 Lead® 12 Lead
Innovative, clinically validated approach to
ECG monitoring
Derivation of 12 ECG leads using a 5-
electrode configuration
EASI 12-Lead algorithm derives full 12-
lead ECG data to detect and document
cardiac arrhythmias and ST changes under
continuous monitoring conditions across
the care continuum.
EASIEASI® 12 Lead® 12 Lead
3 EASI3 EASI® Vectors® Vectors
E = Lower Sternum (Brown)
A = 5th
ICS, Right MAL (Red)
S = Upper Sternum (Black)
I = 5th
ICS, Left MAL (White)
 Lead ES S (-) to E (+)
 Lead AS S (-) to A (+)
 Lead AI I (-) to A (+)
3 EASI3 EASI® Vectors® Vectors
Clinical Advantages ofClinical Advantages of
EASIEASI® 12 Lead® 12 Lead
Convenient, stable electrode positions on
obvious anatomical landmarks enhancing
access, accuracy and reproducibility
Need for fewer electrodes increases patient
comfort and mobility
Ease of use results in time savings for care
givers
Clinical Advantages ofClinical Advantages of
EASIEASI® 12 Lead® 12 Lead
Innovative lead configuration achieves
superior signal-to-noise ratios
Left precordium is always free … low
interference with clinical procedures
supports consistent 12-Lead information
across the care continuum (physical exam,
CXR, echocardiography, emergency
resuscitation etc.)
Clinical Advantages ofClinical Advantages of
EASIEASI® 12 Lead® 12 Lead
Ability to capture dynamic changes that
may be missed using an ECG cart, since
transient events of diagnostic/therapeutic
importance may not persist long enough to
capture.
With EASI, transient events can be
documented with full 12-Lead ECG under
continuous monitoring conditions.
EASIEASI® 12 Lead® 12 Lead
When compared to standard 12-Lead
ECG’s, EASI derived 12-Lead is
diagnostically comparable for detection of
cardiac arrhythmias, myocardial ischemia,
and myocardial infarction (the most
common clinical applications for cardiac
monitoring)
How Good is EASIHow Good is EASI® 12 Lead® 12 Lead
 99% correlation between standard ECG
monitoring and EASI for Ischemia
 Excellent agreement between 2 methods for Rate,
Rhythm and Intervals
 Perfect agreement for Arrhythmia recognition
 84-99% correlation for Axis determination
 90% and above for acute and prior MI
recognition
 (Undetermined for atrial enlargement and
ventricular hypertrophy … chronic conditions)
Interpreting theInterpreting the
EASIEASI® 12 Lead® 12 Lead
 The derived EASI 12-lead is approached the same
way as a standard 12-lead … all principles remain
the same in terms of interpretation.
 EASI should be used as a trending tool & as a
dynamic clinical assessment tool (Monitoring)
 Baseline EASI 12-lead should be compared to any
changes, as is done with a conventional 12-lead.
 EASI 12-lead is not meant to replace a standard
12-lead in terms of diagnostic value, but used in
combination as a clinical assessment tool.
Technical ConsiderationsTechnical Considerations
Lead Placement & Vectors (Thoracic versus
Limb)
Millivolt and Standard
Filters
Back to the Application Stuff!Back to the Application Stuff!
Clinical Correlation:Clinical Correlation:
Arterial Blood Supply & ECGArterial Blood Supply & ECG
Right VentricleRight Ventricle
Right Coronary Artery (RCA)
Inferior Wall of Left VentricleInferior Wall of Left Ventricle
Right Coronary Artery (RCA)
Posterior Wall of Left VentriclePosterior Wall of Left Ventricle
Right Coronary Artery (RCA)
(Left Circumflex)
Anterior Wall of Left VentricleAnterior Wall of Left Ventricle
Left Anterior Descending (LAD) branch of
Left Coronary Artery
Septal Branch
Lateral Wall of Left VentricleLateral Wall of Left Ventricle
Circumflex branch of Left Coronary Artery
ApexApex
RCA or LAD or Circumflex
A Diagrammatic PerspectiveA Diagrammatic Perspective
It is the LEFT ventricle which contributes the forces when viewing the 12 Lead ECG
Cube ConceptCube Concept
Septal/Anterior
Apical
Lateral
Inferior
Endocardial
(Posterior)
Each “face” of the cube represents a different Left Ventricular wall
Right
Ventricle
Inferior LeadsInferior Leads
Leads II, III and aVF
Leads III, aVF, II
Anterior or Anteroseptal LeadsAnterior or Anteroseptal Leads
V1 through V6 (septal + anterior + apical)
V1-V2 Septal; V3-V4 Anterior or Mid-
Precordial;V5-V6 Apical
V1, V2, V3, V4 and V5, V6
Apical (Low Lateral) LeadsApical (Low Lateral) Leads
V5 and V6
(Lead II)
Lateral LeadsLateral Leads
Lead I and aVL
(Posterior Leads)(Posterior Leads)
Viewed as mirror-image changes in V1-V2
Endocardial LeadsEndocardial Leads
aVR!
(aVL on occasion)
Right Ventricular LeadsRight Ventricular Leads
V3R and V4R!!
(ST > Lead III than in Lead II and aVF)*
The “Cone” PerspectiveThe “Cone” Perspective
L. Schamroth
““OtherOther Fundamentals"Fundamentals"
Polarity
PolarityPolarity
An impulse traveling toward a positive
electrode will be recorded as positive … an
impulse traveling away from a positive
electrode will be recorded as negative
There are, however, varying degrees of
positivity and negativity represented by
various ECG waveforms
PolarityPolarity
 A lead measures
electrical activity
within an electrical
field
 The field is divided
into a positive half and
a negative half
Any impulse that falls within the positive half of the electrical field will result in a positive
complex, and any that fall within the negative half will result in a negative complex.
Positive & Negative FieldsPositive & Negative Fields
 The more PARALLEL
the impulse is to the
lead orientation, the
TALLER the complex.
As the impulse becomes more PERPENDICULAR to the lead orientation, it becomes more
ISOELECTRIC
ExploringExploring thethe ElectricalElectrical
Activation of the HeartActivation of the Heart
Wave of DepolarizationWave of Depolarization
The anatomic position of the heart must
also be considered, since it is the actual
position of the heart that influences the net
direction of electrical activity.
It is this NET direction that is recorded on
the ECG
Wave of DepolarizationWave of Depolarization
 Frontal Plane view of
mean wave of
depolarization
 Left-sided leads will
record the activity
opposite to Right-
sided leads
Wave of DepolarizationWave of Depolarization
 Even on a single
plane, electrical
activity can be viewed
in several directions at
once.
 Imagine a “tug-of-
war” between the LV
and RV
Ventricular DominanceVentricular Dominance
To apply this concept to venticular
activation, recall that the right
ventricle is a thin-walled chamber
with only one conduction pathway.
The left ventricle is a thicker muscle
mass and has two branches in it’s
conduction system.
Net Direction or VectorNet Direction or Vector
 Even though the
electrical activity of
the heart is travelling
in many directions at
once, one general
direction predominates
and can be determined
by averaging all of the
forces.
Normal ComponentsNormal Components
&& VectorsVectors
Introducing the 12 LeadIntroducing the 12 Lead
ElectrocardiogramElectrocardiogram
“Mapping the Heart’s Spark”
"The Traditional 12 Leads""The Traditional 12 Leads"
FRONTAL PLANE:
I
II
III
aVR
aVL
aVF
Lead I (Lateral)Lead I (Lateral)
0 degrees (LCx)0 degrees (LCx)
RA- …. LA+
P upright
Q small or none
R dominant
S < R or none
ST Isoelectric (+1 to –0.5)
T upright
Lead II (Inferior/Left)Lead II (Inferior/Left)
+ 60 degrees (RCA)+ 60 degrees (RCA)
RA- …. LL+
P upright
Q small or none
R dominant
S < R or none
ST Isoelectric (+1 to –0.5)
T upright
Lead III (Inferior/Right)Lead III (Inferior/Right)
+120 (RCA)+120 (RCA)
LA- … LL+
P upright, flat, diphasic, inverted
Q small or none
R none, diphasic to dominant
S none to dominant
ST Isoelectric (+1 to –0.5)
T upright, flat, diphasis, inverted
Lead aVR (Endocardial)Lead aVR (Endocardial)
- 150 degrees (global)- 150 degrees (global)
RA+
P inverted
Q small, none, large
R small or none
S dominant
ST Isoelectric (+1 to –0.5)
T inverted
Lead aVL (Lateral)Lead aVL (Lateral)
- 30 degrees (LCx)- 30 degrees (LCx)
LL+
P upright, flat, diphasic, inverted
Q small, none, large
R small, none, dominant
S small, none, dominant
ST Isoelectric (+1 to –0.5)
T upright, flat, diphasic, inverted
Lead aVF (Inferior)Lead aVF (Inferior)
+90 degrees (RCA)+90 degrees (RCA)
LL+
P upright, flat, diphasic, inverted
Q small or none
R small, none, dominant
S small, none, dominant
ST Isoelectric (+1 to –0.5)
T upright
"The Traditional 12 Leads""The Traditional 12 Leads"
HORIZONTAL PLANE:
V1
V2
V3
V4
V5
V6
Lead V1 (Septal)Lead V1 (Septal)
LAD-Septal branchLAD-Septal branch
4 ICS RSB
P upright, flat, diphasic
Q none, may be QS
R < S or none
S dominant
ST 0 to +3
T upright, flat, diphasic, inverted
Lead V2 (Septal)Lead V2 (Septal)
LAD-Septal branchLAD-Septal branch
4 ICS LSB
P upright
Q none
R < S
S dominant
ST 0 to +3
T upright, diphasic, inverted
Lead V3 (Anterior)Lead V3 (Anterior)
LADLAD
Between V2 and V4
P upright
Q small or none
R ~ S
S ~ R
ST 0 to +3
T upright
Lead V4 (Anterior)Lead V4 (Anterior)
LADLAD
5ICS LMCL
P upright
Q small or none
R > S
S < R
ST +1 to 0.5
T upright
Lead V5 (Apical)Lead V5 (Apical)
VariableVariable
5ICS LAAL
P upright
Q small
R Dominant
S small (< V4)
ST +1 to 0.5
T upright
Lead V6 (Apical)Lead V6 (Apical)
VariableVariable
5ICS MAL
P upright
Q small
R Dominant
S none
ST +1 to 0.5
T upright
“Putting the Leads Together”
Frontal Plane
Horizontal Plane
““AdditionalAdditional Leads"Leads"
HORIZONTAL PLANE: Right-Sided Leads
V1R
V2R
V3R
V4R
V5R
V6R
““AdditionalAdditional Leads"Leads"
HORIZONTAL PLANE: Posterior Leads
V7
V8
V9
"Systematic Approach""Systematic Approach"
to the Electrocardiogramto the Electrocardiogram
A Systematic ApproachA Systematic Approach
Establish underlying rhythm (atrial &
ventricular rates, PR interval, AV
conduction)
Measure the QRS (including VAT) and QT
interval
Determine the Mean Frontal Plane Axis
A Systematic ApproachA Systematic Approach
Screen For:
 Conduction Delays (based on prior assessment)
– Atrioventricular and/or Intraventricular
 Presence of Ischemia, Injury & Infarction
 Endocardial or Epicardial abnormalities
 Chamber Enlargement
– Atrial and/or Ventricular
 Other
– Electrolyte Abnormalities
– Drug Effects
A Systematic ApproachA Systematic Approach
Interpretation and Documentation:
Primary Rhythm
Conduction Disturbances
Secondary Rhythm (e.g. junctional escape)
Other abnormalities (ST, T, QT)
Significance?
Management?
The Electrical AxisThe Electrical Axis
Axis … No Problem!Axis … No Problem!
The Electrical AxisThe Electrical Axis
Intensity and direction that the electrical
impulse takes during depolarization &
repolarization
The general, mean or dominant direction of
the various vectors is known as the MEAN
VECTOR, and electrocardiographically as
the MEAN QRS AXIS
The Electrical AxisThe Electrical Axis
The electrical axis is determined by:
Magnitude
Direction
Polarity
It’s direction is determined from the frontal
plane (“rotation” on the horizontal plane)
Significance of theSignificance of the
Electrical AxisElectrical Axis
“The use of the Electrical axis in the clinical
interpretation of the electrocardiogram
constitutes a most important diagnostic
procedure and elevates electrocardiographic
interpretation from the empirical to the
deductive.”
Leo Schamroth. The Electrical Axis. It’s determination and significance.
Application of QRS AxisApplication of QRS Axis
Differentiation of different types of MI’s
Ventricular Dominance
Ventricular Ectopy vs Aberrancy
Hemiblocks
Pacemaker Function
W-P-W Syndrome
Dextrocardia
(Application of P Wave Axis)(Application of P Wave Axis)
P pulmonale
P congenitale
Retrograde activation of the atrium
(Application of T Wave Axis)(Application of T Wave Axis)
Ventricular hypertrophy
Coronary insufficiency
Fully evolved phase of acute myocardial
infarction
(Application of ST Axis)(Application of ST Axis)
Infarction
Subendocardial vs. Subepicardial injury
Calculating the MeanCalculating the Mean
QRS AxisQRS Axis
Determination of the AxisDetermination of the Axis
There are several methods for estimation of
the frontal plane axis.
Ideal method would be both the most
simplistic and accurate, thus lending itself
to efficient clinical application.
Steps for Calculation of AxisSteps for Calculation of Axis
1. Most equiphasic or smallest complex on
frontal plane?
2. Which lead is 900
(perpendicular) to this
lead?
3. Is this lead mostly positive or negative? If
positive, go to the positive pole … if
negative, go to the negative pole
4. Axis?
Lead AssociationsLead Associations
For any lead, there is another lead that is
always perpendicular to it, and visa versa
Perpendicular to a bipolar lead is always an
associated unipolar lead, and visa versa
Example: look at Lead II … what lead is
perpendicular to Lead II? (Lead II also
then must divide that lead into a positive
and a negative field)
Quick AssociationQuick Association
Memory TrickMemory Trick
I … aVF
II … aVL
III … aVR
Determination of AxisDetermination of Axis
Abnormal Axis orAbnormal Axis or ReversedReversed
Arm ElectrodesArm Electrodes?!??!?
Determination of AxisDetermination of Axis
1
2
Determination of AxisDetermination of Axis
3
4
Determination of AxisDetermination of Axis
5
6
Determination of AxisDetermination of Axis
7
8
Determination of AxisDetermination of Axis
9
10
Determination of theDetermination of the
Electrical AxisElectrical Axis
Axis DeviationAxis Deviation
ECG Patterns of Ischemia,ECG Patterns of Ischemia,
InjuryInjury && InfarctInfarct
Clinical Recognition
Ischemia, Injury & InfarctIschemia, Injury & Infarct
Myocardial Oxygenation
– Supply
– Demand
Regional versus Global deficits
Ischemia, Injury & InfarctIschemia, Injury & Infarct
Myocardial ischemia is often missed in
cases of silent ischemia
ST segment monitoring, though not the
most specific or sensitive, is the only
technology that can be applied continuously
(it is also non-invasive)
Silent Ischemia is as clinically significant as
that associated with chest pain … Total!
Ischemia, Injury & InfarctIschemia, Injury & Infarct
One must also correlate the coronary
arterial blood supply to the various
structures to the regions on the ECG and
other clinical considerations …
Without making this correlation, clinical
significance of ECG changes is
questionable.
Right Coronary ArteryRight Coronary Artery
Right Atrium
Right Ventricle
Inferior wall of Left Ventricle
Posterior wall of Left Ventricle
Posterior 1/3 of Intra-Ventricular Septum
SA node in 65% of population
AV node in 90% of population
Posteroinferior Division of Left Bundle
Branch
Left Anterior DescendingLeft Anterior Descending
Branch of Left Coronary ArteryBranch of Left Coronary Artery
Anterior wall of Left Ventricle
Anterior 2/3 of Intra-Ventricular Septum
(Apex of the Left Ventricle)
Bundle of His
Right Bundle Branch
Both Divisions of Left Bundle Branch
Left Circumflex Branch of LeftLeft Circumflex Branch of Left
Coronary ArteryCoronary Artery
Left Atrium
Lateral wall of Left Ventricle
(Posterior wall of Left Ventricle)
(Posterior 1/3 of Intra-Ventricular Septum)
SA node in 45% of population
AV node in 10% of population
Coronary CirculationCoronary Circulation
One must remember that this is a general
description of coronary circulation, and
applies to the majority of the population.
Individual variations in the coronary
vasculature are infinite, which explains the
varying ECG manifestations that may be
seen!
ECG ManifestationsECG Manifestations
The surface electrocardiogram (ECG) is the
most common noninvasive diagnostic
technique utilized to determine the presence
and location of myocardial infarction.
The limitations include not having enough
leads to view all regions, being an
intermittent assessment, and non-specific
findings.
The ECG as a Diagnostic ToolThe ECG as a Diagnostic Tool
The ECG is but one clinical assessment tool
used in the diagnosis of Acute Myocardial
Ischemia, Injury and Infarction.
Used in combination with History, Clinical
Assessment and Biochemical Markers, it
becomes an invaluable tool.
ZonesZones
Infarct, Injury & IschmiaInfarct, Injury & Ischmia
Note: Degree of involvement between Endocardium and Epicardium
Continuous ST-SegmentContinuous ST-Segment
Monitoring:Monitoring:
Protocol for PracticeProtocol for Practice
Repolarization the Key!Repolarization the Key!
Repolarization requires sufficient energy in
the form of ATP …
The Ventricular repolarization process is
normally reflected by the T wave (and U
wave)
Early repolarization abnormalities will
manifest itself in the ST segment …
resulting in ST segment changes
(repolarization wave shifts leftward)
What is Isoelectric?What is Isoelectric?
T-P Segment is preferable
What is ST Deviation?What is ST Deviation?
ST Segment MonitoringST Segment Monitoring
Ideally, ST segment monitoring should also
be done on a continuous basis in order to
continuously monitor & evaluate patient
progress.
Continuous computerized ST segment
monitoring is available for all 12 Leads
using “EASI 12 Lead” (5 Electrodes) or via
a Modified 12 Lead (10 Electrodes) using
specific algorithms.
ST Segment MonitoringST Segment Monitoring
 ST Index: avF, V2 and V5 (common lead
combination for detection of acute ischemia or
injury)
 Offers 98.4% sensitivity for acute ischemic events
 Increased sensitivity (99.3%) using Leads
III/V2/V5 or III/V2/V4
 Lead III is more sensitive for RV changes than
avF!
ST Segment MonitoringST Segment Monitoring
If an alarm is triggered due to an ST
segment change, only a clinician, not the
monitor, can determine the seriousness of
the event.
To ensure peak performance, the staff
should be aware of the interventions and
adjustments they can implement to enhance
the ST algorithm’s performance &
accuracy!
CAUTION …CAUTION …
ECG Settings!ECG Settings!
Sometimes it Hard to TellSometimes it Hard to Tell
What’s What … They LookWhat’s What … They Look
Similar!Similar!
Epicardial versusEpicardial versus
Endocardial?Endocardial?
Ischemia & InjuryIschemia & Injury
PatternsPatterns
ST’s up or down?ST’s up or down?
ST depression … endocardial involvement
ST elevation … epicardial involvement
From Who’s Perspective?From Who’s Perspective?
aVR = Endocardial Lead
(sometimes aVL also)
All other Leads = Epicardial Leads
ST changes Transient orST changes Transient or
Persistent?Persistent?
Transient ST changes … Anginal
syndromes
Persistent ST changes … Infarction process
(Rule out Aneurysm, Pericarditis)
Regional or GlobalRegional or Global
ST Changes?ST Changes?
Isolated to a specific region (remember
correlation to coronary arterial supply)
Widespread ST segment and/or T wave
changes may be seen in such conditions as
Pericarditis and Coronary Insufficiency.
Persistent ST ElevationPersistent ST Elevation
Concave or Convex?Concave or Convex?
Pericarditis-concave … Infarction-convex
QT Short? QT Long?
Acute PericarditisAcute Pericarditis
Indicative versus ReciprocalIndicative versus Reciprocal
ST ChangesST Changes
 Remember the cube concept … opposite walls can
show the opposite changes. Remember also,
associated leads (I/aVF, II/aVL, III/aVR) will
 ST elevation in one wall will show ST depression
in the opposite wall
 If you can turn the ST “upside down” from one set
of leads and match it to the ST in the opposing
wall, it’s most likely reciprocal … rather than a
separate process associated with a different
coronary artery.
Reciprocal LeadsReciprocal Leads
Think “Inside the Box”Think “Inside the Box”
Apex
Reciprocal PatternsReciprocal Patterns
Question: If a transmural infarct is on in the inferior wall, which leads
will show a reciprocal ST depression?
Can ST’s look abnormal in theCan ST’s look abnormal in the
Healthy Heart?Healthy Heart?
Early repolarization can often be found as a
normal variant, especially in the young,
blacks and athletes … this can mimic
pericarditis
Can also occur in rapid heart rates
Look at baselines and trends!
Be aware of normal variants
Manifestations of MyocardialManifestations of Myocardial
IschemiaIschemia
Subendocardial Myocardial Ischemia (Classic
Angina):
– Transient ST segment depression in the leads
facing the area
– T wave changes
Physiologic vs. Pathologic S-TPhysiologic vs. Pathologic S-T
Segment DepressionSegment Depression
Myocardial Ischemia –Myocardial Ischemia –
Coronary InsufficiencyCoronary Insufficiency
 Pathological
junctional ST segment
depression
 Hyperacute T-wave
(tall, peaked &
symmetrical)
 U-wave inversion
Exercise-Induced IschemiaExercise-Induced Ischemia
Manifestations of MyocardialManifestations of Myocardial
IschemiaIschemia
Prinzmetal’s (Variant) Angina:
– Transient ST segment elevation in the leads
facing the area
– ST elevation (injury pattern involving full
thickness of myocardium up to and including
the epicardium)
– Convex ST shape
– (R wave often increases in amplitude in an
injury pattern)
Variant Angina (Prinzmetal’s)Variant Angina (Prinzmetal’s)
A. During pain B. A few minutes after pain resolved
Infarction with or withoutInfarction with or without
ST elevation?ST elevation?
STEMI … ST-Elevated (Acute) MI
NSTEMI …. Non-ST-Elevated (Acute) MI
IIdentifying thedentifying the
“Non-“Non-TransmuralTransmural” or” or
Non-ST-ElevatedNon-ST-Elevated
MMyocardial Infarctionyocardial Infarction
Non-ST-Elevated MINon-ST-Elevated MI
(NSTEMI)(NSTEMI)
Persistent ST depressions and/or
Persistent T wave inversion
No Q wave
Loss of R wave amplitude
Non-ST-Elevated MINon-ST-Elevated MI
NSTEMINSTEMI
IIdentifying thedentifying the ““TransmuralTransmural” or” or
ST-ElevatedST-Elevated
Myocardial InfarctionMyocardial Infarction
ST-Elevated MI (STEMI)ST-Elevated MI (STEMI)
Persistent ST elevation and/or
Hyperacute T-wave changes … progressing
to T-wave inversion
Development of a pathological Q wave (if
untreated)
Loss of R wave amplitude
Evolving Inferior Wall STEMIEvolving Inferior Wall STEMI
Why a Q wave?Why a Q wave?
The “Electrical Window” Concept
Why Not a Q wave?Why Not a Q wave?
Loss of R wave amplitude is just as significant!
Locating the Area of InfarctionLocating the Area of Infarction
ECG Manifestations and
Clinical Implications
I Should Be Able to do This …I Should Be Able to do This …
Right!?!Right!?!
ST SegmentsST Segments
ST Trending and Mapping –
Expanding our Clinical
Monitoring for ACS
Acknowledgement: Philips Medical Systems – ST MapTM
Continuous ST SegmentContinuous ST Segment
MonitoringMonitoring
(2009)
ST Segment Monitoring –ST Segment Monitoring –
Widely Underused!Widely Underused!
CLASS I:
Acute Coronary Syndromes
Chest Pain or Anginal Equivalent
Syndromes
PTCA with suboptimal Angiographic
results
Variant Angina (Coronary Vasospasm)
ST Segment Monitoring –ST Segment Monitoring –
Widely Underused!Widely Underused!
CLASS II:
Postacute MI
Non-urgent Percutaneous Coronary
Intervention
High Risk for Ischemia after Cardiac or
Noncardiac Surgery
High Risk for Ischemia resulting from
Congential or Acquired Conditions (eg.
Trauma, Cardiotoxic drugs, Myocarditis …)
ST Segment Monitoring –ST Segment Monitoring –
Technically more difficult …Technically more difficult …
CLASS III:
LBBB, or intermittent RBBB
Ventricular Paced Rhythm
Rhythms that Obscure the ST segment
(coarse atrial fibrillation or flutter)
Remember that ST segment deviation is not always
an indication of ischemia/infarction…
ST elevation
 Myocardial injury
 Pericarditis
 Dyskinetic ventricle
 Ventricular aneurysm
(persistent V1-V4)
 J-point elevation (normal young
patients)
ST depression
 Ischemia
 Tachycardia
 Subendocardial infarction
 Posterior wall MI (reciprocal)
 Carbon monoxide poisoning
 Antiarrythmic drugs (eg.
Lanoxin)
 Mitral valve prolapse
 Wolf-Parkison-White syndrome
 Hypokalemia
Who is using ST segmentWho is using ST segment
monitoring?monitoring?
Nursing survey in 2001 found…
 Only 50% units are using ST segment monitoring consistently
 Attributed to:
– staff skill level; lack of expertise for interpretation; “trickle” down effect (from
research to bedside implementation); Too many false alarms; Cost prohibitive;
Clinician appreciation of measurement
“We hypothesized that ST segment monitoring, although clearly
sensitive for detecting myocardial ischemia, may not provide
clinically useful information in a user-friendly manner”
Survey of use of ST-segment monitoring in patients with acute coronary syndromes
Patton et al, AJCC Vol 10, No1, Pg 23-34
ST Segment displays…ST Segment displays…
A nice overview but what
about…
 Assistance with pattern
recognition.
 The location of the ST
changes.
 The evolution of the ST
changes.
12-Lead Display screen
ST Baseline Window
ST Segment Display Screen
Cardiologists & ContinuousCardiologists & Continuous
ST-Segment MonitoringST-Segment Monitoring
“ST Map” offers a solution…
ST “Map” = ST “Multivariate Axis Plotting”
““ST Map”ST Map”™™
ENHANCED CLINICAL RECOGNITION!
Assists with Pattern Recognition (more
intuitive)
Assists with Locating the area of
involvement (diagrammatic representation)
Assists with trending, showing evolutionary
changes
Eindhoven’s Triangle
Frontal Plane LeadsFrontal Plane Leads
Limb Leads
Augmented Limb Leads
Inferior
Superior
Left
Right
Horizontal Plane LeadsHorizontal Plane Leads
Precordial (Chest) Leads
Posterior
Anterior
Left
Right
Creating the Multivariate AxisCreating the Multivariate Axis
Plot (Map)Plot (Map)
Creating the Multivariate PlotCreating the Multivariate Plot
…the complete picture (Frontal & Horizontal)
Limb Leads Chest Leads
(Must have minimum of 3 leads active for the ST Map to be displayed
- i.e 3 chest leads for chest map, 3 limb leads for limb map)
Inferior
Apical
Septal
Lateral
Anterior
Clinical and ECG Correlation…Clinical and ECG Correlation…
Anterior view
Location Leads Reciprocal Artery involved
ST elevation ST depression
Inferior II, III, aVF I, aVL Right Coronary Artery
Lateral I, aVL, (V5, V6) V1, V2 Circumflex
Large Anterior V1, V2, V3, V4, I, aVL II, III, aVF Left Coronary Artery
Anterolateral I, aVL, V4, V5, V6 II, III, aVF Left Anterior Descending
Anteroseptal V1, V2, V3 None Left Anterior Descending
ST Map on the 12-lead DisplayST Map on the 12-lead Display
ST Map (Current) WindowST Map (Current) Window
To hide
baseline
ST Map (Trend) WindowST Map (Trend) Window
Sends the content of the ST Map
window to the configured printer.
ST (Current) PrintoutST (Current) Printout
ST (Trend) PrintoutST (Trend) Printout
ST Map report forST Map report for
documentation…documentation…
Application of ST MapApplication of ST Map
A Case StudyA Case Study
Clinical Application of ST Segment Trending
using “ST Map”
Case StudyCase Study
A 62-year-old male presents to the Emergency Room with a
two-hour history of developing chest pain while gardening.
On arrival, patient is anxious, pale and sweating. He is also nauseated and states he
feels dizzy, complaining of chest & jaw pain (pain score 4 out 5) associated
with left arm numbness.
The patient is connected to the monitor & the following vital signs are recorded:
HR 62
RR 28 (SpO297%)
BP 90/50
T 369
ST Map shows the following localization…
ST Map current view in acuteST Map current view in acute
phase…phase…
ST Elevation
ST Depression
ST Elevation
ST Depression
12 lead ECG on arrival in the12 lead ECG on arrival in the
Emergency RoomEmergency Room
Location of ST changes on theLocation of ST changes on the
ECG…ECG…
Location Leads Reciprocal Artery involved
ST elevation ST depression
Inferior II, III, aVF I, aVL Right Coronary Artery
Lateral I, aVL, V5, V6 V1, V2 Circumflex
Anterior V1, V2, V3, V4, I, aVL II, III, aVF Left Coronary Artery
Anterolateral I, aVL, V4, V5, V6 II, III, aVF Left Anterior Descending
Anteroseptal V1, V2, V3 None Left Anterior Descending
After evaluating the presenting symptoms,
strong family history, & 12 lead ECG changes
a diagnosis of acute inferior myocardial
infarction is made.
The patient is prepared for an emergency
angiography with possible angioplasty.
ST Map current view usingST Map current view using
reference baseline to monitor forreference baseline to monitor for
changes during angioplasty…changes during angioplasty…
Reference baseline
ST Elevation
Angiogram showed a 85% occlusion of proximal
right coronary artery and a coronary stent was
successfully deployed. ReoPro™ was given as
per hospital guidelines.
The patient’s condition is stable and he is
transferred to the Coronary Care Unit for close
observation.
Three hours post angioplasty…Three hours post angioplasty…
ST Elevation
Using ST Map trends forUsing ST Map trends for
continued management…continued management…
12 hours post angioplasty, the patient had a brief
episode of central non-radiating chest pain at rest not
associated with any other signs and symptoms.
The trending feature on the ST Map was set for 12
second snapshots to observe closely the changes in
the ST segments.
The pain resolved spontaneously.
ST Map trends using 12 secondST Map trends using 12 second
snapshots to observe closely STsnapshots to observe closely ST
changes…changes…
This episode of chest pain resolved
spontaneously and the patient remained pain-
free.
The ST Map at 24hrs post angioplasty, showed
that the inferior ST segments, were nearly
back to normal and that the lateral changes had
resolved completely.
ST Map at 24 hours shows theST Map at 24 hours shows the
ST changes nearly back toST changes nearly back to
normal…normal…
12 lead serial ECG confirms ST12 lead serial ECG confirms ST
Map findings…Map findings…
Residual Q wave & T wave inversion
The patient remained pain-free for the remainder
of his stay in the CCU. After spending time on
the telemetry floor, the patient was discharged
home 7 days post angioplasty.
“Using ST MapTM
for monitoring ST segment monitoring, provides
clinically useful information in a user-friendly manner”
Survey of use of ST-segment monitoring in patients with acute coronary syndromes
Patton et al, AJCC Vol 10, No1, Pg 23-34
TM
Philips Medical Systems
Identifying IntraventricularIdentifying Intraventricular
Conduction DefectsConduction Defects
RBBB, LBBB, LAH, LPH,
Bifascicular & Trifascicular Blocks
Remember the Basics!Remember the Basics!
Normally Left before Right!
Remember the Basics!Remember the Basics!
Right Bundle Branch BlockRight Bundle Branch Block
 Normal variant
 Ischemic heart disease
 Acute myocardial infarction
 Acute coronary insufficiency
 Trauma
 Acute heart failure
 Intracardiac catheter (PA catheter)
 Right heart catheterization
Causes of RBBBCauses of RBBB
Cardiomyopathy
Degenerative disease of the conduction
system
Acute Infective processes
Parasites
Rheumatic heart, Syphilis, Tumors,
Congenital lesions
Surgery (Tetralogy of Fallot, VSD)
Salient Features of RBBBSalient Features of RBBB
Wide QRS (> .10 sec)
Increased VAT (> 0.04 sec) in RV leads
rsR’ or qR in V1
T opposite polarity to QRS in RV leads
Wide S wave in left-sided leads (V6, I, II)
Left Bundle Branch BlockLeft Bundle Branch Block
Causes of LBBBCauses of LBBB
Not as common as Right Bundle Branch
Block due to two separate fascicles
(posterior fascicle has a dual blood supply
and is much thicker)
Causes are the same as for Right Bundle
Branch Block, but involving the Left
Ventricle or Surgery to the Aortic Valve.
Salient Features of LBBBSalient Features of LBBB
Wide QRS (> .10 sec)
Increased VAT (> 0.04 sec) in LV leads
Wide R or notched “M-shaped R” in Left-
sided leads (V5, V6, I, aVL, II)
T opposite polarity to QRS in LV leads
Wide S or QS wave in right-sided leads
(V1)
The Ultimate Test!The Ultimate Test!
To be continued …To be continued …
I’m 100% saturated!I’m 100% saturated!
Thank you!Thank you!

More Related Content

What's hot

Ekg[1]
Ekg[1]Ekg[1]
Ekg[1]fveres
 
Asymptomatic WPW management
Asymptomatic WPW managementAsymptomatic WPW management
Asymptomatic WPW managementsalah_atta
 
Introduction To Electrophysiology
Introduction To ElectrophysiologyIntroduction To Electrophysiology
Introduction To Electrophysiologyjmlafroscia
 
Basics of Electrocardiography, Arrhythmia & Pacemaker
Basics of Electrocardiography, Arrhythmia & PacemakerBasics of Electrocardiography, Arrhythmia & Pacemaker
Basics of Electrocardiography, Arrhythmia & PacemakerPallab Nath
 
Basics of Electrophysiologic study, part 1 (2020)
Basics of Electrophysiologic study, part 1 (2020)Basics of Electrophysiologic study, part 1 (2020)
Basics of Electrophysiologic study, part 1 (2020)salah_atta
 
Interpretation of arrhythmias
Interpretation of arrhythmiasInterpretation of arrhythmias
Interpretation of arrhythmiasJeya Rajathurai
 
Electrophysiology study basics
Electrophysiology study basicsElectrophysiology study basics
Electrophysiology study basicsSatyam Rajvanshi
 
Focus on the origin of NCT
Focus on the origin of NCTFocus on the origin of NCT
Focus on the origin of NCTSolidaSakhan
 
ECG, step by step approach (Updated)
ECG, step by step approach (Updated)ECG, step by step approach (Updated)
ECG, step by step approach (Updated)Kerolus Shehata
 
心臟植入性電子儀器(CIED)的基本原理及設定
心臟植入性電子儀器(CIED)的基本原理及設定心臟植入性電子儀器(CIED)的基本原理及設定
心臟植入性電子儀器(CIED)的基本原理及設定Taiwan Heart Rhythm Society
 
Basics of ICD - Dr Hafeesh Fazulu - Pushpagiri
Basics of ICD - Dr Hafeesh Fazulu - PushpagiriBasics of ICD - Dr Hafeesh Fazulu - Pushpagiri
Basics of ICD - Dr Hafeesh Fazulu - PushpagiriHafeesh Fazulu
 
Electrophysiologic basics,part1(lecture)
Electrophysiologic basics,part1(lecture)Electrophysiologic basics,part1(lecture)
Electrophysiologic basics,part1(lecture)salah_atta
 
Seminar cardiac pacemaker
Seminar  cardiac pacemakerSeminar  cardiac pacemaker
Seminar cardiac pacemakerSwaraj Raghavan
 
Basic of ECG with common abnormalities.
Basic of ECG with common abnormalities.Basic of ECG with common abnormalities.
Basic of ECG with common abnormalities.khalilUllah26
 

What's hot (20)

Ekg[1]
Ekg[1]Ekg[1]
Ekg[1]
 
Essentials of ecg interpretation aphrs
Essentials of ecg interpretation aphrsEssentials of ecg interpretation aphrs
Essentials of ecg interpretation aphrs
 
Asymptomatic WPW management
Asymptomatic WPW managementAsymptomatic WPW management
Asymptomatic WPW management
 
Introduction To Electrophysiology
Introduction To ElectrophysiologyIntroduction To Electrophysiology
Introduction To Electrophysiology
 
Basics of Electrocardiography, Arrhythmia & Pacemaker
Basics of Electrocardiography, Arrhythmia & PacemakerBasics of Electrocardiography, Arrhythmia & Pacemaker
Basics of Electrocardiography, Arrhythmia & Pacemaker
 
ECG Basics
ECG BasicsECG Basics
ECG Basics
 
Basics of Electrophysiologic study, part 1 (2020)
Basics of Electrophysiologic study, part 1 (2020)Basics of Electrophysiologic study, part 1 (2020)
Basics of Electrophysiologic study, part 1 (2020)
 
Basic EP Study
Basic EP StudyBasic EP Study
Basic EP Study
 
Basic ecg1
Basic ecg1Basic ecg1
Basic ecg1
 
Interpretation of arrhythmias
Interpretation of arrhythmiasInterpretation of arrhythmias
Interpretation of arrhythmias
 
Electrophysiology study basics
Electrophysiology study basicsElectrophysiology study basics
Electrophysiology study basics
 
Focus on the origin of NCT
Focus on the origin of NCTFocus on the origin of NCT
Focus on the origin of NCT
 
ECG, step by step approach (Updated)
ECG, step by step approach (Updated)ECG, step by step approach (Updated)
ECG, step by step approach (Updated)
 
心臟植入性電子儀器(CIED)的基本原理及設定
心臟植入性電子儀器(CIED)的基本原理及設定心臟植入性電子儀器(CIED)的基本原理及設定
心臟植入性電子儀器(CIED)的基本原理及設定
 
Basics of ICD - Dr Hafeesh Fazulu - Pushpagiri
Basics of ICD - Dr Hafeesh Fazulu - PushpagiriBasics of ICD - Dr Hafeesh Fazulu - Pushpagiri
Basics of ICD - Dr Hafeesh Fazulu - Pushpagiri
 
Pacemaker
PacemakerPacemaker
Pacemaker
 
Pacemakers
PacemakersPacemakers
Pacemakers
 
Electrophysiologic basics,part1(lecture)
Electrophysiologic basics,part1(lecture)Electrophysiologic basics,part1(lecture)
Electrophysiologic basics,part1(lecture)
 
Seminar cardiac pacemaker
Seminar  cardiac pacemakerSeminar  cardiac pacemaker
Seminar cardiac pacemaker
 
Basic of ECG with common abnormalities.
Basic of ECG with common abnormalities.Basic of ECG with common abnormalities.
Basic of ECG with common abnormalities.
 

Viewers also liked (12)

ECG: Atrial Infarct
ECG: Atrial InfarctECG: Atrial Infarct
ECG: Atrial Infarct
 
2013心臟電生理相關專業人員教育課程(北區)
2013心臟電生理相關專業人員教育課程(北區)2013心臟電生理相關專業人員教育課程(北區)
2013心臟電生理相關專業人員教育課程(北區)
 
Advanced ECG Interpretation – An Interactive Workshop 高雄場
Advanced ECG Interpretation – An Interactive Workshop 高雄場Advanced ECG Interpretation – An Interactive Workshop 高雄場
Advanced ECG Interpretation – An Interactive Workshop 高雄場
 
Narrow qrs tachy i.tammi raju
Narrow qrs tachy i.tammi rajuNarrow qrs tachy i.tammi raju
Narrow qrs tachy i.tammi raju
 
Approach to svt
Approach to svt Approach to svt
Approach to svt
 
Approach to a case of narrow complex tachycardia
Approach to a case of narrow complex tachycardiaApproach to a case of narrow complex tachycardia
Approach to a case of narrow complex tachycardia
 
SVT
SVTSVT
SVT
 
Principles of electrocardiography ppt
Principles of electrocardiography pptPrinciples of electrocardiography ppt
Principles of electrocardiography ppt
 
ECG: Wide Complex Tachycardia
ECG: Wide Complex TachycardiaECG: Wide Complex Tachycardia
ECG: Wide Complex Tachycardia
 
Tachyarrhythmia
TachyarrhythmiaTachyarrhythmia
Tachyarrhythmia
 
Supraventricular tachycardias
Supraventricular tachycardiasSupraventricular tachycardias
Supraventricular tachycardias
 
Ventricular tachycardia
Ventricular tachycardiaVentricular tachycardia
Ventricular tachycardia
 

Similar to Demystifying clinical electrocardiography august, 2013

Presentation e acls aremt
Presentation   e acls aremtPresentation   e acls aremt
Presentation e acls aremtaremt
 
Chapter_36 dysrhythmias [Autosaved].pptx
Chapter_36 dysrhythmias [Autosaved].pptxChapter_36 dysrhythmias [Autosaved].pptx
Chapter_36 dysrhythmias [Autosaved].pptxIbrahimkargbo10
 
basicsofecg-150707084411-lva1-app6892.ppt
basicsofecg-150707084411-lva1-app6892.pptbasicsofecg-150707084411-lva1-app6892.ppt
basicsofecg-150707084411-lva1-app6892.pptSheliDuya2
 
Basics of ECG.ppt dr.k.subramanyam
Basics of ECG.ppt dr.k.subramanyamBasics of ECG.ppt dr.k.subramanyam
Basics of ECG.ppt dr.k.subramanyamAdarsh
 
simple ecg learningMEM.pptx
simple ecg learningMEM.pptxsimple ecg learningMEM.pptx
simple ecg learningMEM.pptxDr'manas Pandey
 
Cardiology 2.1. ECG or EKG - by Dr. Farjad Ikram
Cardiology 2.1. ECG or EKG - by Dr. Farjad IkramCardiology 2.1. ECG or EKG - by Dr. Farjad Ikram
Cardiology 2.1. ECG or EKG - by Dr. Farjad IkramFarjad Ikram
 
ecg-130715033518-phpapp02-1.pdf
ecg-130715033518-phpapp02-1.pdfecg-130715033518-phpapp02-1.pdf
ecg-130715033518-phpapp02-1.pdfAtiqurRahman7153
 
Basic EP study (part1)
Basic  EP  study (part1)Basic  EP  study (part1)
Basic EP study (part1)SolidaSakhan
 
APPROACH TO NARROW COMPLEX TACHYCARDIA
APPROACH TO NARROW COMPLEX TACHYCARDIAAPPROACH TO NARROW COMPLEX TACHYCARDIA
APPROACH TO NARROW COMPLEX TACHYCARDIAPDT DM CARDIOLOGY
 
approach to narrow comlex tachycardia
approach to narrow comlex tachycardiaapproach to narrow comlex tachycardia
approach to narrow comlex tachycardiakrishna7717
 
Anesthesia related presentation very helpful
Anesthesia related presentation very helpfulAnesthesia related presentation very helpful
Anesthesia related presentation very helpfulMalikArifUllah
 

Similar to Demystifying clinical electrocardiography august, 2013 (20)

Presentation e acls aremt
Presentation   e acls aremtPresentation   e acls aremt
Presentation e acls aremt
 
ecg.ppt
ecg.pptecg.ppt
ecg.ppt
 
Basics of ecg
Basics of ecgBasics of ecg
Basics of ecg
 
Chapter_36 dysrhythmias [Autosaved].pptx
Chapter_36 dysrhythmias [Autosaved].pptxChapter_36 dysrhythmias [Autosaved].pptx
Chapter_36 dysrhythmias [Autosaved].pptx
 
Basics of Electrocardiography(ECG)
Basics of Electrocardiography(ECG)Basics of Electrocardiography(ECG)
Basics of Electrocardiography(ECG)
 
basicsofecg-150707084411-lva1-app6892.ppt
basicsofecg-150707084411-lva1-app6892.pptbasicsofecg-150707084411-lva1-app6892.ppt
basicsofecg-150707084411-lva1-app6892.ppt
 
Basics of ECG.ppt dr.k.subramanyam
Basics of ECG.ppt dr.k.subramanyamBasics of ECG.ppt dr.k.subramanyam
Basics of ECG.ppt dr.k.subramanyam
 
ECG basics
ECG basicsECG basics
ECG basics
 
simple ecg learningMEM.pptx
simple ecg learningMEM.pptxsimple ecg learningMEM.pptx
simple ecg learningMEM.pptx
 
Ecg made easy
Ecg made easyEcg made easy
Ecg made easy
 
Cardiology 2.1. ECG or EKG - by Dr. Farjad Ikram
Cardiology 2.1. ECG or EKG - by Dr. Farjad IkramCardiology 2.1. ECG or EKG - by Dr. Farjad Ikram
Cardiology 2.1. ECG or EKG - by Dr. Farjad Ikram
 
ECG by Adil.pptx
ECG by Adil.pptxECG by Adil.pptx
ECG by Adil.pptx
 
ECG
ECGECG
ECG
 
ecg-130715033518-phpapp02-1.pdf
ecg-130715033518-phpapp02-1.pdfecg-130715033518-phpapp02-1.pdf
ecg-130715033518-phpapp02-1.pdf
 
Basic EP study (part1)
Basic  EP  study (part1)Basic  EP  study (part1)
Basic EP study (part1)
 
Jp's pacemaker
Jp's pacemakerJp's pacemaker
Jp's pacemaker
 
APPROACH TO NARROW COMPLEX TACHYCARDIA
APPROACH TO NARROW COMPLEX TACHYCARDIAAPPROACH TO NARROW COMPLEX TACHYCARDIA
APPROACH TO NARROW COMPLEX TACHYCARDIA
 
approach to narrow comlex tachycardia
approach to narrow comlex tachycardiaapproach to narrow comlex tachycardia
approach to narrow comlex tachycardia
 
ECG reading
ECG readingECG reading
ECG reading
 
Anesthesia related presentation very helpful
Anesthesia related presentation very helpfulAnesthesia related presentation very helpful
Anesthesia related presentation very helpful
 

Recently uploaded

Call Girls Shahdol Just Call 8250077686 Top Class Call Girl Service Available
Call Girls Shahdol Just Call 8250077686 Top Class Call Girl Service AvailableCall Girls Shahdol Just Call 8250077686 Top Class Call Girl Service Available
Call Girls Shahdol Just Call 8250077686 Top Class Call Girl Service AvailableDipal Arora
 
Independent Bangalore Call Girls (Adult Only) 💯Call Us 🔝 7304373326 🔝 💃 Escor...
Independent Bangalore Call Girls (Adult Only) 💯Call Us 🔝 7304373326 🔝 💃 Escor...Independent Bangalore Call Girls (Adult Only) 💯Call Us 🔝 7304373326 🔝 💃 Escor...
Independent Bangalore Call Girls (Adult Only) 💯Call Us 🔝 7304373326 🔝 💃 Escor...Sheetaleventcompany
 
(RIYA)🎄Airhostess Call Girl Jaipur Call Now 8445551418 Premium Collection Of ...
(RIYA)🎄Airhostess Call Girl Jaipur Call Now 8445551418 Premium Collection Of ...(RIYA)🎄Airhostess Call Girl Jaipur Call Now 8445551418 Premium Collection Of ...
(RIYA)🎄Airhostess Call Girl Jaipur Call Now 8445551418 Premium Collection Of ...TanyaAhuja34
 
Call Girls in Lucknow Just Call 👉👉 8875999948 Top Class Call Girl Service Ava...
Call Girls in Lucknow Just Call 👉👉 8875999948 Top Class Call Girl Service Ava...Call Girls in Lucknow Just Call 👉👉 8875999948 Top Class Call Girl Service Ava...
Call Girls in Lucknow Just Call 👉👉 8875999948 Top Class Call Girl Service Ava...Janvi Singh
 
Bhawanipatna Call Girls 📞9332606886 Call Girls in Bhawanipatna Escorts servic...
Bhawanipatna Call Girls 📞9332606886 Call Girls in Bhawanipatna Escorts servic...Bhawanipatna Call Girls 📞9332606886 Call Girls in Bhawanipatna Escorts servic...
Bhawanipatna Call Girls 📞9332606886 Call Girls in Bhawanipatna Escorts servic...Dipal Arora
 
Goa Call Girl Service 📞9xx000xx09📞Just Call Divya📲 Call Girl In Goa No💰Advanc...
Goa Call Girl Service 📞9xx000xx09📞Just Call Divya📲 Call Girl In Goa No💰Advanc...Goa Call Girl Service 📞9xx000xx09📞Just Call Divya📲 Call Girl In Goa No💰Advanc...
Goa Call Girl Service 📞9xx000xx09📞Just Call Divya📲 Call Girl In Goa No💰Advanc...Sheetaleventcompany
 
Low Cost Call Girls Bangalore {9179660964} ❤️VVIP NISHA Call Girls in Bangalo...
Low Cost Call Girls Bangalore {9179660964} ❤️VVIP NISHA Call Girls in Bangalo...Low Cost Call Girls Bangalore {9179660964} ❤️VVIP NISHA Call Girls in Bangalo...
Low Cost Call Girls Bangalore {9179660964} ❤️VVIP NISHA Call Girls in Bangalo...Sheetaleventcompany
 
ANATOMY AND PHYSIOLOGY OF REPRODUCTIVE SYSTEM.pptx
ANATOMY AND PHYSIOLOGY OF REPRODUCTIVE SYSTEM.pptxANATOMY AND PHYSIOLOGY OF REPRODUCTIVE SYSTEM.pptx
ANATOMY AND PHYSIOLOGY OF REPRODUCTIVE SYSTEM.pptxSwetaba Besh
 
Dehradun Call Girls Service {8854095900} ❤️VVIP ROCKY Call Girl in Dehradun U...
Dehradun Call Girls Service {8854095900} ❤️VVIP ROCKY Call Girl in Dehradun U...Dehradun Call Girls Service {8854095900} ❤️VVIP ROCKY Call Girl in Dehradun U...
Dehradun Call Girls Service {8854095900} ❤️VVIP ROCKY Call Girl in Dehradun U...Sheetaleventcompany
 
Kolkata Call Girls Naktala 💯Call Us 🔝 8005736733 🔝 💃 Top Class Call Girl Se...
Kolkata Call Girls Naktala  💯Call Us 🔝 8005736733 🔝 💃  Top Class Call Girl Se...Kolkata Call Girls Naktala  💯Call Us 🔝 8005736733 🔝 💃  Top Class Call Girl Se...
Kolkata Call Girls Naktala 💯Call Us 🔝 8005736733 🔝 💃 Top Class Call Girl Se...Namrata Singh
 
❤️Chandigarh Escorts Service☎️9814379184☎️ Call Girl service in Chandigarh☎️ ...
❤️Chandigarh Escorts Service☎️9814379184☎️ Call Girl service in Chandigarh☎️ ...❤️Chandigarh Escorts Service☎️9814379184☎️ Call Girl service in Chandigarh☎️ ...
❤️Chandigarh Escorts Service☎️9814379184☎️ Call Girl service in Chandigarh☎️ ...Sheetaleventcompany
 
Call Girls Rishikesh Just Call 9667172968 Top Class Call Girl Service Available
Call Girls Rishikesh Just Call 9667172968 Top Class Call Girl Service AvailableCall Girls Rishikesh Just Call 9667172968 Top Class Call Girl Service Available
Call Girls Rishikesh Just Call 9667172968 Top Class Call Girl Service Availableperfect solution
 
💚Chandigarh Call Girls Service 💯Piya 📲🔝8868886958🔝Call Girls In Chandigarh No...
💚Chandigarh Call Girls Service 💯Piya 📲🔝8868886958🔝Call Girls In Chandigarh No...💚Chandigarh Call Girls Service 💯Piya 📲🔝8868886958🔝Call Girls In Chandigarh No...
💚Chandigarh Call Girls Service 💯Piya 📲🔝8868886958🔝Call Girls In Chandigarh No...Sheetaleventcompany
 
Call Girl In Chandigarh 📞9809698092📞 Just📲 Call Inaaya Chandigarh Call Girls ...
Call Girl In Chandigarh 📞9809698092📞 Just📲 Call Inaaya Chandigarh Call Girls ...Call Girl In Chandigarh 📞9809698092📞 Just📲 Call Inaaya Chandigarh Call Girls ...
Call Girl In Chandigarh 📞9809698092📞 Just📲 Call Inaaya Chandigarh Call Girls ...Sheetaleventcompany
 
Cheap Rate Call Girls Bangalore {9179660964} ❤️VVIP BEBO Call Girls in Bangal...
Cheap Rate Call Girls Bangalore {9179660964} ❤️VVIP BEBO Call Girls in Bangal...Cheap Rate Call Girls Bangalore {9179660964} ❤️VVIP BEBO Call Girls in Bangal...
Cheap Rate Call Girls Bangalore {9179660964} ❤️VVIP BEBO Call Girls in Bangal...Sheetaleventcompany
 
ANATOMY AND PHYSIOLOGY OF RESPIRATORY SYSTEM.pptx
ANATOMY AND PHYSIOLOGY OF RESPIRATORY SYSTEM.pptxANATOMY AND PHYSIOLOGY OF RESPIRATORY SYSTEM.pptx
ANATOMY AND PHYSIOLOGY OF RESPIRATORY SYSTEM.pptxSwetaba Besh
 
Call Girls Kathua Just Call 8250077686 Top Class Call Girl Service Available
Call Girls Kathua Just Call 8250077686 Top Class Call Girl Service AvailableCall Girls Kathua Just Call 8250077686 Top Class Call Girl Service Available
Call Girls Kathua Just Call 8250077686 Top Class Call Girl Service AvailableDipal Arora
 
💚Call Girls In Amritsar 💯Anvi 📲🔝8725944379🔝Amritsar Call Girl No💰Advance Cash...
💚Call Girls In Amritsar 💯Anvi 📲🔝8725944379🔝Amritsar Call Girl No💰Advance Cash...💚Call Girls In Amritsar 💯Anvi 📲🔝8725944379🔝Amritsar Call Girl No💰Advance Cash...
💚Call Girls In Amritsar 💯Anvi 📲🔝8725944379🔝Amritsar Call Girl No💰Advance Cash...Sheetaleventcompany
 
Call girls Service Phullen / 9332606886 Genuine Call girls with real Photos a...
Call girls Service Phullen / 9332606886 Genuine Call girls with real Photos a...Call girls Service Phullen / 9332606886 Genuine Call girls with real Photos a...
Call girls Service Phullen / 9332606886 Genuine Call girls with real Photos a...call girls hydrabad
 
Call Girls Bangalore - 450+ Call Girl Cash Payment 💯Call Us 🔝 6378878445 🔝 💃 ...
Call Girls Bangalore - 450+ Call Girl Cash Payment 💯Call Us 🔝 6378878445 🔝 💃 ...Call Girls Bangalore - 450+ Call Girl Cash Payment 💯Call Us 🔝 6378878445 🔝 💃 ...
Call Girls Bangalore - 450+ Call Girl Cash Payment 💯Call Us 🔝 6378878445 🔝 💃 ...gragneelam30
 

Recently uploaded (20)

Call Girls Shahdol Just Call 8250077686 Top Class Call Girl Service Available
Call Girls Shahdol Just Call 8250077686 Top Class Call Girl Service AvailableCall Girls Shahdol Just Call 8250077686 Top Class Call Girl Service Available
Call Girls Shahdol Just Call 8250077686 Top Class Call Girl Service Available
 
Independent Bangalore Call Girls (Adult Only) 💯Call Us 🔝 7304373326 🔝 💃 Escor...
Independent Bangalore Call Girls (Adult Only) 💯Call Us 🔝 7304373326 🔝 💃 Escor...Independent Bangalore Call Girls (Adult Only) 💯Call Us 🔝 7304373326 🔝 💃 Escor...
Independent Bangalore Call Girls (Adult Only) 💯Call Us 🔝 7304373326 🔝 💃 Escor...
 
(RIYA)🎄Airhostess Call Girl Jaipur Call Now 8445551418 Premium Collection Of ...
(RIYA)🎄Airhostess Call Girl Jaipur Call Now 8445551418 Premium Collection Of ...(RIYA)🎄Airhostess Call Girl Jaipur Call Now 8445551418 Premium Collection Of ...
(RIYA)🎄Airhostess Call Girl Jaipur Call Now 8445551418 Premium Collection Of ...
 
Call Girls in Lucknow Just Call 👉👉 8875999948 Top Class Call Girl Service Ava...
Call Girls in Lucknow Just Call 👉👉 8875999948 Top Class Call Girl Service Ava...Call Girls in Lucknow Just Call 👉👉 8875999948 Top Class Call Girl Service Ava...
Call Girls in Lucknow Just Call 👉👉 8875999948 Top Class Call Girl Service Ava...
 
Bhawanipatna Call Girls 📞9332606886 Call Girls in Bhawanipatna Escorts servic...
Bhawanipatna Call Girls 📞9332606886 Call Girls in Bhawanipatna Escorts servic...Bhawanipatna Call Girls 📞9332606886 Call Girls in Bhawanipatna Escorts servic...
Bhawanipatna Call Girls 📞9332606886 Call Girls in Bhawanipatna Escorts servic...
 
Goa Call Girl Service 📞9xx000xx09📞Just Call Divya📲 Call Girl In Goa No💰Advanc...
Goa Call Girl Service 📞9xx000xx09📞Just Call Divya📲 Call Girl In Goa No💰Advanc...Goa Call Girl Service 📞9xx000xx09📞Just Call Divya📲 Call Girl In Goa No💰Advanc...
Goa Call Girl Service 📞9xx000xx09📞Just Call Divya📲 Call Girl In Goa No💰Advanc...
 
Low Cost Call Girls Bangalore {9179660964} ❤️VVIP NISHA Call Girls in Bangalo...
Low Cost Call Girls Bangalore {9179660964} ❤️VVIP NISHA Call Girls in Bangalo...Low Cost Call Girls Bangalore {9179660964} ❤️VVIP NISHA Call Girls in Bangalo...
Low Cost Call Girls Bangalore {9179660964} ❤️VVIP NISHA Call Girls in Bangalo...
 
ANATOMY AND PHYSIOLOGY OF REPRODUCTIVE SYSTEM.pptx
ANATOMY AND PHYSIOLOGY OF REPRODUCTIVE SYSTEM.pptxANATOMY AND PHYSIOLOGY OF REPRODUCTIVE SYSTEM.pptx
ANATOMY AND PHYSIOLOGY OF REPRODUCTIVE SYSTEM.pptx
 
Dehradun Call Girls Service {8854095900} ❤️VVIP ROCKY Call Girl in Dehradun U...
Dehradun Call Girls Service {8854095900} ❤️VVIP ROCKY Call Girl in Dehradun U...Dehradun Call Girls Service {8854095900} ❤️VVIP ROCKY Call Girl in Dehradun U...
Dehradun Call Girls Service {8854095900} ❤️VVIP ROCKY Call Girl in Dehradun U...
 
Kolkata Call Girls Naktala 💯Call Us 🔝 8005736733 🔝 💃 Top Class Call Girl Se...
Kolkata Call Girls Naktala  💯Call Us 🔝 8005736733 🔝 💃  Top Class Call Girl Se...Kolkata Call Girls Naktala  💯Call Us 🔝 8005736733 🔝 💃  Top Class Call Girl Se...
Kolkata Call Girls Naktala 💯Call Us 🔝 8005736733 🔝 💃 Top Class Call Girl Se...
 
❤️Chandigarh Escorts Service☎️9814379184☎️ Call Girl service in Chandigarh☎️ ...
❤️Chandigarh Escorts Service☎️9814379184☎️ Call Girl service in Chandigarh☎️ ...❤️Chandigarh Escorts Service☎️9814379184☎️ Call Girl service in Chandigarh☎️ ...
❤️Chandigarh Escorts Service☎️9814379184☎️ Call Girl service in Chandigarh☎️ ...
 
Call Girls Rishikesh Just Call 9667172968 Top Class Call Girl Service Available
Call Girls Rishikesh Just Call 9667172968 Top Class Call Girl Service AvailableCall Girls Rishikesh Just Call 9667172968 Top Class Call Girl Service Available
Call Girls Rishikesh Just Call 9667172968 Top Class Call Girl Service Available
 
💚Chandigarh Call Girls Service 💯Piya 📲🔝8868886958🔝Call Girls In Chandigarh No...
💚Chandigarh Call Girls Service 💯Piya 📲🔝8868886958🔝Call Girls In Chandigarh No...💚Chandigarh Call Girls Service 💯Piya 📲🔝8868886958🔝Call Girls In Chandigarh No...
💚Chandigarh Call Girls Service 💯Piya 📲🔝8868886958🔝Call Girls In Chandigarh No...
 
Call Girl In Chandigarh 📞9809698092📞 Just📲 Call Inaaya Chandigarh Call Girls ...
Call Girl In Chandigarh 📞9809698092📞 Just📲 Call Inaaya Chandigarh Call Girls ...Call Girl In Chandigarh 📞9809698092📞 Just📲 Call Inaaya Chandigarh Call Girls ...
Call Girl In Chandigarh 📞9809698092📞 Just📲 Call Inaaya Chandigarh Call Girls ...
 
Cheap Rate Call Girls Bangalore {9179660964} ❤️VVIP BEBO Call Girls in Bangal...
Cheap Rate Call Girls Bangalore {9179660964} ❤️VVIP BEBO Call Girls in Bangal...Cheap Rate Call Girls Bangalore {9179660964} ❤️VVIP BEBO Call Girls in Bangal...
Cheap Rate Call Girls Bangalore {9179660964} ❤️VVIP BEBO Call Girls in Bangal...
 
ANATOMY AND PHYSIOLOGY OF RESPIRATORY SYSTEM.pptx
ANATOMY AND PHYSIOLOGY OF RESPIRATORY SYSTEM.pptxANATOMY AND PHYSIOLOGY OF RESPIRATORY SYSTEM.pptx
ANATOMY AND PHYSIOLOGY OF RESPIRATORY SYSTEM.pptx
 
Call Girls Kathua Just Call 8250077686 Top Class Call Girl Service Available
Call Girls Kathua Just Call 8250077686 Top Class Call Girl Service AvailableCall Girls Kathua Just Call 8250077686 Top Class Call Girl Service Available
Call Girls Kathua Just Call 8250077686 Top Class Call Girl Service Available
 
💚Call Girls In Amritsar 💯Anvi 📲🔝8725944379🔝Amritsar Call Girl No💰Advance Cash...
💚Call Girls In Amritsar 💯Anvi 📲🔝8725944379🔝Amritsar Call Girl No💰Advance Cash...💚Call Girls In Amritsar 💯Anvi 📲🔝8725944379🔝Amritsar Call Girl No💰Advance Cash...
💚Call Girls In Amritsar 💯Anvi 📲🔝8725944379🔝Amritsar Call Girl No💰Advance Cash...
 
Call girls Service Phullen / 9332606886 Genuine Call girls with real Photos a...
Call girls Service Phullen / 9332606886 Genuine Call girls with real Photos a...Call girls Service Phullen / 9332606886 Genuine Call girls with real Photos a...
Call girls Service Phullen / 9332606886 Genuine Call girls with real Photos a...
 
Call Girls Bangalore - 450+ Call Girl Cash Payment 💯Call Us 🔝 6378878445 🔝 💃 ...
Call Girls Bangalore - 450+ Call Girl Cash Payment 💯Call Us 🔝 6378878445 🔝 💃 ...Call Girls Bangalore - 450+ Call Girl Cash Payment 💯Call Us 🔝 6378878445 🔝 💃 ...
Call Girls Bangalore - 450+ Call Girl Cash Payment 💯Call Us 🔝 6378878445 🔝 💃 ...
 

Demystifying clinical electrocardiography august, 2013

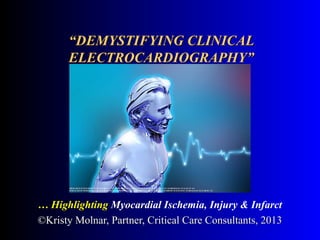
  • 1. ““DEMYSTIFYING CLINICALDEMYSTIFYING CLINICAL ELECTROCARDIOGRAPHY”ELECTROCARDIOGRAPHY” …… HHighlightingighlighting Myocardial Ischemia, Injury & Infarct ©Kristy Molnar, Partner, Critical Care Consultants, 2013©Kristy Molnar, Partner, Critical Care Consultants, 2013
  • 2. PHILIPS HEALTHCARE Patient Care & Clinical Informatics
  • 3. Continuing Education for Healthcare Professionals EDUCATIONALEDUCATIONAL SERVICESSERVICES © Copyright, 2013 Critical Care Consultants Kristy Molnar
  • 4. Partner, Nursing Education Consultant CRITICAL CARE CONSULTANTS
  • 5.
  • 7. Goals of ECG MonitoringGoals of ECG Monitoring To detect and document cardiacTo detect and document cardiac arrhythmiasarrhythmias To detect and document ST changes andTo detect and document ST changes and evolving ischemiaevolving ischemia To detect prolonged QT interval syndromeTo detect prolonged QT interval syndrome To evaluate the effectiveness of treatmentTo evaluate the effectiveness of treatment
  • 8. We’ve come a LONG Way!We’ve come a LONG Way!
  • 10. Goals of ECG MonitoringGoals of ECG Monitoring In order to meet the goals of ECG monitoring, it should ideally be continuous and should reflect a minimum of 12 leads simultaneously. Ideally 16 leads
  • 11. Goals of ECG MonitoringGoals of ECG Monitoring Comprehensive arrhythmia diagnosis often requires a MULTI-LEAD perspective, Ischemia detection can only occur IF the associated leads are viewed, Transient events of diagnostic/therapeutic importance may not persist LONG ENOUGH to allow documentation with a standand ECG.
  • 12. Patient Monitoring Survey-Patient Monitoring Survey- THEN vs NOWTHEN vs NOW Independent survey at AACN’s Advanced Practice Institute Conference (1998) N=400 (Acute care Nurses and Clinical Specialists) 69% of respondents did not have the clinical capability 31% had the ability to monitor continuous 12-Lead ECG.
  • 13. Continuous ECG MonitoringContinuous ECG Monitoring Those using continuous 12-Lead ECG monitoring indicated that their primary reasons are for: – assessment of cardiac condition – changes in condition – differentiation of abnormal or irregular rhythms.
  • 14. Continuous ECG MonitoringContinuous ECG Monitoring The reasons for infrequent use included lack of training, “not a requirement”, and no perceived need. 66% of participants responded that there were barriers to continuous 12-lead monitoring … number of electrodes … lack of training was the primary barrier
  • 15. The IdealThe Ideal Monitoring Situation:Monitoring Situation: Continuous, real-time Multi-lead perspective Sensitive and specific Convenient and stable electrode positions Easy to landmark (consistent, quick and reproducible) Patient comfort and low interference with clinical procedures.
  • 16. 2004 Practice Standards …2004 Practice Standards …
  • 17. Practice Standards,Practice Standards, the beginningthe beginning Source: Drew, BJ et al Circulation, 2004 October 26; 110(17):2721-46. Full text article: www.circ.ahajournals.org Guidelines: www.guideline.gov
  • 18. 2009 AHA, ACC, HRS Practice Standards2009 AHA, ACC, HRS Practice Standards Recommendations for the Standardization and Interpretation of the Electrocardiogram – Part IV (Feb. 19, 2009)
  • 19. Learning Needs? …Learning Needs? … it appears so!it appears so!
  • 20. Ongoing Investigations …Ongoing Investigations … 20132013
  • 21. Review of ElectrocardiographicReview of Electrocardiographic PrinciplesPrinciples Functional Anatomy & Physiology
  • 22. Electrical SystemElectrical System The heart has an intrinsic electrical system that allows for the origination and transmission of an electrical impulse. – The electrical stimulus (initiating factor) – Depolarization (proliferating factor)
  • 23. Cardiac Cell PropertiesCardiac Cell Properties Automaticity Excitability Conductivity Contractility
  • 24. Electrical Conduction SystemElectrical Conduction System SA Node “Internodal Pathways” AV Junction Bundle of His Bundle Branches Purkinje Fibres
  • 25. Sinoatrial (SA) NodeSinoatrial (SA) Node Right atrium (superior, right orientation) Close to the superior vena cava Specialized piece of conduction tissue with the property of automaticity. 60-100 bpm, fastest rate of automaticity normally, thereby setting the pace of the heart.
  • 26. The SA Node -The SA Node - Automaticity & ExcitabiltyAutomaticity & Excitabilty  Innervated by the autonomic nervous system.  Sympathetic stimulation can accelerate the SA node up to a rate of 150-160/min.  Parasympathetic stimulation can slow the heart rate to less than 60/min.  If the heart was separated from the body’s nervous system, the SA node could still initiate its own impulses.
  • 27. ConductivityConductivity Once an electrical stimulus is originated, it spreads throughout the remainder of the conduction system and the heart muscle.
  • 28. ConductivityConductivity When the impulse is released from the SA node, it travels throughout the atria, causing them to depolarize and subsequently, contract. The depolarization wave arrives at the AV node, which is located on the inferior-right side of the intra-atrial septum.
  • 29. ConductivityConductivity The wave is delayed there for approximately .10 seconds before arriving at the Bundle of His … allowing for atrial contraction to precede ventricular contraction (contributing to adequate ventricular filling, an additional 20-30% of preload).
  • 30. AV JunctionAV Junction Under normal conditions, the AV junctional tissue is not the pacemaker of the heart – since it has a lower rate of automaticity than the SA Node. The rate of impulse formation in the AV junctional tissue is normally 40-60/min.
  • 31. A-V ConductionA-V Conduction The cardiac impulse spreads to the thin bundle of “threads” known as the bundle of His The bundle of His connects the AV junction to the bundle branches (located in the right side of the intra-atrial septum just above the ventricles)
  • 32. Intraventricular ConductionIntraventricular Conduction The conduction structures in the ventricles consist of the conduction structures below the bundle of His, also known as the His- Purkinje network. The impulse passes down the Left and Right bundle branches in a sequential fashion.
  • 34. Bundle Branch ConductionBundle Branch Conduction Repolarization is faster in the Left Bundle Branch, therefore it is ready to conduct earlier than the Right Bundle Branch. Conduction of the impulse is normally Left before Right.
  • 35. Left vs. Right Bundle BranchLeft vs. Right Bundle Branch The Right bundle is a slender fascicle that runs along the right side of the intraventicular septum and supplies the electrical impulses to the Right ventricle. The Left bundle supplies the electrical impulses to the Left ventricle. It runs along the left side of the intraventricular septum and divides almost immediately into an anterior and posterior division (fascicle).
  • 36. Divisions of the Left BundleDivisions of the Left Bundle Anterior Fascicle – much longer and thinner of the two and supplies the anterior and superior portions of the Left Ventricle with electrical impulses Posterior Fascicle – shorter and thicker and supplies the posterior and inferior portions of the Left Ventricle with electrical impulses.
  • 37. Purkinje Network (Fibers)Purkinje Network (Fibers) The bundle branches terminate in a network of fibers that are located in both the left and right ventricular walls. The impulse travels into the Purkinje Fibers and cause ventricular depolarization (and subsequently, contraction)
  • 38. What is anWhat is an Electrocardiogram?Electrocardiogram?
  • 39. Electrocardiogram (ECG)Electrocardiogram (ECG) Depolarization and subsequent Repolarization spreading throughout the heart can be recorded (on paper or electronically) Recorded process is called the electrocardiogram. Changes in cellular polarity (charges) occurring during depolarization and repolarization produces deflections on the recording, forming an “ECG complex”.
  • 41. ““P,Q,R,S,T & U”P,Q,R,S,T & U” Waves, Complexes, Intervals & Segments
  • 42.
  • 43. Waves and ComplexesWaves and Complexes Deviations from isoelectric Positive or Negative? May be Biphasic, Notched or “Flattened” A complex may contain multiple waves
  • 44. P waveP wave Atrial depolarization P wave = Atrial Depolarization Upright and slightly rounded < 2.5 mm amplitude; 2.5 small squares (.10 sec) duration; not notched or peaked Ta wave (Repolarization) normally not seen – coincides with QRS … opposite polarity to P wave
  • 45. QRS ComplexQRS Complex Wave of depolarization reaches the ventricular myocardium via the Purkinje fibres Ventricular depolarization Represented by the “QRS” complex
  • 46. Morphology of QRSMorphology of QRS Complexes – “Rules”Complexes – “Rules” QRS may be composed of a Q wave, R wave and an S wave, or various combinations Positive versus Negative deflections? R is always positive Q and S are always negative Q must precede an R S must follow an R
  • 47. Morphology of QRSMorphology of QRS Complexes – “Questions”Complexes – “Questions” R wave? Q wave or a q wave? S wave? QS complex or a pathological Q? RsR1 and other configurations?
  • 48. Examples of QRS ComplexesExamples of QRS Complexes
  • 49. Changes in R waveChanges in R wave or a new Q wave?or a new Q wave? R wave changes can be clinically significant in an acute situation (conduction abnormality or decrease in depolarization forces) … CAUTION – Lead Placement & Filters What about the development of a new Q wave?
  • 50. T waveT wave Ventricular repolarization is represented by the T wave Normally upright and slightly rounded Same polarity as mean QRS vector Should not exceed 1/3-1/4 of the total QRS height
  • 51. U waveU wave Sometimes seen after a T wave Thought to relate to events of later repolarization of the ventricles Same polarity as the T wave
  • 52. Intervals and SegmentsIntervals and Segments Intervals contain waves Segments are between the waves
  • 53. PR IntervalPR Interval From the beginning of the P wave to the beginning of the QRS complex. Represents depolarization of the atria and the spread of the depolarization wave up to and including the Purkinje fibres
  • 54. His Bundle ElectrocardiogramHis Bundle Electrocardiogram
  • 55. PR SegmentPR Segment Represents the period of time between the P wave and the subsequent QRS complex. This should be isoelectric ? PR sagging … atrial repolarization abnormalities
  • 56. QRS IntervalQRS Interval  Should be less than . 10 sec in duration  Duration of .10 or > should be suspect  R-wave should not be slanted or slurred  No notching of R or S
  • 57. Intervals and Segments –Intervals and Segments – VATVAT  Ventricular Activation Time (VAT)  Beginning of the QRS to the peak of the R wave (or R1 )  Time necessary for the depolarization wave to travel from the endocardium to the epicardium  Time longer for LV than RV due to relative muscle mass  Earlier & more sensitive indicator than a global increase in QRS duration
  • 59. ST SegmentST Segment From the end of the QRS complex (at junction point) to the onset of the ascending limb of the T wave Should be isoelectric … look for depression or elevation
  • 60. ST SegmentST Segment Sensitive indicator of myocardial ischemia or injury!!
  • 61. QT IntervalQT Interval The time from the beginning of the QRS complex to the end of the T wave Represents both ventricular depolarization and repolarization Prolongation increases the risk of significant dysrhythmias QTc an important calculation and ongoing assessment criteria
  • 63.
  • 64. QT/QTc Interval MonitoringQT/QTc Interval Monitoring Who, What, When, Where, Why??
  • 65. Importance – and challenge –Importance – and challenge – of QT monitoringof QT monitoring QT prolongation can indicate a risk of severe arrhythmias, torsades de pointes, and sudden cardiac death.
  • 66. Significance of QTcSignificance of QTc MonitoringMonitoring
  • 67. Importance – and challenge –Importance – and challenge – of QT monitoringof QT monitoring A growing number of anti-arrhythmic, anti- psychotic, and antibiotic medications can cause QT prolongation A combination of variables can put your patient at risk.
  • 68. Increased Risk for TorsadesIncreased Risk for Torsades de Pointesde Pointes QT prolonging drugs (this list is LONG) Females Older Patients Bradycardia Impaired LV function (ischemia, LV hypertrophy) Hypokalemia Hypomagnesemia
  • 69. QT and QTcQT and QTc The QT has an inverse relationship to HR. QT = QTc at a HR of 60 bpm only Heart rate corrected QT interval is abbreviated as QTc Correction formulas, including the Bazett and Fridericia, are population based & may not be representative for a particular patient Drugs may also change the relationship between QT and HR
  • 70. Normal QTc values?Normal QTc values? Regardless of the 4 correction formulas used, a QTc of < 460 ms in women and < 460 ms in men is considered normal. Clinical Guidelines suggest that Bazett and Fridericia formulas be included in all drug study submissions. Philips defaults to Bazett, but the configuration supports both.
  • 71. CompatibilityCompatibility Continuous QT/QTc measurement is part of the Philips ST/Arrhythmia algorithm Available on all IntelliVue Patient Monitors, Information Centre and Telemetry Systems. 3-Lead, 5-Lead, 6-Lead, EASI-derived 12- Lead & 12-Lead systems
  • 72.
  • 73.
  • 75. Understanding MonitoringUnderstanding Monitoring Principles and ConceptsPrinciples and Concepts Vectors, Leads, Polarity and Deflections … How are they all related?
  • 76. Recording of Electrical ForcesRecording of Electrical Forces – The Lead Concept– The Lead Concept A lead is an electrical system to record electrical activity Multiple Leads are used in cardiac monitoring and ECG recording systems A lead is composed on a negative and a positive pole Sense the direction and magnitude of electrical forces
  • 77. Recording of Electrical ForcesRecording of Electrical Forces – The Lead Concept– The Lead Concept Record surface information from different regions (or walls) of the myocardium. The positive pole on any respective lead is the “sensing electrode” It records electrical activity according to its perspective only (narrow and limited view)
  • 78. Recording of Electrical ForcesRecording of Electrical Forces – The Lead Concept– The Lead Concept Electrical forces traveling TOWARD a positive pole, will be recorded as a POSITIVE (upright) deflection. Forces traveling AWAY FROM the leads positive pole (toward it’s negative pole) will be recorded as a NEGATIVE (downwards) deflection.
  • 79. The Positive Electrode’s ViewThe Positive Electrode’s View TOWARD = POSITIVE DEFLECTION AWAY = NEGATIVE DEFLECTION
  • 80. Planes of the HeartPlanes of the Heart Frontal Horizontal Sagittal
  • 82. The 6 Frontal Plane LeadsThe 6 Frontal Plane Leads Lead I Lead II Lead III aVR aVL aVF
  • 84. The Horizontal Plane LeadsThe Horizontal Plane Leads  V1  V2  V3  V4  V5  V6
  • 85. The Horizontal Plane LeadsThe Horizontal Plane Leads  (V7)  (V8)  (V9)  V1R  V2R  V3R  V4R  V5R  V6R
  • 87. Standard 12 LeadStandard 12 Lead 2D - Frontal and Horizontal Plane Views
  • 88. Bipolar LeadsBipolar Leads Each lead has two physical poles, a positive pole and a negative pole Lead I, II and III (also referred to as limb leads or extremity leads, because of their placement on the body) Einthoven’s Triangle
  • 89. Einthoven’s 1st ECG MachineEinthoven’s 1st ECG Machine 1896 1912 Leads I, II and III form the equilateral “Einthoven’s Triangle”
  • 91. Placement of Limb LeadsPlacement of Limb Leads
  • 92. Formation of the Triaxial SystemFormation of the Triaxial System
  • 93. Unipolar LeadsUnipolar Leads Many years following Einthoven’s simple invention, the ECG was improved by adding the unipolar leads (Wilson, 1934) These leads are unipolar since there is only a designated positive electrode The negative pole is electrically averaged by the ECG machine and the voltage augmented (Goldberger, 1942)
  • 94. Unipolar LeadsUnipolar Leads Augmented (by 50%) Voltage … Right, Left, Foot aVR, aVL, aVF
  • 95. aVR, aVL, aVFaVR, aVL, aVF Unipolar Augmented Leads – Frontal Plane
  • 96. Frontal Plane LeadsFrontal Plane Leads The Hexaxial SystemThe Hexaxial System
  • 97. Horizontal Plane LeadsHorizontal Plane Leads  The horizontal plane is traditionally viewed by six unipolar leads … additional leads are sometimes applied.  Also referred to as “Precordial Leads”, “Chest Leads” or “V Leads”  Positive pole is determined by the physical placement on the chest  The negative pole is electrically averaged (from all three extremity electrodes) and is situated somewhere in the middle of the chest cavity.
  • 98. Horizontal Plane LeadsHorizontal Plane Leads The “V” or Chest LeadsThe “V” or Chest Leads
  • 99. Anatomical Landmarking ofAnatomical Landmarking of Chest LeadsChest Leads V1 – 4th ICS immediately to the right of the sternum V2 – 4th ICS immediately to the left of sternum V3 – Directly between V2 and V4 V4 – 5th ICS, left mid-clavicular line V5 – 5th ICS, left anterior axillary line V6 – 5th ICS, left mid-axillary line
  • 101. Placement of Chest LeadsPlacement of Chest Leads 2 3 4 5
  • 102. The Resultant 12 LeadsThe Resultant 12 Leads
  • 103. Right-sided Chest LeadsRight-sided Chest Leads V1R– 4th ICS immediately to the left of the sternum V2R – 4th ICS immediately to the right of sternum V3R – Directly between V2R and V4R V4R – 5th ICS, right mid-clavicular line V5R – 5th ICS, right anterior axillary line V6R – 5th ICS, right mid-axillary line MIRROR IMAGE OF LEFT-SIDED CHEST LEADS
  • 104. Right Ventricular LeadsRight Ventricular Leads
  • 105. Right Ventricular InfarctRight Ventricular Infarct
  • 106. Posterior Chest LeadsPosterior Chest Leads V7 – 5th ICS posterior axillary line V8 – 5th ICS midscapular line V9 – 5th ICS midspinal line EXTENSION OF LEADS TO LATERAL-POSTERIOR
  • 107. 12-Lead Electrocardiogram12-Lead Electrocardiogram Lead Options for Clinical Monitoring and Diagnostic Purposes
  • 108. Lead Options for ClinicalLead Options for Clinical Monitoring and DiagnosisMonitoring and Diagnosis CONVENTIONAL: 10 Leads applied with Standard Limb Lead placement MODIFIED: 10 Leads applied with Modified Limb Lead placement (Mason- Likar, 1966 - for exercise testing) EASITM Lead Placement: 5 Leads (derived 12-Lead, using vectorcardiography)
  • 109. Conventional versus ModifiedConventional versus Modified Lead Placement for 12 LeadLead Placement for 12 Lead CONVENTIONAL (Standard): Limb electrode placement on the limbs (forearms and lower legs) MODIFIED (Mason-Likar): Limb electrode placement on the torso (in same locations, as used for standard continuous ECG monitoring ... BUT!) Modified lead placement not to be used for Diagnostic ECG Interpretation
  • 110. EASIEASI® 12 Lead® 12 Lead Continuous, Real-time & Trending 12-Lead and ST Segment Monitoring
  • 111. EASIEASI® 12 Lead® 12 Lead Provides 12-lead data from 5 electrodes, instead of the standard 10 electrode system. Uses vectorcardiography, with leads placed in a modified X,Y, Z configuration When compared to conventional 5-Lead ECG monitoring systems, EASI provides more data and has been shown to be superior at detecting myocardial ischemia and cardiac arrhythmias.
  • 112. EASIEASI® 12 Lead® 12 Lead Innovative, clinically validated approach to ECG monitoring Derivation of 12 ECG leads using a 5- electrode configuration Science behind EASI is based on Dr. Gordon Dower’s adaptation of 3-D vectorcardiography (modified Frank vector leads)
  • 113. EASIEASI® 12 Lead® 12 Lead Innovative, clinically validated approach to ECG monitoring Derivation of 12 ECG leads using a 5- electrode configuration EASI 12-Lead algorithm derives full 12- lead ECG data to detect and document cardiac arrhythmias and ST changes under continuous monitoring conditions across the care continuum.
  • 115. 3 EASI3 EASI® Vectors® Vectors E = Lower Sternum (Brown) A = 5th ICS, Right MAL (Red) S = Upper Sternum (Black) I = 5th ICS, Left MAL (White)  Lead ES S (-) to E (+)  Lead AS S (-) to A (+)  Lead AI I (-) to A (+)
  • 116. 3 EASI3 EASI® Vectors® Vectors
  • 117. Clinical Advantages ofClinical Advantages of EASIEASI® 12 Lead® 12 Lead Convenient, stable electrode positions on obvious anatomical landmarks enhancing access, accuracy and reproducibility Need for fewer electrodes increases patient comfort and mobility Ease of use results in time savings for care givers
  • 118. Clinical Advantages ofClinical Advantages of EASIEASI® 12 Lead® 12 Lead Innovative lead configuration achieves superior signal-to-noise ratios Left precordium is always free … low interference with clinical procedures supports consistent 12-Lead information across the care continuum (physical exam, CXR, echocardiography, emergency resuscitation etc.)
  • 119. Clinical Advantages ofClinical Advantages of EASIEASI® 12 Lead® 12 Lead Ability to capture dynamic changes that may be missed using an ECG cart, since transient events of diagnostic/therapeutic importance may not persist long enough to capture. With EASI, transient events can be documented with full 12-Lead ECG under continuous monitoring conditions.
  • 120. EASIEASI® 12 Lead® 12 Lead When compared to standard 12-Lead ECG’s, EASI derived 12-Lead is diagnostically comparable for detection of cardiac arrhythmias, myocardial ischemia, and myocardial infarction (the most common clinical applications for cardiac monitoring)
  • 121. How Good is EASIHow Good is EASI® 12 Lead® 12 Lead  99% correlation between standard ECG monitoring and EASI for Ischemia  Excellent agreement between 2 methods for Rate, Rhythm and Intervals  Perfect agreement for Arrhythmia recognition  84-99% correlation for Axis determination  90% and above for acute and prior MI recognition  (Undetermined for atrial enlargement and ventricular hypertrophy … chronic conditions)
  • 122. Interpreting theInterpreting the EASIEASI® 12 Lead® 12 Lead  The derived EASI 12-lead is approached the same way as a standard 12-lead … all principles remain the same in terms of interpretation.  EASI should be used as a trending tool & as a dynamic clinical assessment tool (Monitoring)  Baseline EASI 12-lead should be compared to any changes, as is done with a conventional 12-lead.  EASI 12-lead is not meant to replace a standard 12-lead in terms of diagnostic value, but used in combination as a clinical assessment tool.
  • 123. Technical ConsiderationsTechnical Considerations Lead Placement & Vectors (Thoracic versus Limb) Millivolt and Standard Filters
  • 124. Back to the Application Stuff!Back to the Application Stuff!
  • 125. Clinical Correlation:Clinical Correlation: Arterial Blood Supply & ECGArterial Blood Supply & ECG
  • 126. Right VentricleRight Ventricle Right Coronary Artery (RCA)
  • 127. Inferior Wall of Left VentricleInferior Wall of Left Ventricle Right Coronary Artery (RCA)
  • 128. Posterior Wall of Left VentriclePosterior Wall of Left Ventricle Right Coronary Artery (RCA) (Left Circumflex)
  • 129. Anterior Wall of Left VentricleAnterior Wall of Left Ventricle Left Anterior Descending (LAD) branch of Left Coronary Artery Septal Branch
  • 130. Lateral Wall of Left VentricleLateral Wall of Left Ventricle Circumflex branch of Left Coronary Artery
  • 131. ApexApex RCA or LAD or Circumflex
  • 132. A Diagrammatic PerspectiveA Diagrammatic Perspective It is the LEFT ventricle which contributes the forces when viewing the 12 Lead ECG
  • 133. Cube ConceptCube Concept Septal/Anterior Apical Lateral Inferior Endocardial (Posterior) Each “face” of the cube represents a different Left Ventricular wall Right Ventricle
  • 134. Inferior LeadsInferior Leads Leads II, III and aVF Leads III, aVF, II
  • 135. Anterior or Anteroseptal LeadsAnterior or Anteroseptal Leads V1 through V6 (septal + anterior + apical) V1-V2 Septal; V3-V4 Anterior or Mid- Precordial;V5-V6 Apical V1, V2, V3, V4 and V5, V6
  • 136. Apical (Low Lateral) LeadsApical (Low Lateral) Leads V5 and V6 (Lead II)
  • 138. (Posterior Leads)(Posterior Leads) Viewed as mirror-image changes in V1-V2
  • 140. Right Ventricular LeadsRight Ventricular Leads V3R and V4R!! (ST > Lead III than in Lead II and aVF)*
  • 141. The “Cone” PerspectiveThe “Cone” Perspective L. Schamroth
  • 143. PolarityPolarity An impulse traveling toward a positive electrode will be recorded as positive … an impulse traveling away from a positive electrode will be recorded as negative There are, however, varying degrees of positivity and negativity represented by various ECG waveforms
  • 144. PolarityPolarity  A lead measures electrical activity within an electrical field  The field is divided into a positive half and a negative half Any impulse that falls within the positive half of the electrical field will result in a positive complex, and any that fall within the negative half will result in a negative complex.
  • 145. Positive & Negative FieldsPositive & Negative Fields  The more PARALLEL the impulse is to the lead orientation, the TALLER the complex. As the impulse becomes more PERPENDICULAR to the lead orientation, it becomes more ISOELECTRIC
  • 146. ExploringExploring thethe ElectricalElectrical Activation of the HeartActivation of the Heart
  • 147. Wave of DepolarizationWave of Depolarization The anatomic position of the heart must also be considered, since it is the actual position of the heart that influences the net direction of electrical activity. It is this NET direction that is recorded on the ECG
  • 148. Wave of DepolarizationWave of Depolarization  Frontal Plane view of mean wave of depolarization  Left-sided leads will record the activity opposite to Right- sided leads
  • 149. Wave of DepolarizationWave of Depolarization  Even on a single plane, electrical activity can be viewed in several directions at once.  Imagine a “tug-of- war” between the LV and RV
  • 150. Ventricular DominanceVentricular Dominance To apply this concept to venticular activation, recall that the right ventricle is a thin-walled chamber with only one conduction pathway. The left ventricle is a thicker muscle mass and has two branches in it’s conduction system.
  • 151. Net Direction or VectorNet Direction or Vector  Even though the electrical activity of the heart is travelling in many directions at once, one general direction predominates and can be determined by averaging all of the forces.
  • 153. Introducing the 12 LeadIntroducing the 12 Lead ElectrocardiogramElectrocardiogram “Mapping the Heart’s Spark”
  • 154.
  • 155. "The Traditional 12 Leads""The Traditional 12 Leads" FRONTAL PLANE: I II III aVR aVL aVF
  • 156. Lead I (Lateral)Lead I (Lateral) 0 degrees (LCx)0 degrees (LCx) RA- …. LA+ P upright Q small or none R dominant S < R or none ST Isoelectric (+1 to –0.5) T upright
  • 157. Lead II (Inferior/Left)Lead II (Inferior/Left) + 60 degrees (RCA)+ 60 degrees (RCA) RA- …. LL+ P upright Q small or none R dominant S < R or none ST Isoelectric (+1 to –0.5) T upright
  • 158. Lead III (Inferior/Right)Lead III (Inferior/Right) +120 (RCA)+120 (RCA) LA- … LL+ P upright, flat, diphasic, inverted Q small or none R none, diphasic to dominant S none to dominant ST Isoelectric (+1 to –0.5) T upright, flat, diphasis, inverted
  • 159. Lead aVR (Endocardial)Lead aVR (Endocardial) - 150 degrees (global)- 150 degrees (global) RA+ P inverted Q small, none, large R small or none S dominant ST Isoelectric (+1 to –0.5) T inverted
  • 160. Lead aVL (Lateral)Lead aVL (Lateral) - 30 degrees (LCx)- 30 degrees (LCx) LL+ P upright, flat, diphasic, inverted Q small, none, large R small, none, dominant S small, none, dominant ST Isoelectric (+1 to –0.5) T upright, flat, diphasic, inverted
  • 161. Lead aVF (Inferior)Lead aVF (Inferior) +90 degrees (RCA)+90 degrees (RCA) LL+ P upright, flat, diphasic, inverted Q small or none R small, none, dominant S small, none, dominant ST Isoelectric (+1 to –0.5) T upright
  • 162. "The Traditional 12 Leads""The Traditional 12 Leads" HORIZONTAL PLANE: V1 V2 V3 V4 V5 V6
  • 163. Lead V1 (Septal)Lead V1 (Septal) LAD-Septal branchLAD-Septal branch 4 ICS RSB P upright, flat, diphasic Q none, may be QS R < S or none S dominant ST 0 to +3 T upright, flat, diphasic, inverted
  • 164. Lead V2 (Septal)Lead V2 (Septal) LAD-Septal branchLAD-Septal branch 4 ICS LSB P upright Q none R < S S dominant ST 0 to +3 T upright, diphasic, inverted
  • 165. Lead V3 (Anterior)Lead V3 (Anterior) LADLAD Between V2 and V4 P upright Q small or none R ~ S S ~ R ST 0 to +3 T upright
  • 166. Lead V4 (Anterior)Lead V4 (Anterior) LADLAD 5ICS LMCL P upright Q small or none R > S S < R ST +1 to 0.5 T upright
  • 167. Lead V5 (Apical)Lead V5 (Apical) VariableVariable 5ICS LAAL P upright Q small R Dominant S small (< V4) ST +1 to 0.5 T upright
  • 168. Lead V6 (Apical)Lead V6 (Apical) VariableVariable 5ICS MAL P upright Q small R Dominant S none ST +1 to 0.5 T upright
  • 169. “Putting the Leads Together” Frontal Plane Horizontal Plane
  • 170. ““AdditionalAdditional Leads"Leads" HORIZONTAL PLANE: Right-Sided Leads V1R V2R V3R V4R V5R V6R
  • 172. "Systematic Approach""Systematic Approach" to the Electrocardiogramto the Electrocardiogram
  • 173. A Systematic ApproachA Systematic Approach Establish underlying rhythm (atrial & ventricular rates, PR interval, AV conduction) Measure the QRS (including VAT) and QT interval Determine the Mean Frontal Plane Axis
  • 174. A Systematic ApproachA Systematic Approach Screen For:  Conduction Delays (based on prior assessment) – Atrioventricular and/or Intraventricular  Presence of Ischemia, Injury & Infarction  Endocardial or Epicardial abnormalities  Chamber Enlargement – Atrial and/or Ventricular  Other – Electrolyte Abnormalities – Drug Effects
  • 175. A Systematic ApproachA Systematic Approach Interpretation and Documentation: Primary Rhythm Conduction Disturbances Secondary Rhythm (e.g. junctional escape) Other abnormalities (ST, T, QT) Significance? Management?
  • 176. The Electrical AxisThe Electrical Axis
  • 177. Axis … No Problem!Axis … No Problem!
  • 178.
  • 179. The Electrical AxisThe Electrical Axis Intensity and direction that the electrical impulse takes during depolarization & repolarization The general, mean or dominant direction of the various vectors is known as the MEAN VECTOR, and electrocardiographically as the MEAN QRS AXIS
  • 180. The Electrical AxisThe Electrical Axis The electrical axis is determined by: Magnitude Direction Polarity It’s direction is determined from the frontal plane (“rotation” on the horizontal plane)
  • 181. Significance of theSignificance of the Electrical AxisElectrical Axis “The use of the Electrical axis in the clinical interpretation of the electrocardiogram constitutes a most important diagnostic procedure and elevates electrocardiographic interpretation from the empirical to the deductive.” Leo Schamroth. The Electrical Axis. It’s determination and significance.
  • 182. Application of QRS AxisApplication of QRS Axis Differentiation of different types of MI’s Ventricular Dominance Ventricular Ectopy vs Aberrancy Hemiblocks Pacemaker Function W-P-W Syndrome Dextrocardia
  • 183. (Application of P Wave Axis)(Application of P Wave Axis) P pulmonale P congenitale Retrograde activation of the atrium
  • 184. (Application of T Wave Axis)(Application of T Wave Axis) Ventricular hypertrophy Coronary insufficiency Fully evolved phase of acute myocardial infarction
  • 185. (Application of ST Axis)(Application of ST Axis) Infarction Subendocardial vs. Subepicardial injury
  • 186. Calculating the MeanCalculating the Mean QRS AxisQRS Axis
  • 187. Determination of the AxisDetermination of the Axis There are several methods for estimation of the frontal plane axis. Ideal method would be both the most simplistic and accurate, thus lending itself to efficient clinical application.
  • 188. Steps for Calculation of AxisSteps for Calculation of Axis 1. Most equiphasic or smallest complex on frontal plane? 2. Which lead is 900 (perpendicular) to this lead? 3. Is this lead mostly positive or negative? If positive, go to the positive pole … if negative, go to the negative pole 4. Axis?
  • 189.
  • 190.
  • 191. Lead AssociationsLead Associations For any lead, there is another lead that is always perpendicular to it, and visa versa Perpendicular to a bipolar lead is always an associated unipolar lead, and visa versa Example: look at Lead II … what lead is perpendicular to Lead II? (Lead II also then must divide that lead into a positive and a negative field)
  • 193. Memory TrickMemory Trick I … aVF II … aVL III … aVR
  • 195. Abnormal Axis orAbnormal Axis or ReversedReversed Arm ElectrodesArm Electrodes?!??!?
  • 201. Determination of theDetermination of the Electrical AxisElectrical Axis
  • 203. ECG Patterns of Ischemia,ECG Patterns of Ischemia, InjuryInjury && InfarctInfarct Clinical Recognition
  • 204. Ischemia, Injury & InfarctIschemia, Injury & Infarct Myocardial Oxygenation – Supply – Demand Regional versus Global deficits
  • 205. Ischemia, Injury & InfarctIschemia, Injury & Infarct Myocardial ischemia is often missed in cases of silent ischemia ST segment monitoring, though not the most specific or sensitive, is the only technology that can be applied continuously (it is also non-invasive) Silent Ischemia is as clinically significant as that associated with chest pain … Total!
  • 206. Ischemia, Injury & InfarctIschemia, Injury & Infarct One must also correlate the coronary arterial blood supply to the various structures to the regions on the ECG and other clinical considerations … Without making this correlation, clinical significance of ECG changes is questionable.
  • 207. Right Coronary ArteryRight Coronary Artery Right Atrium Right Ventricle Inferior wall of Left Ventricle Posterior wall of Left Ventricle Posterior 1/3 of Intra-Ventricular Septum SA node in 65% of population AV node in 90% of population Posteroinferior Division of Left Bundle Branch
  • 208. Left Anterior DescendingLeft Anterior Descending Branch of Left Coronary ArteryBranch of Left Coronary Artery Anterior wall of Left Ventricle Anterior 2/3 of Intra-Ventricular Septum (Apex of the Left Ventricle) Bundle of His Right Bundle Branch Both Divisions of Left Bundle Branch
  • 209. Left Circumflex Branch of LeftLeft Circumflex Branch of Left Coronary ArteryCoronary Artery Left Atrium Lateral wall of Left Ventricle (Posterior wall of Left Ventricle) (Posterior 1/3 of Intra-Ventricular Septum) SA node in 45% of population AV node in 10% of population
  • 210. Coronary CirculationCoronary Circulation One must remember that this is a general description of coronary circulation, and applies to the majority of the population. Individual variations in the coronary vasculature are infinite, which explains the varying ECG manifestations that may be seen!
  • 211. ECG ManifestationsECG Manifestations The surface electrocardiogram (ECG) is the most common noninvasive diagnostic technique utilized to determine the presence and location of myocardial infarction. The limitations include not having enough leads to view all regions, being an intermittent assessment, and non-specific findings.
  • 212. The ECG as a Diagnostic ToolThe ECG as a Diagnostic Tool The ECG is but one clinical assessment tool used in the diagnosis of Acute Myocardial Ischemia, Injury and Infarction. Used in combination with History, Clinical Assessment and Biochemical Markers, it becomes an invaluable tool.
  • 213.
  • 214.
  • 215.
  • 216. ZonesZones Infarct, Injury & IschmiaInfarct, Injury & Ischmia Note: Degree of involvement between Endocardium and Epicardium
  • 218. Repolarization the Key!Repolarization the Key! Repolarization requires sufficient energy in the form of ATP … The Ventricular repolarization process is normally reflected by the T wave (and U wave) Early repolarization abnormalities will manifest itself in the ST segment … resulting in ST segment changes (repolarization wave shifts leftward)
  • 219. What is Isoelectric?What is Isoelectric? T-P Segment is preferable
  • 220. What is ST Deviation?What is ST Deviation?
  • 221. ST Segment MonitoringST Segment Monitoring Ideally, ST segment monitoring should also be done on a continuous basis in order to continuously monitor & evaluate patient progress. Continuous computerized ST segment monitoring is available for all 12 Leads using “EASI 12 Lead” (5 Electrodes) or via a Modified 12 Lead (10 Electrodes) using specific algorithms.
  • 222. ST Segment MonitoringST Segment Monitoring  ST Index: avF, V2 and V5 (common lead combination for detection of acute ischemia or injury)  Offers 98.4% sensitivity for acute ischemic events  Increased sensitivity (99.3%) using Leads III/V2/V5 or III/V2/V4  Lead III is more sensitive for RV changes than avF!
  • 223. ST Segment MonitoringST Segment Monitoring If an alarm is triggered due to an ST segment change, only a clinician, not the monitor, can determine the seriousness of the event. To ensure peak performance, the staff should be aware of the interventions and adjustments they can implement to enhance the ST algorithm’s performance & accuracy!
  • 224. CAUTION …CAUTION … ECG Settings!ECG Settings!
  • 225. Sometimes it Hard to TellSometimes it Hard to Tell What’s What … They LookWhat’s What … They Look Similar!Similar!
  • 226. Epicardial versusEpicardial versus Endocardial?Endocardial? Ischemia & InjuryIschemia & Injury PatternsPatterns
  • 227.
  • 228. ST’s up or down?ST’s up or down? ST depression … endocardial involvement ST elevation … epicardial involvement
  • 229. From Who’s Perspective?From Who’s Perspective? aVR = Endocardial Lead (sometimes aVL also) All other Leads = Epicardial Leads
  • 230. ST changes Transient orST changes Transient or Persistent?Persistent? Transient ST changes … Anginal syndromes Persistent ST changes … Infarction process (Rule out Aneurysm, Pericarditis)
  • 231.
  • 232. Regional or GlobalRegional or Global ST Changes?ST Changes? Isolated to a specific region (remember correlation to coronary arterial supply) Widespread ST segment and/or T wave changes may be seen in such conditions as Pericarditis and Coronary Insufficiency.
  • 233.
  • 234. Persistent ST ElevationPersistent ST Elevation Concave or Convex?Concave or Convex? Pericarditis-concave … Infarction-convex QT Short? QT Long?
  • 236. Indicative versus ReciprocalIndicative versus Reciprocal ST ChangesST Changes  Remember the cube concept … opposite walls can show the opposite changes. Remember also, associated leads (I/aVF, II/aVL, III/aVR) will  ST elevation in one wall will show ST depression in the opposite wall  If you can turn the ST “upside down” from one set of leads and match it to the ST in the opposing wall, it’s most likely reciprocal … rather than a separate process associated with a different coronary artery.
  • 237. Reciprocal LeadsReciprocal Leads Think “Inside the Box”Think “Inside the Box” Apex
  • 238. Reciprocal PatternsReciprocal Patterns Question: If a transmural infarct is on in the inferior wall, which leads will show a reciprocal ST depression?
  • 239.
  • 240. Can ST’s look abnormal in theCan ST’s look abnormal in the Healthy Heart?Healthy Heart? Early repolarization can often be found as a normal variant, especially in the young, blacks and athletes … this can mimic pericarditis Can also occur in rapid heart rates Look at baselines and trends! Be aware of normal variants
  • 241. Manifestations of MyocardialManifestations of Myocardial IschemiaIschemia Subendocardial Myocardial Ischemia (Classic Angina): – Transient ST segment depression in the leads facing the area – T wave changes
  • 242. Physiologic vs. Pathologic S-TPhysiologic vs. Pathologic S-T Segment DepressionSegment Depression
  • 243. Myocardial Ischemia –Myocardial Ischemia – Coronary InsufficiencyCoronary Insufficiency  Pathological junctional ST segment depression  Hyperacute T-wave (tall, peaked & symmetrical)  U-wave inversion
  • 245. Manifestations of MyocardialManifestations of Myocardial IschemiaIschemia Prinzmetal’s (Variant) Angina: – Transient ST segment elevation in the leads facing the area – ST elevation (injury pattern involving full thickness of myocardium up to and including the epicardium) – Convex ST shape – (R wave often increases in amplitude in an injury pattern)
  • 246. Variant Angina (Prinzmetal’s)Variant Angina (Prinzmetal’s) A. During pain B. A few minutes after pain resolved
  • 247. Infarction with or withoutInfarction with or without ST elevation?ST elevation? STEMI … ST-Elevated (Acute) MI NSTEMI …. Non-ST-Elevated (Acute) MI
  • 248. IIdentifying thedentifying the “Non-“Non-TransmuralTransmural” or” or Non-ST-ElevatedNon-ST-Elevated MMyocardial Infarctionyocardial Infarction
  • 249. Non-ST-Elevated MINon-ST-Elevated MI (NSTEMI)(NSTEMI) Persistent ST depressions and/or Persistent T wave inversion No Q wave Loss of R wave amplitude
  • 252. IIdentifying thedentifying the ““TransmuralTransmural” or” or ST-ElevatedST-Elevated Myocardial InfarctionMyocardial Infarction
  • 253. ST-Elevated MI (STEMI)ST-Elevated MI (STEMI) Persistent ST elevation and/or Hyperacute T-wave changes … progressing to T-wave inversion Development of a pathological Q wave (if untreated) Loss of R wave amplitude
  • 254. Evolving Inferior Wall STEMIEvolving Inferior Wall STEMI
  • 255. Why a Q wave?Why a Q wave? The “Electrical Window” Concept
  • 256. Why Not a Q wave?Why Not a Q wave? Loss of R wave amplitude is just as significant!
  • 257. Locating the Area of InfarctionLocating the Area of Infarction ECG Manifestations and Clinical Implications
  • 258. I Should Be Able to do This …I Should Be Able to do This … Right!?!Right!?!
  • 259.
  • 260.
  • 261.
  • 262.
  • 263.
  • 264.
  • 265.
  • 266. ST SegmentsST Segments ST Trending and Mapping – Expanding our Clinical Monitoring for ACS Acknowledgement: Philips Medical Systems – ST MapTM
  • 267. Continuous ST SegmentContinuous ST Segment MonitoringMonitoring (2009)
  • 268. ST Segment Monitoring –ST Segment Monitoring – Widely Underused!Widely Underused! CLASS I: Acute Coronary Syndromes Chest Pain or Anginal Equivalent Syndromes PTCA with suboptimal Angiographic results Variant Angina (Coronary Vasospasm)
  • 269. ST Segment Monitoring –ST Segment Monitoring – Widely Underused!Widely Underused! CLASS II: Postacute MI Non-urgent Percutaneous Coronary Intervention High Risk for Ischemia after Cardiac or Noncardiac Surgery High Risk for Ischemia resulting from Congential or Acquired Conditions (eg. Trauma, Cardiotoxic drugs, Myocarditis …)
  • 270. ST Segment Monitoring –ST Segment Monitoring – Technically more difficult …Technically more difficult … CLASS III: LBBB, or intermittent RBBB Ventricular Paced Rhythm Rhythms that Obscure the ST segment (coarse atrial fibrillation or flutter)
  • 271. Remember that ST segment deviation is not always an indication of ischemia/infarction… ST elevation  Myocardial injury  Pericarditis  Dyskinetic ventricle  Ventricular aneurysm (persistent V1-V4)  J-point elevation (normal young patients) ST depression  Ischemia  Tachycardia  Subendocardial infarction  Posterior wall MI (reciprocal)  Carbon monoxide poisoning  Antiarrythmic drugs (eg. Lanoxin)  Mitral valve prolapse  Wolf-Parkison-White syndrome  Hypokalemia
  • 272. Who is using ST segmentWho is using ST segment monitoring?monitoring? Nursing survey in 2001 found…  Only 50% units are using ST segment monitoring consistently  Attributed to: – staff skill level; lack of expertise for interpretation; “trickle” down effect (from research to bedside implementation); Too many false alarms; Cost prohibitive; Clinician appreciation of measurement “We hypothesized that ST segment monitoring, although clearly sensitive for detecting myocardial ischemia, may not provide clinically useful information in a user-friendly manner” Survey of use of ST-segment monitoring in patients with acute coronary syndromes Patton et al, AJCC Vol 10, No1, Pg 23-34
  • 273. ST Segment displays…ST Segment displays… A nice overview but what about…  Assistance with pattern recognition.  The location of the ST changes.  The evolution of the ST changes. 12-Lead Display screen ST Baseline Window ST Segment Display Screen
  • 274.
  • 275.
  • 276. Cardiologists & ContinuousCardiologists & Continuous ST-Segment MonitoringST-Segment Monitoring
  • 277. “ST Map” offers a solution… ST “Map” = ST “Multivariate Axis Plotting”
  • 278. ““ST Map”ST Map”™™ ENHANCED CLINICAL RECOGNITION! Assists with Pattern Recognition (more intuitive) Assists with Locating the area of involvement (diagrammatic representation) Assists with trending, showing evolutionary changes
  • 279. Eindhoven’s Triangle Frontal Plane LeadsFrontal Plane Leads Limb Leads Augmented Limb Leads Inferior Superior Left Right
  • 280. Horizontal Plane LeadsHorizontal Plane Leads Precordial (Chest) Leads Posterior Anterior Left Right
  • 281. Creating the Multivariate AxisCreating the Multivariate Axis Plot (Map)Plot (Map)
  • 282. Creating the Multivariate PlotCreating the Multivariate Plot
  • 283. …the complete picture (Frontal & Horizontal) Limb Leads Chest Leads (Must have minimum of 3 leads active for the ST Map to be displayed - i.e 3 chest leads for chest map, 3 limb leads for limb map) Inferior Apical Septal Lateral Anterior
  • 284. Clinical and ECG Correlation…Clinical and ECG Correlation… Anterior view Location Leads Reciprocal Artery involved ST elevation ST depression Inferior II, III, aVF I, aVL Right Coronary Artery Lateral I, aVL, (V5, V6) V1, V2 Circumflex Large Anterior V1, V2, V3, V4, I, aVL II, III, aVF Left Coronary Artery Anterolateral I, aVL, V4, V5, V6 II, III, aVF Left Anterior Descending Anteroseptal V1, V2, V3 None Left Anterior Descending
  • 285. ST Map on the 12-lead DisplayST Map on the 12-lead Display
  • 286. ST Map (Current) WindowST Map (Current) Window To hide baseline
  • 287. ST Map (Trend) WindowST Map (Trend) Window Sends the content of the ST Map window to the configured printer.
  • 288. ST (Current) PrintoutST (Current) Printout
  • 289. ST (Trend) PrintoutST (Trend) Printout
  • 290. ST Map report forST Map report for documentation…documentation…
  • 291. Application of ST MapApplication of ST Map
  • 292. A Case StudyA Case Study Clinical Application of ST Segment Trending using “ST Map”
  • 293. Case StudyCase Study A 62-year-old male presents to the Emergency Room with a two-hour history of developing chest pain while gardening. On arrival, patient is anxious, pale and sweating. He is also nauseated and states he feels dizzy, complaining of chest & jaw pain (pain score 4 out 5) associated with left arm numbness. The patient is connected to the monitor & the following vital signs are recorded: HR 62 RR 28 (SpO297%) BP 90/50 T 369 ST Map shows the following localization…
  • 294. ST Map current view in acuteST Map current view in acute phase…phase… ST Elevation ST Depression
  • 295. ST Elevation ST Depression 12 lead ECG on arrival in the12 lead ECG on arrival in the Emergency RoomEmergency Room
  • 296. Location of ST changes on theLocation of ST changes on the ECG…ECG… Location Leads Reciprocal Artery involved ST elevation ST depression Inferior II, III, aVF I, aVL Right Coronary Artery Lateral I, aVL, V5, V6 V1, V2 Circumflex Anterior V1, V2, V3, V4, I, aVL II, III, aVF Left Coronary Artery Anterolateral I, aVL, V4, V5, V6 II, III, aVF Left Anterior Descending Anteroseptal V1, V2, V3 None Left Anterior Descending
  • 297. After evaluating the presenting symptoms, strong family history, & 12 lead ECG changes a diagnosis of acute inferior myocardial infarction is made. The patient is prepared for an emergency angiography with possible angioplasty.
  • 298. ST Map current view usingST Map current view using reference baseline to monitor forreference baseline to monitor for changes during angioplasty…changes during angioplasty… Reference baseline ST Elevation
  • 299. Angiogram showed a 85% occlusion of proximal right coronary artery and a coronary stent was successfully deployed. ReoPro™ was given as per hospital guidelines. The patient’s condition is stable and he is transferred to the Coronary Care Unit for close observation.
  • 300. Three hours post angioplasty…Three hours post angioplasty… ST Elevation
  • 301. Using ST Map trends forUsing ST Map trends for continued management…continued management…
  • 302. 12 hours post angioplasty, the patient had a brief episode of central non-radiating chest pain at rest not associated with any other signs and symptoms. The trending feature on the ST Map was set for 12 second snapshots to observe closely the changes in the ST segments. The pain resolved spontaneously.
  • 303. ST Map trends using 12 secondST Map trends using 12 second snapshots to observe closely STsnapshots to observe closely ST changes…changes…
  • 304. This episode of chest pain resolved spontaneously and the patient remained pain- free. The ST Map at 24hrs post angioplasty, showed that the inferior ST segments, were nearly back to normal and that the lateral changes had resolved completely.
  • 305. ST Map at 24 hours shows theST Map at 24 hours shows the ST changes nearly back toST changes nearly back to normal…normal…
  • 306. 12 lead serial ECG confirms ST12 lead serial ECG confirms ST Map findings…Map findings… Residual Q wave & T wave inversion
  • 307. The patient remained pain-free for the remainder of his stay in the CCU. After spending time on the telemetry floor, the patient was discharged home 7 days post angioplasty.
  • 308. “Using ST MapTM for monitoring ST segment monitoring, provides clinically useful information in a user-friendly manner” Survey of use of ST-segment monitoring in patients with acute coronary syndromes Patton et al, AJCC Vol 10, No1, Pg 23-34 TM Philips Medical Systems
  • 309.
  • 310. Identifying IntraventricularIdentifying Intraventricular Conduction DefectsConduction Defects RBBB, LBBB, LAH, LPH, Bifascicular & Trifascicular Blocks
  • 312.
  • 313. Remember the Basics!Remember the Basics! Normally Left before Right!
  • 316. Right Bundle Branch BlockRight Bundle Branch Block
  • 317. Right Bundle Branch BlockRight Bundle Branch Block  Normal variant  Ischemic heart disease  Acute myocardial infarction  Acute coronary insufficiency  Trauma  Acute heart failure  Intracardiac catheter (PA catheter)  Right heart catheterization
  • 318. Causes of RBBBCauses of RBBB Cardiomyopathy Degenerative disease of the conduction system Acute Infective processes Parasites Rheumatic heart, Syphilis, Tumors, Congenital lesions Surgery (Tetralogy of Fallot, VSD)
  • 319. Salient Features of RBBBSalient Features of RBBB Wide QRS (> .10 sec) Increased VAT (> 0.04 sec) in RV leads rsR’ or qR in V1 T opposite polarity to QRS in RV leads Wide S wave in left-sided leads (V6, I, II)
  • 320. Left Bundle Branch BlockLeft Bundle Branch Block
  • 321. Causes of LBBBCauses of LBBB Not as common as Right Bundle Branch Block due to two separate fascicles (posterior fascicle has a dual blood supply and is much thicker) Causes are the same as for Right Bundle Branch Block, but involving the Left Ventricle or Surgery to the Aortic Valve.
  • 322. Salient Features of LBBBSalient Features of LBBB Wide QRS (> .10 sec) Increased VAT (> 0.04 sec) in LV leads Wide R or notched “M-shaped R” in Left- sided leads (V5, V6, I, aVL, II) T opposite polarity to QRS in LV leads Wide S or QS wave in right-sided leads (V1)
  • 323.
  • 324.
  • 325.
  • 326.
  • 327.
  • 328. The Ultimate Test!The Ultimate Test!
  • 329. To be continued …To be continued …
  • 330. I’m 100% saturated!I’m 100% saturated!
  • 331.

Editor's Notes

  1. Marjorie Funk, PhD, RN, Yale University School of Nursing Catherine G. Winkler, PhD, RN, Yale University School of Nursing Jeanine L. May, MPH, MSN, RN, Yale University School of Nursing Kimberly Stephens, MPH, RN, University of California, San Francisco School of Nursing Kristopher P. Fennie, PhD, Yale University School of Nursing Leonie L. Rose, MSN, RN, Yale University School of Nursing Yasemin E. Turkman, MPH, MSN, RN, and Yale University School of Nursing Barbara J. Drew, PhD, RN University of California, San Francisco School of Nursing Abstract Purpose—To examine the appropriate use of arrhythmia, ischemia, and QTc interval monitoring in the acute care setting. Methods—We analyzed baseline data of the PULSE Trial, a multi-site randomized clinical trial evaluating the effect of implementing ECG monitoring practice standards. Research nurses reviewed medical records for indications for monitoring and observed if arrhythmia, ischemia, and QT interval monitoring were being done on 1,816 patients in 17 hospitals. Results—Almost all (99%) patients with an indication for arrhythmia monitoring were being monitored, but 85% of patients with no indication were monitored. Of patients with an indication for ischemia monitoring, 35% were being monitored, but 26% with no indication were being monitored for ST-segment changes. Only 21% of patients with an indication for QT interval monitoring had a QTc documented, but 18% of patients with no indication had a QTc documented. Conclusion—Our data show evidence of inappropriate monitoring: under-monitoring for ischemia and QTc prolongation and over-monitoring for all 3 types of monitoring, especially arrhythmia monitoring.
  2. Filters and Lead Placement can affect this!
  3. Therefore, the goals of CDSS can be thought of as primarily two-fold: assistance with diagnosis, and patient safety These systems are used to enhance diagnostic efforts based on clinical information entered by the clinician. Other forms of clinical decision support systems seek to prevent medical errors and improve patient safety. Clinical decision support systems vary greatly in their complexity, function and application. These clinical tools differ from practice guidelines and critical pathways in that they require the input of patient-specific clinical variables and as a result provide patient-specific recommendations. Guidelines and pathways, in contrast, may not require the input of such information and provide more general suggestions for care and treatment. Among the most common forms of support systems are drug-dosing calculators. These are computer-based programs that calculate appropriate doses of medications after clinicians input key data Other systems, both simple and complex, may be integrated into the point-of-care and provide accessible reminders to clinicians regarding appropriate management based on previously entered data. These systems may be most practical when coupled with computerized physician order entry and electronic medical records. Through their integration with practice guidelines and critical pathways, decision support systems may provide clinicians with suggestions for appropriate care, thus decreasing the likelihood of medical errors.
  4. May differ from manual “snap shot in time” Uses multiple leads Rolling average Updated every minute for 5 minutes initially and then updated every 5 minutes thereafter (when signal noisy, may be displayed for 10 minutes)
  5. Dutch physiologist, Willem Einthoven sees Waller demonstrate his technique (1887 – first human electrocardiogram) at the First International Congress of Cardiologists in Bale. Waller often demonstrated by using his dog, Jimmy, who would patiently stand in glass jars of saline.
  6. Equilateral Triangle R wave amplitude of Lead I and III, equals that of Lead II
  7. Mason-Likar lead placement reduces variability in the ECG recording during exercise – it is NOT exactly equivalent to the standard lead positions The Mason-Likar method lead system tends to distort the ECG with a rightward QRS axis shift, a reduction in R wave amplitude in lead I and lead aVL, and a significant increase in R wave amplitude in Leads II, III and aVF. (Eur Heart J 1987, Jul; 8(7):725-33.
  8. ES: S (-) to E (+) AS: S (-) to A (+) AI: I (-) to A (+) Dr. Gordon Dower’s adaptation of vectorcardiography. E,A and I electrode placements used in EASI configuration are modified Frank vector leads
  9. Normal 12 Lead
  10. Normal 12 Lead ECG
  11. Normal 12 Lead
  12. A Word About Filters!
  13. To obtain an ECG signal with the highest fidelity for viewing, recording and printing use the Diagnostic Mode in the adult patient category. Using Filters There is a trade off between clarity and fidelity of the ECG trace when a filter is applied. The more filtering applied, the greater the possibility of removing ECG signal details. Changing the high frequency filter to 20, 40 or 55 Hz results in a smoother looking ECG waveform while eliminating some fine detail in the signal. Small deflection, notches, slurs may be distorted or may disappear if one of these filters is applied. Changing the low frequency filter to 0.5 Hz can be used to reduce baseline noise such as baseline wander. Baseline wander is the slow (typically 0.1 - 0.2 Hz) drifting of the ECG baseline up or down. Baseline wander may result from patient respiration or from other sources such as dried electrodes. Severe baseline wander may make it difficult to determine the true wave shapes in the ECG.
  14. Anterolateral infarction with LAD
  15. Acute Inferior Wall infarction
  16. Acute Inferior-Posterior Wall Infarction
  17. Hyperacute phase of inferior wall infarction
  18. Acute Anterolateral wall infarction
  19. Possible True Posterior Infarction
  20. Inferior Infarction
  21. 2013 … we are not there yet!
  22. Background Continuous ST-segment monitoring can be used to detect early and transient cardiac ischemia. The American Heart Association and American Association of Critical-Care Nurses recommend its use among specific patients, but such monitoring is routine practice in only about half of US hospitals. Objective To determine cardiologists’ awareness and practice standards regarding continuous ST-segment monitoring and the physicians’ perceptions of appropriate patient selection, benefits and barriers, and usefulness of this technology. Methods An electronic survey was sent to a random sample of 915 US cardiologists from a pool of 4985 certified cardiologists. Results Of 200 responding cardiologists, 55% were unaware of the consensus guidelines. Of hospitals where respondents admitted patients, 49% had a standard of practice for using continuous ST-segment monitoring for cardiac patients. Most cardiologists agreed or strongly agreed that patients in the cardiovascular laboratory (87.5%) and intensive care unit (80.5%) should have such monitoring. Cardiologists routinely ordered ST monitoring for patients with acute coronary syndrome (67%) and after percutaneous coronary intervention (60%). The primary factor associated with higher perceptions for benefits, clinical usefulness, and past use of continuous ST-segment monitoring was whether or not hospitals in which cardiologists practiced had a standard of practice for using this monitoring. A secondary factor was awareness of published consensus guidelines for such monitoring. Conclusion Respondents (55%) were unaware of published monitoring guidelines. Hospital leaders could raise awareness by multidisciplinary review of evidence and possibly incorporating continuous ST-segment monitoring into hospitals’ standards of practice. (American Journal of Critical Care. 2010;19:112-123)
  23. Green or the color of the ECG waveform is current Yellow is the baseline White to darker shades of gray Up to 5 MVP can be displayed
  24. The most recently viewed ST Map window can be printed in either current or trend view. If the patient is being monitored using EASI lead placement, then both view labels will have EASI included for ease of documentation ie. “EASI limb leads” and “EASI chest leads”
  25. Patient states that he has being having intermitent chest pain for the past month, which he thought was indigestion. He is a non-smoker and walks for 2 hours every day. There is a strong family history of heart disease with his father dying from a myocardial infarction at 67-years-age and his brother having a triple by-pass at 60 years-age.
  26. A twelve lead configuration is selected on the MP50 monitor, but the ST Map can also be used with the Easi derived 12 lead. Which set-up has been selected is easily noted by the label of the two views.
  27. Elevated ST segments in leads II, III, aVF Depressed ST segments in leads I, aVL, V2 Since the patient has significant ECG changes, the ST Map is used to continously monitor the ST segment for the remainder of the patients stay in the ER. The patient is given sublingual Nitroglycerin with minimal effect. Intravenous access was gained and the patient was administered Morphine Sulphate 5mg intraveously with the desired effect. The cardiac enzymes were drawn
  28. On arrival to the CCU, the reference baseline was used to observe closely deviations in the ST segment. The baseline is derived either manually by the end-user or automatically whenever the monitor relearns an arrhythmia.
  29. The current ST Map and up to four trended ST Maps are shown simultaneously. The current map is shown in the same color as the ECG parameter. Past values change from white through to dark gray for easy interpretation. Timing interval between samples can be configured by the end-user (12 seconds to 30 minutes). The selected time interval is shown between the two ST maps. In the trended view, it is also possible to have a reference baseline (yellow)
  30. ? BBB’s ? Summarize – Slide 338
  31. Left Bundle Branch Block
  32. Right Bundle Branch Block
  33. Right Bundle Branch Block with Left Axis Deviation (LAH) … Bifascicular block
  34. LAH
  35. LPH
  36. We are not done yet! August 26th submission date (Yale University, Marjorie Funk, principle investigator) Detailed Clinical Trial Description Despite advances in hospital electrocardiographic (ECG) monitoring technology, monitoring practices are inconsistent and often inadequate. The investigators recently published practice standards for ECG monitoring. The primary purpose of this 5-year multisite randomized clinical trial is to test the effect of implementing these standards on nurses&amp;apos; knowledge and skills, quality of care, and patient outcomes. The investigators expect that increased knowledge and skills of nurses will lead to enhanced quality of care, which will result in improved outcomes for patients. Units serving cardiac patients in 17 hospitals will participate. Hospitals will be randomized to the experimental or control group after baseline measures of knowledge and skills, quality of care, and patient outcomes are obtained. The intervention will include ECG monitoring education and strategies to implement and sustain change. The online education will include 4 modules: essentials of ECG monitoring, arrhythmia monitoring, ischemia monitoring, and QT interval monitoring. The strategies to implement and sustain change in the clinical area include reinforcement of education, incentives, and the designation of &amp;quot;champions&amp;quot; on each unit who will actively promote the implementation of the practice standards.