
Empfohlen
Weitere ähnliche Inhalte
Andere mochten auch
Andere mochten auch (20)
Ähnlich wie Beribi Supermarket Rush Hour Analysis
Ähnlich wie Beribi Supermarket Rush Hour Analysis (16)
Kürzlich hochgeladen
Kürzlich hochgeladen (20)
Beribi Supermarket Rush Hour Analysis
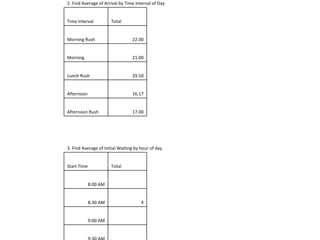
- 1. 4:30 PM 18 4:00 PM 3:30 PM 3:00 PM 15 2:30 PM 2:00 PM 1:30 PM 16 1:00 PM 12:30 PM 12:00 PM 25 11:30 AM 11:00 AM 10:30 AM 11 10:00 AM 9:30 AM 9:00 AM 4 8:30 AM 8:00 AM Total Start Time 3. Find Average of Initial Waiting by hour of day 17.00 Afternoon Rush 16.17 Afternoon 29.50 Lunch Rush 21.00 Morning 22.00 Morning Rush Total Time Interval 2. Find Average of Arrival by Time Interval of Day 146 9 7 43 34 53 Afternoon Rush 358 32 20 138 97 71 Afternoon 390 16 50 94 118 112 Lunch Rush 337 15 20 123 134 45 Morning 106 6 4 45 44 7 Morning Rush Total Customer Checkers End Waiting Departures Arrivals Initial Waiting Time Interval 1. Count each Time Interval 72 3 2 25 21 21 Afternoon Rush 5:00 PM Monday 74 6 5 18 13 32 Afternoon Rush 4:30 PM Monday 54 6 2 20 15 11 Afternoon 4:00 PM Monday 58 6 5 21 14 12 Afternoon 3:30 PM Monday 53 5 4 22 12 10 Afternoon 3:00 PM Monday 69 5 4 27 21 12 Afternoon 2:30 PM Monday 68 5 3 25 12 23 Afternoon 2:00 PM Monday 56 5 2 23 23 3 Afternoon 1:30 PM Monday 88 4 21 32 21 10 Lunch Rush 1:00 PM Monday 114 4 23 21 32 34 Lunch Rush 12:30 PM Monday 96 4 4 20 45 23 Lunch Rush 12:00 PM Monday 92 4 2 21 20 45 Lunch Rush 11:30 AM Monday 70 3 4 34 21 8 Morning 11:00 AM Monday 62 3 3 25 24 7 Morning 10:30 AM Monday 52 3 2 22 23 2 Morning 10:00 AM Monday 86 3 7 21 32 23 Morning 9:30 AM Monday 67 3 4 21 34 5 Morning 9:00 AM Monday 56 3 3 23 23 4 Morning Rush 8:30 AM Monday 50 3 1 22 21 3 Morning Rush 8:00 AM Monday Total Customer Checkers End Waiting Departures Arrivals Initial Waiting Time Interval Start Time Day Objective: To use charts, summary measures and pivot tables to understand time patterns of arrival and congestion at Beribi Supermarket