SlideShare ist ein Scribd-Unternehmen logo
1 von 10
Downloaden Sie, um offline zu lesen
Producing Terrain Elevation
Data with LIDAR
by Alberto Kodi’ Volkmann
Project 3: Acquiring Geographic Data
LIDAR image of tall trees on
mountainous slope (Oregon State
University)
1
Project 3: Acquiring Geographic Data
Producing Terrain Elevation Data with LIDAR
Alberto Kodi’ Volkmann
LIDAR
LIDAR stands for Light Detection and Ranging, and is a remote sensing technology that measures the distance of
an illuminated “target” from an emitting laser to the targeted object. The emitted laser light is reflected off the
target and the sending and return times provides the LIDAR sensor with the data to calculate the distance from
the LIDAR sensor. LIDAR uses ultraviolet, visible, or near infrared light to image objects, and can target a wide
range of materials, including non-metallic objects, rocks, rain, chemical compounds, aerosols, clouds and even
single molecules (Wikipedia).
In this presentation, I will focus on the ability of LIDAR system to extract Digital Elevation Model, or DEM data,
from remote sensing system such as orbiting satellite systems and aerial platforms, but I will also expound upon
the latest Engineering, Mapping, and GIS uses of LIDAR technology, which are of key interest to my Civil and
Structural design practices and pusuits.
LIDAR System Subcomponents
LIDAR systems are composed of three main
subsystems, the Laser Scanner, the Direct
Georeferencing system, and the Computer
Processing system (Pennsylvania State
University, Topographic Mapping with LIDAR).
The Laser Scanner consists of three main sub-
components, the opto-mechanical scanner, the
ranging unit, and the control processing unit.
The Opto-Mechanical Scanner emits a stream of
laser pulses which are transmitted to the target,
and reflected back to the Ranging Unit. The
Ranging Unit contains an electro-optical receiver
which records the transmission and reflected
reception travel times and provides this data to
the Control Processing Unit.
These sending/receiving times provide the
distance measurements that are then converted
into elevation data in the case of aerial or
satellite derived data, which then are later
converted into Digital Elevation Models, DEMs,
or Topographic maps and terrain models.
These distance measurements would be of little
use to Geographers and GIS specialist,
however, if the data could not be properly
Figure 1: Topographic relief of Marching
Bears Mound Group, Effigy Mounds National
Monument, Iowa via LIDAR, Wikipedia
georeferenced, which is accomplished by the Direct Georeferencing System.
2
The Direct Georeferencing System, (DG) is composed of two main subcomponents, a GPS or Global
Positioning System, and an Inertial Navigation System (INS). These two subsystems provide real time global
positioning data as well as track the direction and attitude of the LIDAR carrying vehicle. Typically vehicles used
for LIDAR data collection are satellite borne systems and those on aircraft used for aerial data collection,
including the recent introduction of drone based systems for localized, highly accurate terrain modeling.
The illustration to the left provides a
visual for the combination of systems
required to provide DG for airborne
LIDAR systems. The image shows a
digital camera being carried by the
aircraft which possibly could be done at
the same time as LIDAR imaging, but if
we imagine the camera instead being a
LIDAR laser scanner we can see the a
combination of satellite and ground
based technologies are required to
provide DG for LIDAR remote sensing.
In a DG system, the airborne GPS
provides position and velocity of our
aircraft, while the INS provides attitude,
or orientation, of the sensor to the
terrain being imaged or mapped. The
LIDAR Laser Scanner measures the
distance to the terrain being mapped,
which can later be post processed into
the elevation data of the terrain that is
being over flied.
Figure 2: The Components of Direct Georeferencing, (a) the Laser Scanner, (b) Direct
Georeferencing System, (c) Computer Processing system, (d) Airborne GPS, (e) terrestrial based GPS
base station, and (e) optional RTK GPS. Source: The Pennsylvania State University, Department of
Geography (2014), Topographic Mapping with LIDAR
During a flight mission, while the DG system records position and orientation data, it also records a
corresponding time tag for each laser scan. DG postprocessing software interpolates the position and orientation
of the laser reference point at each time tag. With this data and the range measured by the laser, the three-
dimensional ground coordinates of every laser return may be computed (Pennsylvania State University,
Topographic Mapping with LIDAR). A ground based GPS base station is used to provide a stationary control
reference point to provide data for differential correction data. The addition of Real-time differential correction
data may also be incorporated into the LIDAR remote sensing operation by using Wide Area Augmentation
System, WAAS, and/or Real-time Kinematic GPS signals.
It should be noted that in order for a LIDAR system to be accurate, and thus provide usable terrain elevation
data, each leg or component of the system must calibrated on a regular schedule, with some elements of the
system, such as Boresight Calibration required before/or at the beginning of each scheduled data collection
mission.
3
Characteristics of LIDAR Data
Discrete Return LIDAR and Full Waveform LIDAR
As noted earlier, the Opto-Mechanical Scanner, subcomponent of the Laser Scanner, emits a stream of laser
pulses which are transmitted to the target, and reflected back to the Ranging Unit. These laser emissions are
composed of electromagnetic energy in the form of light, which is a waveform distribution of light energy. This
electromagnetic energy can be recorded in two different manners.
A Discrete Return LIDAR records individual (discrete) points for the peaks in the waveform curve. Discrete return
LiDAR systems, identify peaks and record a point at each peak location in the waveform curve. These discrete or
individual points are called returns. A discrete system may record 1-4 (and sometimes more) returns from each
laser pulse.
A Full Waveform LiDAR System records a distribution of returned light energy. Full waveform LiDAR data are
thus more complex to process, however, they can often capture more information compared to discrete return
LiDAR systems.
LIDAR Terrain Data vs Digital Elevation Models
As noted in our reading in chapter 7, section 8, on National Spatial Data Infrastructure II, Digital Elevation
Models, DEMs were produced originally in tiles that correspond to topographic quadrangles. These original
DEMs produced 10 meter, and 30 meter DEM grids which provided the initial nationwide elevation model of the
continental United States. Elevation data was later interpolated from DLG hypsography and hydrography layers,
which provided accuracy up to 3 meters for certain areas of the country. LIDAR by contrast is an active remote
sensing system capable of providing accurate terrain modeling with accuracies of 1 cm or better, even to the
accuracies in multiples of millimeters (Pennsylvania State University, The Nature of Geographic Information).
LIDAR Platforms and their Applications
LIDAR systems come in various platforms depending on the application, the size of area to be mapped, and the
level of accuracy and precision required for the particular application. The focus of this presentation has been
the use of LIDAR for the acquisition of terrain elevation data, which is primarily acquired through the use of
satellite based and aerial based LIDAR platforms. It should however be noted that there are other platforms and
uses of LIDAR data and we shall take a quick look at some of the other uses of LIDAR data and how they are
attained.
While it is somewhat out of the scope of this presentation, I would like to highlight a few of newest applications of
LIDAR attained data, and their uses in engineering, mapping, and GIS data acquisition. LIDAR has helped to
transform the design world by providing concentrated data “clouds” of discrete points, all of which can be
georeferenced as has been described earlier in the presentation. This has provided a data stream which lends
itself well to the revolution in computer-aided design & drafting processes known as Cad or Cadd. The
increased power of desktop computing and the development of Building Information Management systems, or
BIM, has taken design from the production of 2D Architectural, Engineering, and Construction (AEC) plans and
perspective renderings into a new and exciting realm of 3D modeling and design.
What is probably most known to the general public as 3D imagery in products such as Google Earth ™, is just
the tip of the iceberg. What were are now see today is the full 3d modeling of the design process which
produces “smart” models of a proposed design whether it be a building, road project, highways and bridges, or
rail and marine facilities. Where these process get real exciting is that they automate many of the design
processes; from cost estimation, quantity take-offs, collision detection (as in piping systems), and even the
4
automation of preliminary design processes and drawing production. While I know I digress from the focus of
this report, I would like to show a couple instances of how LIDAR is used in the new era of 3D design processes.
Let us first take a look at a process in design called As-builting. As-builting is the documentation of existing
structures and is often used to show current state of infrastructure system prior to designing additions to existing
infrastructure. As-builting is also done after construction of designed projects to indicate where built conditions
differ from design drawings .
Figure 3: Point Cloud Sections, Sluck sugar plant in Belarus,
ON-SITE TIME: 4 days two person team 576 scan positions
COMPLETION TIME 10 days
ACCURACY:
Image Attributed to 3Deling, Krakow, Poland, < http://www.3deling.com/>
The example shown in figure 3, in the lower right corner showns a 3D model of an existing sugar plant in
Belarus. This model was acquired using terrestrial based LIDAR, commonly known as laser scanning. As we
can see, laser scanning provides a streamlined approach to gathering data about existing building structures and
industrial facilities that would often take months or even years prior to the development of modern computer
based design processes. What might not be readily apparent, is that the two sections shown in Figure 3 where
generated by a computer automatically once a designer determined the position in the existing structure that he
or she required a section cut to be made. This somewhat magical process is completly transforming the design
process.
What is very exciting about these new design methods, is that products such as Autodesk’s Infraworks™ are
automating the extraction of preliminary design data from readily available data sources such as USGS DEMs,
OpenStreetMaps™ street and road data, and Bing Maps™ aerial photography. The next two images are those
of Mt. Hood, Oregon, my in home state and the site of my own wedding at Timberline Lodge on Mt. Hood. What
5
is almost unbelievable is that the process of creating these two rendering of Mt. Hood, which actually include
DEM data which can be used for site analysis took less than five minutes to generate. Additionally, the models
shown in Figures 4a and 4b were generated using cloud computing, which frees up designers and their
computers to work on other design items.
Figure 4a: 3D Model of Mt. Hood, Oregon created using Autodesk’s Infraworks 360™
Figure 4b: Perspective view of a 3D Model of Mt. Hood, Oregon created using Autodesk’s Infraworks 360™
The list below summarizes some of the additonal design/analysis process that are a result of the availability of
remote sensing data, primarily but not exclusively from LIDAR. The exponential evolution in the power
computing and ability to compute 3D models in the cloud are driving factors in these processes.
Generation of multiple preliminary designs
Traffic Analysis
Hydrological and flood plane analysis
Stormwater and sewage drainage design
Bridge and dam monitoring
Facilities inventory
Crime and accident scene analysis
As-built documentation
6
LIDAR technology has revolutionized how field data is collected, as well as how it is used. Automating &
accelerating data collection procedures has cut down on design cost and has created whole new industries based
on the modeling of existing infrastructure systems and how we in our communities manage the machinery of our
civilizaiton. To conclude my digression into the applications of LIDAR technology, I would like to direct the reader
to Figure 5, which shows an example of a terrestial based laser scanner.
Figure 5: Terrestrial based Laser Scanner
Image Attributed to 3Deling, Krakow, Poland
Case Study – New Orleans Flood Inundation after Hurricane Katrina
As indicated earlier, terrain modeling based on LIDAR acquired data has other applications other than developing
DEMs, additional applications of terrain modeling include Flood Inundation Analysis. In the Topography-based
Analysis of Hurricane Katrina Inundation of New Orleans, by Dean Gesch of the USGS we can see how LIDAR
Figure 3: High-resolution elevation
data of New Orleans, La., derived from
light detection and ranging (LIDAR) data
collected in 2002. Note that the land
along Lake Pontchartrain and the
Mississippi River is higher than the land
in the center of the city, which is below
sea level, resulting in what is often
referred to as the bowl shape of New
Orleans. Source: USGS (2007),
data collected in 2002 was used to provide a rough mapping of the extent and depth of the inundation. On Friday,
September 2, 2005, five days after the hurricane, an accurate demarcation from aerial imagery of the extent of
the flooding was not yet available, so a topographic methodology was used. As temporary water level gages
where still being installed in the city, it was decided to use lake-level gages on the Lake Ponchartrain Causeway.
An assumption was made that by the afternoon of September 2, the level of Lake and the flood waters within the
7
city had equalized. A comparison of aerial and satellite imagery taken later, showed that flood delineation derived
from the 2002 LIDAR data was a “reasonable depiction” (USGS, 2007).
The LIDAR-derived elevation data were also used to calculate rough estimates of the floodwater volumes. The
Army Corps of Engineers inquired of the USGS to provide an independent corroboration of their estimates; as
accurate estimates of flood water volumes were needed to assess the time required to remove the water from the
city. Even though the data derived from LIDAR imagery and on hydrological data from the water gage on Lake
Ponchartrain, were provisional; the timeliness of these products was significant for initial response efforts in the
first few days after the flooding.
The USGS has emphasized that by combining precise elevation information from LIDAR with accurate ground
based water-level information and inundation demarcations from remote sensing, a complete history of flooding
and water removal can be reconstructed. “Such a history is useful for assessing the effects of flooding on the
urban landscape…the effects of depth and length of inundation on different types of structures can be
documented” (USGS, 2007).
Figure 4. Map of relative water depth in New Orleans, La., on September 2, 2005. The estimated flood
depth is based on LIDAR-derived elevation data and water level data from a Lake Pontchartrain gage.
Note that the estimated depth of inundation was calculated only for the areas north and east of the
Mississippi River enclosed within the heavy black lines Source: USGS (2007),
The ready availability of high-resolution, high-accuracy elevation data derived from LIDAR proved valuable for
development of topography-based products to provide rough estimates of the inundation of New Orleans from
Katrina in the immediate days following the storm. Because of its high level of spatial detail and vertical accuracy
8
of elevation measurements, LIDAR is an excellent mapping technology for use in low-relief hurricane-prone
coastal areas. When LIDAR elevation data have been processed and are available before a storm event, as was
the case for New Orleans, then geospatial based inundation maps and products can be quickly generated for
response and recovery efforts immediately following the storm.
Summary
In closing, I just would like to say that LIDAR and remote sensing systems are changing the way we look at and
interact with our world. It would not be too much of stretch to say that we, as Humankind, are changing because
of the technology we are developing and the applications we have developed from these technologies. LIDAR is
one more tool that has simplified the way we collect information, process, and analyze the information derived
about our environment, whether natural and the manmade.
LIDAR has given us many new tools and methods to interpret existing conditions of our built environment and is
transforming the design process from conceptualization, to modeling and construction drawing automation. The
ability of taking field information and to rapidly convert that data into useable visualizations and conceptual design
models has opened new avenues of exploration in current computing trends. Cloud based 3D modeling and web
based GIS mapping are just a couple of applications that will need the accurate and cost effective means of data
collection that LIDAR provides. I am convinced we are just seeing the beginnings of a revolution in design
processes and GIS mapping technologies that will incorporate LIDAR data as bases to their data models.
9
References
Wikipedia, LIDAR, Retrieved July 26, 2015, from <https://en.wikipedia.org/wiki/LIDAR>
Neon, Work with Data, Discrete vs. Full Waveform LiDAR, Retrieved July 26, 2015, from
http://neondataskills.org/remote-sensing/1_About-LiDAR-Data-Light-Detection-and-
Ranging_Activity1/#discrete-vs-full-waveform-lidar
The Pennsylvania State University, Department of Geography (2014), Topographic Mapping with LIDAR,
Retrieved, July 26, 2015, from <https://www.e-education.psu.edu/geog481>
The Pennsylvania State University, Department of Geography (2014), The Nature of Geographic Information,
Retrieved, July 27, 2015, from <https://www.e-education.psu.edu/natureofgeoinfo>
USGS, (2007), Topography-based Analysis of Hurricane Katrina Inundation of New Orleans, Retrieved, July 27,
2015, from <http://pubs.usgs.gov/circ/1306/pdf/c1306_ch3_g.pdf>
Final Example of Lidar Scanning As-Built Modeling
Terrestrial Laser Scan, Chemical Installation, Netherlands
ON-SITE TIME: 3 days two person team 170 scan positions
COMPLETION TIME: 10 days
ACCURACY: + /-5mm
Final product as a registered point cloud in a single local coordinate system.
Image Attributed to 3Deling, Krakow, Poland, < http://www.3deling.com/>

Weitere ähnliche Inhalte

Was ist angesagt?

Lidar : light detection and rangeing
Lidar : light detection and rangeingLidar : light detection and rangeing
Lidar : light detection and rangeingRahul Bhagore
 
Advantages and disadvantages of Remote Sensing
Advantages and disadvantages of Remote SensingAdvantages and disadvantages of Remote Sensing
Advantages and disadvantages of Remote SensingEr Abhi Vashi
 
LiDAR Aided Decision Making
LiDAR Aided Decision MakingLiDAR Aided Decision Making
LiDAR Aided Decision MakingLidar Blog
 
IRJET- Simultaneous Localization and Mapping for Automatic Chair Re-Arran...
IRJET-  	  Simultaneous Localization and Mapping for Automatic Chair Re-Arran...IRJET-  	  Simultaneous Localization and Mapping for Automatic Chair Re-Arran...
IRJET- Simultaneous Localization and Mapping for Automatic Chair Re-Arran...IRJET Journal
 
LIDAR TECHNOLOGY AND ITS APPLICATION ON FORESTRY
LIDAR TECHNOLOGY AND ITS APPLICATION ON FORESTRYLIDAR TECHNOLOGY AND ITS APPLICATION ON FORESTRY
LIDAR TECHNOLOGY AND ITS APPLICATION ON FORESTRYAbhiram Kanigolla
 
Introduction to remote sensing and gis
Introduction to remote sensing and gisIntroduction to remote sensing and gis
Introduction to remote sensing and gisMohsin Siddique
 
Fundamentals of Remote Sensing- A training module
Fundamentals of Remote Sensing- A training moduleFundamentals of Remote Sensing- A training module
Fundamentals of Remote Sensing- A training moduleNishant Sinha
 
Lidar technology and it’s applications
Lidar technology and it’s applicationsLidar technology and it’s applications
Lidar technology and it’s applicationskarthik chegireddy
 
LiDAR Expected Accuracy Presentation
LiDAR Expected Accuracy PresentationLiDAR Expected Accuracy Presentation
LiDAR Expected Accuracy PresentationLidar Blog
 
Rankin LiDAR presentation
Rankin LiDAR presentationRankin LiDAR presentation
Rankin LiDAR presentationJustin Farrow
 
light-detection-and-ranging(lidar)
 light-detection-and-ranging(lidar) light-detection-and-ranging(lidar)
light-detection-and-ranging(lidar)sandeep reddy
 
Intro to GIS and Remote Sensing
Intro to GIS and Remote SensingIntro to GIS and Remote Sensing
Intro to GIS and Remote SensingJohn Reiser
 
"Why LiDAR?" Presentation
"Why LiDAR?" Presentation"Why LiDAR?" Presentation
"Why LiDAR?" PresentationLidar Blog
 
Introduction to LiDAR presentation.
Introduction to LiDAR presentation.Introduction to LiDAR presentation.
Introduction to LiDAR presentation.Bob Champoux
 

Was ist angesagt? (20)

Lidar : light detection and rangeing
Lidar : light detection and rangeingLidar : light detection and rangeing
Lidar : light detection and rangeing
 
Advantages and disadvantages of Remote Sensing
Advantages and disadvantages of Remote SensingAdvantages and disadvantages of Remote Sensing
Advantages and disadvantages of Remote Sensing
 
LiDAR
LiDARLiDAR
LiDAR
 
LiDAR Aided Decision Making
LiDAR Aided Decision MakingLiDAR Aided Decision Making
LiDAR Aided Decision Making
 
IRJET- Simultaneous Localization and Mapping for Automatic Chair Re-Arran...
IRJET-  	  Simultaneous Localization and Mapping for Automatic Chair Re-Arran...IRJET-  	  Simultaneous Localization and Mapping for Automatic Chair Re-Arran...
IRJET- Simultaneous Localization and Mapping for Automatic Chair Re-Arran...
 
LIDAR
LIDARLIDAR
LIDAR
 
BATHYMETRIC LIDAR
BATHYMETRIC LIDARBATHYMETRIC LIDAR
BATHYMETRIC LIDAR
 
LIDAR TECHNOLOGY AND ITS APPLICATION ON FORESTRY
LIDAR TECHNOLOGY AND ITS APPLICATION ON FORESTRYLIDAR TECHNOLOGY AND ITS APPLICATION ON FORESTRY
LIDAR TECHNOLOGY AND ITS APPLICATION ON FORESTRY
 
Introduction to remote sensing and gis
Introduction to remote sensing and gisIntroduction to remote sensing and gis
Introduction to remote sensing and gis
 
Fundamentals of Remote Sensing- A training module
Fundamentals of Remote Sensing- A training moduleFundamentals of Remote Sensing- A training module
Fundamentals of Remote Sensing- A training module
 
Altm (1)
Altm (1)Altm (1)
Altm (1)
 
Lidar technology and it’s applications
Lidar technology and it’s applicationsLidar technology and it’s applications
Lidar technology and it’s applications
 
LiDAR Expected Accuracy Presentation
LiDAR Expected Accuracy PresentationLiDAR Expected Accuracy Presentation
LiDAR Expected Accuracy Presentation
 
Rankin LiDAR presentation
Rankin LiDAR presentationRankin LiDAR presentation
Rankin LiDAR presentation
 
light-detection-and-ranging(lidar)
 light-detection-and-ranging(lidar) light-detection-and-ranging(lidar)
light-detection-and-ranging(lidar)
 
Intro to GIS and Remote Sensing
Intro to GIS and Remote SensingIntro to GIS and Remote Sensing
Intro to GIS and Remote Sensing
 
"Why LiDAR?" Presentation
"Why LiDAR?" Presentation"Why LiDAR?" Presentation
"Why LiDAR?" Presentation
 
Introduction to LiDAR presentation.
Introduction to LiDAR presentation.Introduction to LiDAR presentation.
Introduction to LiDAR presentation.
 
Basic remote sensing and gis
Basic remote sensing and gisBasic remote sensing and gis
Basic remote sensing and gis
 
Lidar and sensing
Lidar and sensingLidar and sensing
Lidar and sensing
 

Ähnlich wie Producing Geographic Data with LIDAR

LiDAR Technology | LiDAR systems
LiDAR Technology | LiDAR systemsLiDAR Technology | LiDAR systems
LiDAR Technology | LiDAR systemsTechwave
 
Laser ScanningLaser scanning is an emerging data acquisition techn.pdf
Laser ScanningLaser scanning is an emerging data acquisition techn.pdfLaser ScanningLaser scanning is an emerging data acquisition techn.pdf
Laser ScanningLaser scanning is an emerging data acquisition techn.pdfanjaniar7gallery
 
THE NATURE AND SOURCE OF GEOGRAPHIC DATA
THE NATURE AND SOURCE OF GEOGRAPHIC DATATHE NATURE AND SOURCE OF GEOGRAPHIC DATA
THE NATURE AND SOURCE OF GEOGRAPHIC DATANadia Aziz
 
LIDAR - What it is, How it works, and How it is used in Robotics.pptx
LIDAR - What it is, How it works, and How it is used in Robotics.pptxLIDAR - What it is, How it works, and How it is used in Robotics.pptx
LIDAR - What it is, How it works, and How it is used in Robotics.pptx277192
 
LIDAR - What it is, How it works, and How it is used in Robotics.pptx
LIDAR - What it is, How it works, and How it is used in Robotics.pptxLIDAR - What it is, How it works, and How it is used in Robotics.pptx
LIDAR - What it is, How it works, and How it is used in Robotics.pptx277192
 
Immersive 3 d visualization of remote sensing data
Immersive 3 d visualization of remote sensing dataImmersive 3 d visualization of remote sensing data
Immersive 3 d visualization of remote sensing datasipij
 
Differentiation between primary and secondary LIDAR system of Remote Sensing
Differentiation between primary and secondary LIDAR system of Remote SensingDifferentiation between primary and secondary LIDAR system of Remote Sensing
Differentiation between primary and secondary LIDAR system of Remote SensingNzar Braim
 
Lidar- light detection and ranging
Lidar- light detection and rangingLidar- light detection and ranging
Lidar- light detection and rangingKarthick Subramaniam
 
Summarize the basic concepts of how lidar (laser scanning) and Struct.pdf
 Summarize the basic concepts of how lidar (laser scanning) and Struct.pdf Summarize the basic concepts of how lidar (laser scanning) and Struct.pdf
Summarize the basic concepts of how lidar (laser scanning) and Struct.pdfajantaemporium1
 
What is LiDAR_ A Guide to its Technical Aspects.pdf
What is LiDAR_ A Guide to its Technical Aspects.pdfWhat is LiDAR_ A Guide to its Technical Aspects.pdf
What is LiDAR_ A Guide to its Technical Aspects.pdfAnil
 
Planning techniques geo informatics
Planning techniques  geo informaticsPlanning techniques  geo informatics
Planning techniques geo informaticsManish Jain Luhadia
 
Remote sensing 311
Remote sensing 311Remote sensing 311
Remote sensing 311Hafez Ahmad
 
Airborne Laser Scanning Remote Sensing with LiDAR.ppt
Airborne Laser Scanning Remote Sensing with LiDAR.pptAirborne Laser Scanning Remote Sensing with LiDAR.ppt
Airborne Laser Scanning Remote Sensing with LiDAR.pptssuser6358fd
 
A hybrid gwr based height estimation method for building
A hybrid gwr based height estimation method for buildingA hybrid gwr based height estimation method for building
A hybrid gwr based height estimation method for buildingAbery Au
 
Surveying Innovations in Quarrying
Surveying Innovations in QuarryingSurveying Innovations in Quarrying
Surveying Innovations in QuarryingErik Birzulis
 

Ähnlich wie Producing Geographic Data with LIDAR (20)

Lidar
LidarLidar
Lidar
 
LiDAR Technology | LiDAR systems
LiDAR Technology | LiDAR systemsLiDAR Technology | LiDAR systems
LiDAR Technology | LiDAR systems
 
Lidar scanner
Lidar scannerLidar scanner
Lidar scanner
 
Laser ScanningLaser scanning is an emerging data acquisition techn.pdf
Laser ScanningLaser scanning is an emerging data acquisition techn.pdfLaser ScanningLaser scanning is an emerging data acquisition techn.pdf
Laser ScanningLaser scanning is an emerging data acquisition techn.pdf
 
THE NATURE AND SOURCE OF GEOGRAPHIC DATA
THE NATURE AND SOURCE OF GEOGRAPHIC DATATHE NATURE AND SOURCE OF GEOGRAPHIC DATA
THE NATURE AND SOURCE OF GEOGRAPHIC DATA
 
LIDAR - What it is, How it works, and How it is used in Robotics.pptx
LIDAR - What it is, How it works, and How it is used in Robotics.pptxLIDAR - What it is, How it works, and How it is used in Robotics.pptx
LIDAR - What it is, How it works, and How it is used in Robotics.pptx
 
LIDAR - What it is, How it works, and How it is used in Robotics.pptx
LIDAR - What it is, How it works, and How it is used in Robotics.pptxLIDAR - What it is, How it works, and How it is used in Robotics.pptx
LIDAR - What it is, How it works, and How it is used in Robotics.pptx
 
Immersive 3 d visualization of remote sensing data
Immersive 3 d visualization of remote sensing dataImmersive 3 d visualization of remote sensing data
Immersive 3 d visualization of remote sensing data
 
Differentiation between primary and secondary LIDAR system of Remote Sensing
Differentiation between primary and secondary LIDAR system of Remote SensingDifferentiation between primary and secondary LIDAR system of Remote Sensing
Differentiation between primary and secondary LIDAR system of Remote Sensing
 
Lidar- light detection and ranging
Lidar- light detection and rangingLidar- light detection and ranging
Lidar- light detection and ranging
 
Summarize the basic concepts of how lidar (laser scanning) and Struct.pdf
 Summarize the basic concepts of how lidar (laser scanning) and Struct.pdf Summarize the basic concepts of how lidar (laser scanning) and Struct.pdf
Summarize the basic concepts of how lidar (laser scanning) and Struct.pdf
 
What is LiDAR_ A Guide to its Technical Aspects.pdf
What is LiDAR_ A Guide to its Technical Aspects.pdfWhat is LiDAR_ A Guide to its Technical Aspects.pdf
What is LiDAR_ A Guide to its Technical Aspects.pdf
 
In sar 1-1-2011
In sar 1-1-2011In sar 1-1-2011
In sar 1-1-2011
 
Planning techniques geo informatics
Planning techniques  geo informaticsPlanning techniques  geo informatics
Planning techniques geo informatics
 
Remote sensing 311
Remote sensing 311Remote sensing 311
Remote sensing 311
 
Airborne Laser Scanning Remote Sensing with LiDAR.ppt
Airborne Laser Scanning Remote Sensing with LiDAR.pptAirborne Laser Scanning Remote Sensing with LiDAR.ppt
Airborne Laser Scanning Remote Sensing with LiDAR.ppt
 
Remote+Sensing
Remote+SensingRemote+Sensing
Remote+Sensing
 
A hybrid gwr based height estimation method for building
A hybrid gwr based height estimation method for buildingA hybrid gwr based height estimation method for building
A hybrid gwr based height estimation method for building
 
Surveying Innovations in Quarrying
Surveying Innovations in QuarryingSurveying Innovations in Quarrying
Surveying Innovations in Quarrying
 
Lidar
LidarLidar
Lidar
 

Producing Geographic Data with LIDAR

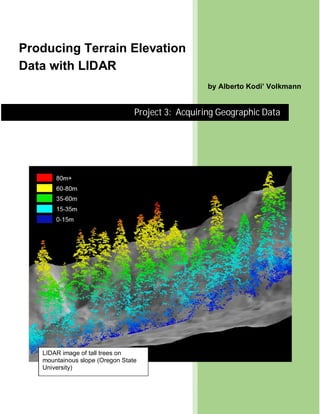
  • 1. Producing Terrain Elevation Data with LIDAR by Alberto Kodi’ Volkmann Project 3: Acquiring Geographic Data LIDAR image of tall trees on mountainous slope (Oregon State University)
  • 2. 1 Project 3: Acquiring Geographic Data Producing Terrain Elevation Data with LIDAR Alberto Kodi’ Volkmann LIDAR LIDAR stands for Light Detection and Ranging, and is a remote sensing technology that measures the distance of an illuminated “target” from an emitting laser to the targeted object. The emitted laser light is reflected off the target and the sending and return times provides the LIDAR sensor with the data to calculate the distance from the LIDAR sensor. LIDAR uses ultraviolet, visible, or near infrared light to image objects, and can target a wide range of materials, including non-metallic objects, rocks, rain, chemical compounds, aerosols, clouds and even single molecules (Wikipedia). In this presentation, I will focus on the ability of LIDAR system to extract Digital Elevation Model, or DEM data, from remote sensing system such as orbiting satellite systems and aerial platforms, but I will also expound upon the latest Engineering, Mapping, and GIS uses of LIDAR technology, which are of key interest to my Civil and Structural design practices and pusuits. LIDAR System Subcomponents LIDAR systems are composed of three main subsystems, the Laser Scanner, the Direct Georeferencing system, and the Computer Processing system (Pennsylvania State University, Topographic Mapping with LIDAR). The Laser Scanner consists of three main sub- components, the opto-mechanical scanner, the ranging unit, and the control processing unit. The Opto-Mechanical Scanner emits a stream of laser pulses which are transmitted to the target, and reflected back to the Ranging Unit. The Ranging Unit contains an electro-optical receiver which records the transmission and reflected reception travel times and provides this data to the Control Processing Unit. These sending/receiving times provide the distance measurements that are then converted into elevation data in the case of aerial or satellite derived data, which then are later converted into Digital Elevation Models, DEMs, or Topographic maps and terrain models. These distance measurements would be of little use to Geographers and GIS specialist, however, if the data could not be properly Figure 1: Topographic relief of Marching Bears Mound Group, Effigy Mounds National Monument, Iowa via LIDAR, Wikipedia georeferenced, which is accomplished by the Direct Georeferencing System.
  • 3. 2 The Direct Georeferencing System, (DG) is composed of two main subcomponents, a GPS or Global Positioning System, and an Inertial Navigation System (INS). These two subsystems provide real time global positioning data as well as track the direction and attitude of the LIDAR carrying vehicle. Typically vehicles used for LIDAR data collection are satellite borne systems and those on aircraft used for aerial data collection, including the recent introduction of drone based systems for localized, highly accurate terrain modeling. The illustration to the left provides a visual for the combination of systems required to provide DG for airborne LIDAR systems. The image shows a digital camera being carried by the aircraft which possibly could be done at the same time as LIDAR imaging, but if we imagine the camera instead being a LIDAR laser scanner we can see the a combination of satellite and ground based technologies are required to provide DG for LIDAR remote sensing. In a DG system, the airborne GPS provides position and velocity of our aircraft, while the INS provides attitude, or orientation, of the sensor to the terrain being imaged or mapped. The LIDAR Laser Scanner measures the distance to the terrain being mapped, which can later be post processed into the elevation data of the terrain that is being over flied. Figure 2: The Components of Direct Georeferencing, (a) the Laser Scanner, (b) Direct Georeferencing System, (c) Computer Processing system, (d) Airborne GPS, (e) terrestrial based GPS base station, and (e) optional RTK GPS. Source: The Pennsylvania State University, Department of Geography (2014), Topographic Mapping with LIDAR During a flight mission, while the DG system records position and orientation data, it also records a corresponding time tag for each laser scan. DG postprocessing software interpolates the position and orientation of the laser reference point at each time tag. With this data and the range measured by the laser, the three- dimensional ground coordinates of every laser return may be computed (Pennsylvania State University, Topographic Mapping with LIDAR). A ground based GPS base station is used to provide a stationary control reference point to provide data for differential correction data. The addition of Real-time differential correction data may also be incorporated into the LIDAR remote sensing operation by using Wide Area Augmentation System, WAAS, and/or Real-time Kinematic GPS signals. It should be noted that in order for a LIDAR system to be accurate, and thus provide usable terrain elevation data, each leg or component of the system must calibrated on a regular schedule, with some elements of the system, such as Boresight Calibration required before/or at the beginning of each scheduled data collection mission.
  • 4. 3 Characteristics of LIDAR Data Discrete Return LIDAR and Full Waveform LIDAR As noted earlier, the Opto-Mechanical Scanner, subcomponent of the Laser Scanner, emits a stream of laser pulses which are transmitted to the target, and reflected back to the Ranging Unit. These laser emissions are composed of electromagnetic energy in the form of light, which is a waveform distribution of light energy. This electromagnetic energy can be recorded in two different manners. A Discrete Return LIDAR records individual (discrete) points for the peaks in the waveform curve. Discrete return LiDAR systems, identify peaks and record a point at each peak location in the waveform curve. These discrete or individual points are called returns. A discrete system may record 1-4 (and sometimes more) returns from each laser pulse. A Full Waveform LiDAR System records a distribution of returned light energy. Full waveform LiDAR data are thus more complex to process, however, they can often capture more information compared to discrete return LiDAR systems. LIDAR Terrain Data vs Digital Elevation Models As noted in our reading in chapter 7, section 8, on National Spatial Data Infrastructure II, Digital Elevation Models, DEMs were produced originally in tiles that correspond to topographic quadrangles. These original DEMs produced 10 meter, and 30 meter DEM grids which provided the initial nationwide elevation model of the continental United States. Elevation data was later interpolated from DLG hypsography and hydrography layers, which provided accuracy up to 3 meters for certain areas of the country. LIDAR by contrast is an active remote sensing system capable of providing accurate terrain modeling with accuracies of 1 cm or better, even to the accuracies in multiples of millimeters (Pennsylvania State University, The Nature of Geographic Information). LIDAR Platforms and their Applications LIDAR systems come in various platforms depending on the application, the size of area to be mapped, and the level of accuracy and precision required for the particular application. The focus of this presentation has been the use of LIDAR for the acquisition of terrain elevation data, which is primarily acquired through the use of satellite based and aerial based LIDAR platforms. It should however be noted that there are other platforms and uses of LIDAR data and we shall take a quick look at some of the other uses of LIDAR data and how they are attained. While it is somewhat out of the scope of this presentation, I would like to highlight a few of newest applications of LIDAR attained data, and their uses in engineering, mapping, and GIS data acquisition. LIDAR has helped to transform the design world by providing concentrated data “clouds” of discrete points, all of which can be georeferenced as has been described earlier in the presentation. This has provided a data stream which lends itself well to the revolution in computer-aided design & drafting processes known as Cad or Cadd. The increased power of desktop computing and the development of Building Information Management systems, or BIM, has taken design from the production of 2D Architectural, Engineering, and Construction (AEC) plans and perspective renderings into a new and exciting realm of 3D modeling and design. What is probably most known to the general public as 3D imagery in products such as Google Earth ™, is just the tip of the iceberg. What were are now see today is the full 3d modeling of the design process which produces “smart” models of a proposed design whether it be a building, road project, highways and bridges, or rail and marine facilities. Where these process get real exciting is that they automate many of the design processes; from cost estimation, quantity take-offs, collision detection (as in piping systems), and even the
  • 5. 4 automation of preliminary design processes and drawing production. While I know I digress from the focus of this report, I would like to show a couple instances of how LIDAR is used in the new era of 3D design processes. Let us first take a look at a process in design called As-builting. As-builting is the documentation of existing structures and is often used to show current state of infrastructure system prior to designing additions to existing infrastructure. As-builting is also done after construction of designed projects to indicate where built conditions differ from design drawings . Figure 3: Point Cloud Sections, Sluck sugar plant in Belarus, ON-SITE TIME: 4 days two person team 576 scan positions COMPLETION TIME 10 days ACCURACY: Image Attributed to 3Deling, Krakow, Poland, < http://www.3deling.com/> The example shown in figure 3, in the lower right corner showns a 3D model of an existing sugar plant in Belarus. This model was acquired using terrestrial based LIDAR, commonly known as laser scanning. As we can see, laser scanning provides a streamlined approach to gathering data about existing building structures and industrial facilities that would often take months or even years prior to the development of modern computer based design processes. What might not be readily apparent, is that the two sections shown in Figure 3 where generated by a computer automatically once a designer determined the position in the existing structure that he or she required a section cut to be made. This somewhat magical process is completly transforming the design process. What is very exciting about these new design methods, is that products such as Autodesk’s Infraworks™ are automating the extraction of preliminary design data from readily available data sources such as USGS DEMs, OpenStreetMaps™ street and road data, and Bing Maps™ aerial photography. The next two images are those of Mt. Hood, Oregon, my in home state and the site of my own wedding at Timberline Lodge on Mt. Hood. What
  • 6. 5 is almost unbelievable is that the process of creating these two rendering of Mt. Hood, which actually include DEM data which can be used for site analysis took less than five minutes to generate. Additionally, the models shown in Figures 4a and 4b were generated using cloud computing, which frees up designers and their computers to work on other design items. Figure 4a: 3D Model of Mt. Hood, Oregon created using Autodesk’s Infraworks 360™ Figure 4b: Perspective view of a 3D Model of Mt. Hood, Oregon created using Autodesk’s Infraworks 360™ The list below summarizes some of the additonal design/analysis process that are a result of the availability of remote sensing data, primarily but not exclusively from LIDAR. The exponential evolution in the power computing and ability to compute 3D models in the cloud are driving factors in these processes. Generation of multiple preliminary designs Traffic Analysis Hydrological and flood plane analysis Stormwater and sewage drainage design Bridge and dam monitoring Facilities inventory Crime and accident scene analysis As-built documentation
  • 7. 6 LIDAR technology has revolutionized how field data is collected, as well as how it is used. Automating & accelerating data collection procedures has cut down on design cost and has created whole new industries based on the modeling of existing infrastructure systems and how we in our communities manage the machinery of our civilizaiton. To conclude my digression into the applications of LIDAR technology, I would like to direct the reader to Figure 5, which shows an example of a terrestial based laser scanner. Figure 5: Terrestrial based Laser Scanner Image Attributed to 3Deling, Krakow, Poland Case Study – New Orleans Flood Inundation after Hurricane Katrina As indicated earlier, terrain modeling based on LIDAR acquired data has other applications other than developing DEMs, additional applications of terrain modeling include Flood Inundation Analysis. In the Topography-based Analysis of Hurricane Katrina Inundation of New Orleans, by Dean Gesch of the USGS we can see how LIDAR Figure 3: High-resolution elevation data of New Orleans, La., derived from light detection and ranging (LIDAR) data collected in 2002. Note that the land along Lake Pontchartrain and the Mississippi River is higher than the land in the center of the city, which is below sea level, resulting in what is often referred to as the bowl shape of New Orleans. Source: USGS (2007), data collected in 2002 was used to provide a rough mapping of the extent and depth of the inundation. On Friday, September 2, 2005, five days after the hurricane, an accurate demarcation from aerial imagery of the extent of the flooding was not yet available, so a topographic methodology was used. As temporary water level gages where still being installed in the city, it was decided to use lake-level gages on the Lake Ponchartrain Causeway. An assumption was made that by the afternoon of September 2, the level of Lake and the flood waters within the
  • 8. 7 city had equalized. A comparison of aerial and satellite imagery taken later, showed that flood delineation derived from the 2002 LIDAR data was a “reasonable depiction” (USGS, 2007). The LIDAR-derived elevation data were also used to calculate rough estimates of the floodwater volumes. The Army Corps of Engineers inquired of the USGS to provide an independent corroboration of their estimates; as accurate estimates of flood water volumes were needed to assess the time required to remove the water from the city. Even though the data derived from LIDAR imagery and on hydrological data from the water gage on Lake Ponchartrain, were provisional; the timeliness of these products was significant for initial response efforts in the first few days after the flooding. The USGS has emphasized that by combining precise elevation information from LIDAR with accurate ground based water-level information and inundation demarcations from remote sensing, a complete history of flooding and water removal can be reconstructed. “Such a history is useful for assessing the effects of flooding on the urban landscape…the effects of depth and length of inundation on different types of structures can be documented” (USGS, 2007). Figure 4. Map of relative water depth in New Orleans, La., on September 2, 2005. The estimated flood depth is based on LIDAR-derived elevation data and water level data from a Lake Pontchartrain gage. Note that the estimated depth of inundation was calculated only for the areas north and east of the Mississippi River enclosed within the heavy black lines Source: USGS (2007), The ready availability of high-resolution, high-accuracy elevation data derived from LIDAR proved valuable for development of topography-based products to provide rough estimates of the inundation of New Orleans from Katrina in the immediate days following the storm. Because of its high level of spatial detail and vertical accuracy
  • 9. 8 of elevation measurements, LIDAR is an excellent mapping technology for use in low-relief hurricane-prone coastal areas. When LIDAR elevation data have been processed and are available before a storm event, as was the case for New Orleans, then geospatial based inundation maps and products can be quickly generated for response and recovery efforts immediately following the storm. Summary In closing, I just would like to say that LIDAR and remote sensing systems are changing the way we look at and interact with our world. It would not be too much of stretch to say that we, as Humankind, are changing because of the technology we are developing and the applications we have developed from these technologies. LIDAR is one more tool that has simplified the way we collect information, process, and analyze the information derived about our environment, whether natural and the manmade. LIDAR has given us many new tools and methods to interpret existing conditions of our built environment and is transforming the design process from conceptualization, to modeling and construction drawing automation. The ability of taking field information and to rapidly convert that data into useable visualizations and conceptual design models has opened new avenues of exploration in current computing trends. Cloud based 3D modeling and web based GIS mapping are just a couple of applications that will need the accurate and cost effective means of data collection that LIDAR provides. I am convinced we are just seeing the beginnings of a revolution in design processes and GIS mapping technologies that will incorporate LIDAR data as bases to their data models.
  • 10. 9 References Wikipedia, LIDAR, Retrieved July 26, 2015, from <https://en.wikipedia.org/wiki/LIDAR> Neon, Work with Data, Discrete vs. Full Waveform LiDAR, Retrieved July 26, 2015, from http://neondataskills.org/remote-sensing/1_About-LiDAR-Data-Light-Detection-and- Ranging_Activity1/#discrete-vs-full-waveform-lidar The Pennsylvania State University, Department of Geography (2014), Topographic Mapping with LIDAR, Retrieved, July 26, 2015, from <https://www.e-education.psu.edu/geog481> The Pennsylvania State University, Department of Geography (2014), The Nature of Geographic Information, Retrieved, July 27, 2015, from <https://www.e-education.psu.edu/natureofgeoinfo> USGS, (2007), Topography-based Analysis of Hurricane Katrina Inundation of New Orleans, Retrieved, July 27, 2015, from <http://pubs.usgs.gov/circ/1306/pdf/c1306_ch3_g.pdf> Final Example of Lidar Scanning As-Built Modeling Terrestrial Laser Scan, Chemical Installation, Netherlands ON-SITE TIME: 3 days two person team 170 scan positions COMPLETION TIME: 10 days ACCURACY: + /-5mm Final product as a registered point cloud in a single local coordinate system. Image Attributed to 3Deling, Krakow, Poland, < http://www.3deling.com/>