MN IT Symposium Products and Platforms OVER Progs, Projs, and; Processes
•
2 gefällt mir•417 views

Don't loose sight of the holistic view of your Products and Platforms while you delivery programs, projects, and processes.

Empfohlen
Empfohlen
Weitere ähnliche Inhalte
Was ist angesagt?
Was ist angesagt? (20)
Andere mochten auch
Andere mochten auch (10)
Ähnlich wie MN IT Symposium Products and Platforms OVER Progs, Projs, and; Processes
Ähnlich wie MN IT Symposium Products and Platforms OVER Progs, Projs, and; Processes (20)
Mehr von DevJam
Mehr von DevJam (11)
Kürzlich hochgeladen
Kürzlich hochgeladen (20)
MN IT Symposium Products and Platforms OVER Progs, Projs, and; Processes
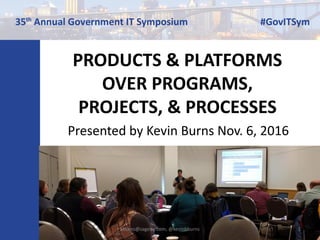
- 1. PRODUCTS & PLATFORMS OVER PROGRAMS, PROJECTS, & PROCESSES Presented by Kevin Burns Nov. 6, 2016 kburns@sagesw.com, @kevinbburns 1
- 2. Before we begin • Write down a question you want answered or a challenges you want a solution for. • We’ll discuss these at the end if not covered in the presentation. kburns@sagesw.com, @kevinbburns 2
- 3. Kevin Burns Coach Org Change Agent
- 7. The short answer… Programs, projects, and processes have a shorter life expectancy than Products (services) and Platforms. Programs, projects, and processes are often expected to end whereas products (services) and platforms are not expected to end. If we focus too intensively on the programs, projects and processes we run the risk of creating fragility in our products (services) and platforms. Prioritize the qualitative aspects of the product (services) and platforms over the programs, projects, and processes. Why are Products (services) and Platforms more important than Progs, Projs, and Processes? kburns@sagesw.com, @kevinbburns 7
- 8. Problem: Programs & Projects vs Products & Platform Structure Challenge Organizing talent around progs and projs vs products (services) and platforms causes the following problems/challenges. • Inefficient coordination of work when it crosses application domains. Queuing contention happens at time of implementation vs upstream in planning phase. • Learning curve required to ramp-up on unfamiliar product (service) and application domain. • Lack of quality ownership within a given domain if we’re constantly shifting domains. Projects are tech debt factories. • Inability to stabilize throughput potential (teams need to be stable in their app domains to produce constant throughput potential and delivery efficiency) • Queuing contention related to code merges and updates are more difficult under project model. • Project code branches exacerbate code merge challenge. • App domains with multiple backlogs (i.e. support and project) causes contention at implementation phase instead of planning phase. • Prioritization problems cause too much context shifting.
- 9. PerformingForming Storming Norming Every time we assemble new teams, teams go through the ‘change process’, i.e., they have to figure-out how to work as a cohesive team.kburns@sagesw.com, @kevinbburns 9
- 10. PerformingForming Storming Norming Let’s reduce the impact of ‘the change process’ by creating stable product (service) or domain teams, i.e., teams that stay together to deliver incremental service value within their application domain of expertise. kburns@sagesw.com, @kevinbburns 10
- 11. Solution: Products & Platforms OVER Progs & Projs Structure talent around product (service) and platform domains (application or service domains). • Product (service) and Tech leads within the product domains support decomposition of large-scale initiatives (programs/projects). • Solution decomposition fills product (service) domain work queues (aka stable delivery team backlogs), i.e., progs/projs funnel stories with unique development needs to the appropriate teams. • Create one backlog within a product capability domain (support and prog/proj stories (work items) get prioritized/sequenced into a single product capability backlog) • Product (service) leadership reconciles contention challenges upstream of stable delivery team implementation through ranking and optimal work sequencing exercises. • Solution decomposition and work sizing exercises inform prioritization and contention reconciliation challenges. • Code quality increases as team members take more ownership of their app domain. • Planning becomes easier as teams take ownership of their throughput potential (velocity). • Team performance increases as teams mature through forming, storming, and norming phases of Satir model.
- 12. In In In In In In Team A Team B Team C Team D Progs / Projs 1 Progs / Projs 2 Progs / Projs 3 Product (service) capability delivery teams are challenged with multiple competing support and project priorities as they iteratively deliver and deploy software. This can cause inefficient context shifting and churn in solutioning and delivery process. This can also lead to fragility and tech debt within the code-base. Consider more intentional focus on prog/proj prioritization/ranking, decomposition, and optimal work sequencing across stable platform service delivery teams. Consider Work-In-Progress agreement limits/targets to support efficient delivery. Rn Rn Rn Stories filling iteration queues Platform Service Area Release Planning
- 13. A Stable Agile Team PO BA SQE SME SM B Stable Agile Team C Stable Agile Team D Stable Agile Team E Stable Agile Team F Stable Agile Team G Stable Agile Team H Stable Agile Team I Stable Agile Team J Stable Agile Team Platform 1 Platform 2 Platform 3 Platform 4 Platform 5 Prog /Proj 2Prog/Proj 1 Prog / Proj 3 Service Area and Tech Lead Solution Team members are challenged with multiple competing project priorities as they iteratively deliver and deploy software. This can cause inefficient context shifting and churn in solutioning and delivery process. This can also lead to fragility and tech debt within the code- base. Consider Work-In-Progress agreement limits/targets to support efficient delivery. Solution Team Solution TeamSolution Team Solution Team Solution Team Service Area Release Planning LSE Arch PO BA SQE SME SM LSE Arch PO BA SQE SME SM LSE Arch PO BA SQE SME SM LSE Arch PO BA SQE SME SM LSE Arch
- 14. Multi-month Monthly 2-weeks Leadership T-Shirt Sizing X-S 1 Sprint S <1 month M 1-3 months L 3-9 months X-L >9 months Team Planning-Poker Fibonacci Sizing (1,2,3,5,8,13,20,50,100) Team task hours to capacity (2,4,6) Solution Decomposition Sizing Pattern
- 17. Lean, XP, Scrum & Kanban kburns@sagesw.com, @kevinbburns 17
- 18. Learning Objective • Who • Why • What • How • When kburns@sagesw.com, @kevinbburns 18
- 20. Socratic Method • Cooperative argumentative dialogue, based on asking and answering questions to stimulate critical thinking • Method of hypothesis elimination • How can we validate what we don’t know? • How can we turn unknowns into knowns? • Help team members arrive at their own conclusions based on Q&A. Don’t give answers away, rather, ask questions that guide team members to the right answer.
- 21. Frederick Taylor's scientific management consisted of four principles: 1. Scientific study of tasks. 2. Develop employees rather than passively leaving them to train themselves. 3. Provide detailed instruction and supervision 4. Divide work equally between managers and workers
- 22. Servant leadership is both a leadership philosophy and set of leadership practices. Traditional leadership generally involves the accumulation and exercise of power by one at the “top of the pyramid.” By comparison, the servant-leader shares power, puts the needs of others first and helps people develop and perform as highly as possible. 1. Server others: How can I help? 2. Promote Teamwork over Individual heros 3. Doers know best how to improve 4. Remove barriers to improvement/progress Robert K. Greenleaf
- 23. Edward Deming Statistical process control and PDSA (Plan-Do-Study-Act) 1. Appreciate the system Are you aware of your constraints? 2. Understanding variation How dynamic is your environment? 3. Psychology Are you safe? 4. Epistemology How are you developing knowledge?
- 24. • Originally known as “just-in-time production” and later as the Toyota Production System (TPS) • Created by Kiichiroo Toyoda and Taiichi Ohno to improve how Toyota operated • Objectives are to: • Eliminate waste • Design out inconsistency • Design out overburdening the system • Lean Manufacturing kburns@sagesw.com, @kevinbburns 24
- 26. • Continuous improvement • Respect for people, psychological safety • Long-term philosophy • Add value to the organization by developing your people and partners • Continuously solving problems drives organizational learning Lean Principles kburns@sagesw.com, @kevinbburns 26
- 27. What & How? kburns@sagesw.com, @kevinbburns 27
- 28. Extreme Programming (XP) • Pair-programming • Rapid application development (RAD) • Experimentation • Prototype kburns@sagesw.com, @kevinbburns 28
- 29. Scrum Events • Plan • Daily Standup • Demo and Review • Retrospective Iteratively and incrementally deliver value kburns@sagesw.com, @kevinbburns 29
- 30. • Based on Toyota’s “just-in-time production” concept • Japanese word for “visual signal” or “card” • Used to show a sequence of events with instructions on the cards, when used in manufacturing • Enables inventory control with visibility into the full system to find areas of improvement Kanban kburns@sagesw.com, @kevinbburns 30
- 31. Kanban Software Development • Cards move across a Kanban board as the team works on them • Emphasizes continuous delivery without over burdening the team • Three basic principles: • Workflow (continuous) • Work In Progress limit (WIP) • Flow (cycle-time) kburns@sagesw.com, @kevinbburns 31
- 32. Kanban Board Example 1 kburns@sagesw.com, @kevinbburns 32
- 33. Kanban Board Example 2 kburns@sagesw.com, @kevinbburns 33
- 34. Kanban Board Example 3 kburns@sagesw.com, @kevinbburns 34
- 35. Task Board Example 1 kburns@sagesw.com, @kevinbburns 35
- 36. Task Board Example 2 kburns@sagesw.com, @kevinbburns 36
- 37. Kanban Board Example 4 kburns@sagesw.com, @kevinbburns 37
- 39. Do any of these sound familiar? • “We’ve done Scrum for a long time now and our process improvement has levelled off. How can we take our process to the next level?” • “Our needs and priorities shift on a daily basis” • “We don’t like fixed-length, fixed-commitment iterations” • “We are spending too much time planning and estimating” kburns@sagesw.com, @kevinbburns 39
- 40. Scrum vs. Kanban Scrum Kanban Process tool based in Lean and Agile principles Process tool based in Lean and Agile principles Empirical process Empirical process Plans work in time-boxes called Sprints with prescribed activities at beginning and end of each Sprint Is a flow-based model with no prescribed ceremonies. Team can choose to do ceremonies whenever they deem necessary Places a WIP limit on the amount of work to be completed in a Sprint (Sprint Backlog based on Velocity) Places WIP limits on each workflow state 3 specific roles No specific roles Prescribes sizing work items which is then measured as Velocity Measures lead time (time it takes for item to go through the entire workflow) without sizing work items Source: http://www.infoq.com/minibooks/kanban-scrum-minibook kburns@sagesw.com, @kevinbburns 40
- 41. Don Reinertsen’s Seven Big Ideas 2nd Generation Lean Product Development 1. Understand your economics 2. Manage your queues 3. Exploit variability 4. Enable smaller batches 5. Control WIP and start rates 6. Prioritize based on economics 7. Accelerate feedback kburns@sagesw.com, @kevinbburns 41
- 42. Guidelines for decision-making • Set strategic goals/guidelines for decision-making so low-level tactical decision can be decentralized while still being aligned within strategic goals/objectives. • While good intentioned, centralized decision-making is often slow and suboptimal because it lacks the context of all the variable at play at tackle level Don Rienertsen’s 2GLPD kburns@sagesw.com, @kevinbburns 42
- 43. 2. Manage Your Queues • Many product developers assume higher utilization leads to faster development. • They neither measure nor manage the invisible queues in their process. • Consequently, they underestimate the true cost of overloading their processes. • Such overloads severely hurt all aspects of development performance. Don Rienertsen’s 2GLPD kburns@sagesw.com, @kevinbburns 43
- 44. Effect of Capacity Utilization 10 20 30 40 50 60 70 80 90 100 05101520 QueueSize % Capacity Utilization Don Rienertsen’s 2GLPD kburns@sagesw.com, @kevinbburns 44
- 45. Managing Queues Cost of Excess Delay Total Cost Dollars Excess Product Development Resources Minimize Total Cost to Maximize Profits Don Rienertsen’s 2GLPD kburns@sagesw.com, @kevinbburns 45
- 46. Why Queues Matter • Queues Create… – Longer cycle time – Lower Quality – More variability – Increased risk – More overhead – Less motivation Managing queues is the key to improving product development economics Don Rienertsen’s 2GLPD kburns@sagesw.com, @kevinbburns 46
- 47. 3. Exploit Variability • Manufacturing wants reduced variability • Product development needs variability in order to innovate • We need to understand what makes variability valuable and manage our process to create these conditions • We need a development process that functions in the presence of variability Don Rienertsen’s 2GLPD kburns@sagesw.com, @kevinbburns 47
- 48. Asymmetric Payoff and Option Pricing Expected Price Payoff vs Price Expected Payoff ExpectedPayoff Price PricePrice Probabili ty Payoff Strike Price Strike Price Don Rienertsen’s 2GLPD kburns@sagesw.com, @kevinbburns 48
- 49. Higher Variability Raises the Payoff ExpectedPayoff Pric e Strike Price Payoff SD = 15 Payoff SD = 5 Option Price = 2, Strike Price = 50, Mean Price – 50, Standard Deviation = 5 and 15 Don Rienertsen’s 2GLPD kburns@sagesw.com, @kevinbburns 49
- 50. 4. Enable Smaller Batches • When work products are invisible, batch sizes are invisible • When batch sizes are invisible, product developers pay little attention to them • Many companies institutionalize large batch sizes • Batch size reduction is attractive because it is fast, easy, cheap, granular, leveraged, and reversible • It is a great starting point for LPD Batch Size Queues Cycle Time X 0.5 X 0.5 X 0.5 Don Rienertsen’s 2GLPD kburns@sagesw.com, @kevinbburns 50
- 51. Drawing Review Process 200 10 Weeks 20 1 Week Unreviewed Drawings Large Batch Small Batch Don Rienertsen’s 2GLPD kburns@sagesw.com, @kevinbburns 51
- 52. Benefits of Small Batch Testing Higher Validity Fewer Open Bugs Faster Cycle Time Early Feedback Less Debug Complexity More Efficient Debugging More Uptime Smaller Change Fewer Status Reports Less Requirement Changes Faster Learning Lower Cost Changes Cheaper Debugging Cheaper Testing Less Non-Value- Added Better Code Cheaper Correction Better Economics Don Rienertsen’s 2GLPD kburns@sagesw.com, @kevinbburns 52
- 53. Setting Batch Size Transaction Cost Cost Items per Batch Economic Batch Size 1 2 3 4 5 6 7 8 9 10 05101520 Total Cost Don Rienertsen’s 2GLPD kburns@sagesw.com, @kevinbburns 53
- 54. 5. Control WIP and Start Rates • Many developers incorrectly assume that the sooner they start work, the sooner they will finish it • They are constantly tempted to start too much work • This dilutes resources and causes long transit time through their processes • A long transit time hurts efficiency, quality and responsiveness Don Rienertsen’s 2GLPD kburns@sagesw.com, @kevinbburns 54
- 55. Little’s Formula • By constraining WIP in development processes we can control cycle time • This approach, which is known as Lean Kanban, is currently growing rapidly in software development MeanResponseTime = MeanNumberInSystem / MeanThroughput Don Rienertsen’s 2GLPD kburns@sagesw.com, @kevinbburns 55
- 56. Control Number of Active Projects 1 2 3 4 1 2 3 4 COD Savings of Proj 1 & 2 Late Start Advantages for Proj 3 & 4 Time to Deliver Time to Deliver Time to Deliver Don Rienertsen’s 2GLPD kburns@sagesw.com, @kevinbburns 56
- 57. Avoid Long Planning Horizons • The further out you plan, the less likely your forecast will be accurate • Don’t do detailed analysis on things beyond a quarter • Market conditions change everyday, this can change requirements • Changing requirements cause churn (waste) Don Rienertsen’s 2GLPD kburns@sagesw.com, @kevinbburns 57
- 58. Use Visual WIP Control Boards Ready Queue Coding Ready to Test Testing Done WIP constraints = 10 13 14 15 16 11 10 9 8 7 6 5 4 3 2 1 12 ? Don Rienertsen’s 2GLPD kburns@sagesw.com, @kevinbburns 58
- 59. 6. Sequence Work Correctly • The sequence in which work is processed is called the queuing discipline • By changing the queuing discipline we can reduce the cost of a queue without decreasing the size of the queue • Since manufacturing has homogeneous flows it always uses FIFO (First-In-First-Out) • For the non-homogeneous flows of product development other approaches have better economics Don Rienertsen’s 2GLPD kburns@sagesw.com, @kevinbburns 59
- 60. Use FIFO for Homogeneous Flow First-In First-Out Cost of Delay 1 2 3 A B Time Cost Delay Cost Last-In First-Out Cost of Delay 1 2 3 A B Time Cost Project Duration Cost of Delay 1 3 3 2 3 3 3 3 3 Don Rienertsen’s 2GLPD kburns@sagesw.com, @kevinbburns 60
- 61. Weighted Shortest Job First (WSJF) for Non-homogenous flow High Weight First Cost of Delay 1 2 3 A B Time Cost Delay Cost Low Weight First Cost of Delay A B Time Cost Project Duration Cost of Delay Weight = COD/Duration 1 1 10 10 2 3 3 1 3 10 1 0.1 1 2 3 160 7 96 % Reduction in COD Don Rienertsen’s 2GLPD kburns@sagesw.com, @kevinbburns 61
- 62. 10 Minute Break Collect Questions and Challenges kburns@sagesw.com, @kevinbburns 62
- 63. Culture Survey Text ‘kevinburns785’ to ‘22333’, and then type A, B, C, D kburns@sagesw.com, @kevinbburns 63
- 69. Westrum Model: How orgs process info Pathological Bureaucratic Generative Power oriented Rule oriented Performance oriented Low cooperation Modest cooperation High cooperation Messengers shot Messengers neglected Messengers trained Responsibilities shirked Narrow responsibilities Risks are shared Bridging discouraged Bridging tolerated Bridging encouraged Failure scapegoating Failure justice Failure inquiry Novelty crushed Novelty problems Novelty implemented
- 70. How do we learn? What helps us learn? How psychologically safe is our environment? Coaching, Mentoring, Learning
- 71. Child vs Adult learning style Children (Pedagogy) Adults (Andragogy) Rely on others to decide what is important to be learned Decide for themselves what is important to learn Accept info being presented at face value Need to validate the info based on their beliefs and experience Expects what they are learning to be useful in their long-term future Expects what they are learning to be immediately useful Have little or no experience upon which to draw – are relatively “clean slates” Have much experience upon which to draw – may have fixed viewpoints. Little ability to serve as a knowledgeable resource to teacher or fellow classmates Significant ability to serve as a knowledgeable resource to trainer and fellow learners.
- 72. Four Types of Learners Learner Tactics Visual Learners prefer to see info and to visualize the relationships between ideas Give them charts and graphics, make your presentation highly visual and show relationships between your points Auditory learners prefer to hear info rather than reading it or seeing it displayed visually Give them a chance to repeat your points back to you by asking questions, calling for audience participation Reading/Writing learners prefer to interact with text more than hearing or seeing it graphically Give them written quizzes or a chance to write what they are learning and give them handouts to read. Kinesthetic learners prefer hands-on experiential learning; they learn best by doing. Give them exercises that get them out of their seat and into role play type exercises.
- 73. Scientific Management vs Servant Leadership Scientific Managers Servant Leaders Study tasks of others Help others complete their tasks Develop employees Promote teamwork over individual heros Provides detailed instruction and supervision Doers know best how to improve, help find way forward Divide work nearly equally between managers and doers Remove barriers to improvement/progress and facilitate teamwork
- 74. Leading Minds
- 75. The Zen Master 1. Lead from the inside-out 2. Bench the ego 3. Let each player discover his own destiny 4. The road to freedom is a beautiful system 5. Turn the mundane into the sacred 6. One breath = one mind 7. The key to success is compassion 8. Keep your eye on the spirit, not on the scoreboard 9. Sometimes you have to pull out the big stick 10. When in doubt, do nothing 11. Forget the ring
- 76. Edward Deming Measure impact, validate learning, pivot, adjust Statistical process control and PDSA (Plan-Do-Study-Act) 1. Appreciate the system Are you about your constraints? 2. Understanding variation How dynamic is your environment? 3. Psychology Are you safe? 4. Epistemology How are you developing knowledge?
- 77. Lean Startup Build Measure Learn Value Use a scientific method to learn
- 82. Shu Ha Ri • Shu, the student copies techniques without adapting them. • Learn • Ha, the student reflects on what’s been learned and breaks free from traditions. • Practice • Ri, the student is now a practitioner extending the art. • Innovate
- 83. Teams are motivated by… 1. Distinct vision and mission, a view of future state OKR = Objectives and Key Results 2. Foster personal growth and career development Do we foster a learning culture? 3. Recognize good performance on a regular basis, celebrate success Did we achieve our Key Results? 4. Listen to employee comments, complaints, ideas and take action where appropriate. Do you have a generative env? How psychologically safe is your evn? Are you a Server Leader or a Scientific Manager (or both)? 5. Encourage and empower employees to be self-directed Are you encouraging experimentation?
- 84. Quotes “Control leads to compliance; autonomy leads to engagement.” Daniel Pink “Treat them like volunteers” Mary Poppendieck “The Team is the Product Owner” Mary Poppendieck “Quality tends to fan out like waves” Robert M. Pirsig
- 85. Exercise: Coaching Attributes 1. Everyone writes their top coaching attributes on individual posted notes 2. We take turns putting them on the board into themes 3. We rank them in terms of important/value in our work environment 4. We discuss how to put them into practice
- 86. Exercise: Great Coaching Practices 1. Everyone writes their top coaching practices on individual posted notes 2. We take turns putting them on the board into themes 3. We rank them in terms of important/value in our work environment 4. We discuss how to put them into practice
- 87. Exercise: Agile Principles Survey 1. Conduct an Agile Principles Survey 2. Review and discuss results 3. Where are we doing well vs not so well? 4. What can we do to improve low preforming areas?
- 88. What are your biggest challenges? Let’s have a collaborative discussion about your biggest challenges.
- 89. Wrap-up questions • What did you learn today that you want to try? • Is there anything blocking you from trying it? • When will you try it?
- 90. Thank you! Kevin.burns@devjam.com kburns@sagesw.com #kevinbburns Please take a moment to fill out the evaluation. kburns@sagesw.com, @kevinbburns 90
- 91. How to find Educational Session Evaluation 1. Open the Government IT Symposium Guidebook app on your mobile device. 2. Click on the menu bar on the top of the homepage. 3. Find and click on “Agenda & Educational Sessions” within the menu. 4. Scroll and find Session ______ (fill in your session title here) 5. Click on the Session and scroll to the bottom of the page to find “Educational Session Survey” and fill out the survey! If you haven’t already downloaded our mobile app, below are the instructions on how to download the app: https://guidebook.com/g/itsym 1. Visit the above URL on your device 2. Tap the “download” button to get the free Guidebook app 3. Open Guidebook and look for the guide: Government IT Symposium kburns@sagesw.com, @kevinbburns 91
Hinweis der Redaktion
- Poll Title: Do you have a question you wanted answered in this session? https://www.polleverywhere.com/free_text_polls/cfpXCIosDZR0Ldd
- There can be a variety of columns teams may choose to use, all depending on their states in their workflow process. If they choose to have columns representing different activities, such as development, testing, user sign-off, the team must remain disciplined so as not to associate those activities with specific roles or individuals on the teams. Although people have specific skillsets, the whole team must work together to complete a work item and move it all the way across the board. Each column has a specified WIP limit in order to streamline the flow of items through the wholeflow work state.
- There can be a variety of columns teams may choose to use, all depending on their states in their workflow process. If they choose to have columns representing different activities, such as development, testing, user sign-off, the team must remain disciplined so as not to associate those activities with specific roles or individuals on the teams. Although people have specific skillsets, the whole team must work together to complete a work item and move it all the way across the board. Each column has a specified WIP limit in order to streamline the flow of items through the wholeflow work state.
- There can be a variety of columns teams may choose to use, all depending on their states in their workflow process. If they choose to have columns representing different activities, such as development, testing, user sign-off, the team must remain disciplined so as not to associate those activities with specific roles or individuals on the teams. Although people have specific skillsets, the whole team must work together to complete a work item and move it all the way across the board. Each column has a specified WIP limit in order to streamline the flow of items through the wholeflow work state.
- There can be a variety of columns teams may choose to use, all depending on their states in their workflow process. If they choose to have columns representing different activities, such as development, testing, user sign-off, the team must remain disciplined so as not to associate those activities with specific roles or individuals on the teams. Although people have specific skillsets, the whole team must work together to complete a work item and move it all the way across the board. Each column has a specified WIP limit in order to streamline the flow of items through the wholeflow work state.
- There can be a variety of columns teams may choose to use, all depending on their states in their workflow process. If they choose to have columns representing different activities, such as development, testing, user sign-off, the team must remain disciplined so as not to associate those activities with specific roles or individuals on the teams. Although people have specific skillsets, the whole team must work together to complete a work item and move it all the way across the board. Each column has a specified WIP limit in order to streamline the flow of items through the wholeflow work state.
- There can be a variety of columns teams may choose to use, all depending on their states in their workflow process. If they choose to have columns representing different activities, such as development, testing, user sign-off, the team must remain disciplined so as not to associate those activities with specific roles or individuals on the teams. Although people have specific skillsets, the whole team must work together to complete a work item and move it all the way across the board. Each column has a specified WIP limit in order to streamline the flow of items through the wholeflow work state.
- This could be turned into a large or small group discussion, rather than have it all presented as a lecture. If in a small group discussion format, once the groups have time to discuss, each group can share with the whole class 1 or 2 items they came up with. The instructor can then fill out any areas they missed or correct any misunderstandings.
- Information queues are invisible…you can’t see them. This is completely different from manufacturing where you can see inventory and product backups visiably Use rush hour traffic as an example of how the problem is non-linear. Removing 1 lane from a 4 lane hwy does more damage that 25%.
- Assumes M/M/1/~ Queue, p = Capacity Untilization Instead of the deterministic view that we should load to 100% of capacity, Roe formal says the queue starts to double for every next level of utilization saught once you get around 70 of capacity. Control queue size to optimize cycle-time. Little’s formula Google 20% excess capacity 3M 155 excess capacity
- Fast feedback loops are critical Example of developer feedback within one day versus 90 days.
- Manufacturing strives to eliminate variability but innovation needs variability to be success. Creatativity is asymmetrical and non-linear
- Manufacturing strives to eliminate variability but innovation needs variability to be success. Creativity is asymmetrical and non-linear
- Egg example Only expose a small percent of our customers to the new code
- Example of starbucks coffee line with 20 people in line, processing 5 people every 1 minute, means I’ll get my coffee in 5 minutes.
- If you know the cost of delay, these is an easy decision.
- Gantt and Pert charts couldn’t tells queue challenges because they are time-based The Kanban board is work item status based and thus provide an instant visual representation of where the bottleneck might be. What options are available to the developer looking for work?
- Comparing COD to duration of effort give you object project priority
- Poll Title: On my team, new ideas are welcomed, encouraged, and shared. https://www.polleverywhere.com/multiple_choice_polls/5HEsKyeRUh7KUWB
- Poll Title: On my team, information is actively sought and learning is prioritized. https://www.polleverywhere.com/multiple_choice_polls/pwr98lbv3B7mZww
- Poll Title: On my team, failures are learning opportunities, and messengers of them are not punished. https://www.polleverywhere.com/multiple_choice_polls/eQJSZXIAdrGqIDX
- Poll Title: On my team, responsibilities are shared. https://www.polleverywhere.com/multiple_choice_polls/GvKTmSpMq3ZGqkL
- Poll Title: On my team, cross-functional collaboration is encouraged and rewarded. https://www.polleverywhere.com/multiple_choice_polls/1GHUhbg6AMryx7o
- Ed Catmull’s new book Creativity, Inc about Pixar Image: Ed Catmull, Steve Jobs, and John Lasseter