1. 1
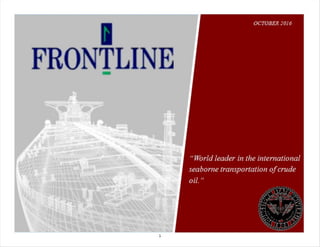
“World leader in the international
seaborne transportation of crude
oil.”
OCTOBER 2016
2. 2
OUTLINE
FRONTLINE AT A GLANCE
INDUSTRY OVERVIEW
INVESTMENT DRIVERS
VALUATION & CONSIDERATIONS
APPENDIX
3. 3
COUNTRIES OF OPERATIONS
KEY CORPORATE FACTS AS OF Q2 2016
FRO: WORLD LEADER
FLEET OF 54 SHIPS*
VLCC (24)
MR (2)
LR2 (14)
Suezmax (14)
NEWBUILD SCHEDULE:
6 in 2016
14 in 2017
INCORPORATED ON JULY 12TH
, 1992
HEADQUARTERED IN BURMUDA
Transfers crude and refined oil throughout the
world
Recent merger with Frontline 2012
Majority of revenues earned through time
charters and spot contracts
Balanced fleet = Reduced risk
John Fredriksen - President and Chairman of
the board since 1997
United States, Canada, and US
territories
Far East Asia and Indian
Ocean
West Africa
Middle East
Northern Europe
*Frontline — Q2 All other 2015/20-F
Fleet excludes 6 MR tankers being sold in Q3 in 2016
Includes 2 VLCC acquisitions - September 2016 and January 2017
Excludes 4 VLCC from newbuild due to uncertainty
Sources for all content: FRO 20-F
4. 4
OUTLINE
FRONTLINE AT A GLANCE
INDUSTRY OVERVIEW
INVESTMENT DRIVERS
VALUATION & CONSIDERATIONS
APPENDIX
5. 5
Company
TCE Average Revenue
2015 ($/Day)
Overview
Nordic American Tankers Ltd.
$37,228
Founded in 1995, Nordic operates globally using only Suezmax tankers to
distribute oil to their clients. Being able to interchange assets sets them apart
from their competition.
Teekay Tankers Ltd.
$29,733
Formed by Teekay Corporation in 2007, they have grown as an industry
competitor from 980,000 DWT to 7,650,000 DWT capacity. Through time
charters, ship to ship services, spot market, and pooling arrangements, Teekay
Tankers generates revenue from a myriad of sources.
Gener8 Maritime Inc.
$25,245
Engaging in pooling arrangements and newbuilds of VLCCs, Gener8 Maritime
employs a unique strategy with 91% of their operations coming from the spot
market through pooling arrangements.
Tsakos Energy Navigation Limited
$25,940
Headquarted in Greece, Tsakos provides services to high quality oil companies
throughout the world. Relationship building through Tsakos Columbia
Shipmanagment and Tsakos Shipping provides more access to ships not owned
by the company.
Overseas Shipholding Group Inc.
$34,470
United States company headquartered in New York which charters oil and
petroleum (LNG) on a global scale. A diversified ship fleet gives rise to
competitive advantage.
COMPETITIVE LANDSCAPE
The competitive landscape of the oil tanking industry includes
global corporations that operate in the spot and fixed charter
markets independent from multi-national oil companies. Their
fleets consist of multiple sized ships providing both refined and
crude products, and serve the world’s developed markets and
emerging economies.
Sources for all content: FRO, NAT, TNK, TNP 20-F and GNRT,OSG 10-K
6. 6
SPOT VERSUS CHARTER MARKET
Spot Market : A volatile source of revenue that fluctuates
based on oil demand, supply, and industry capacity,
The time frame for a contract can last from a couple of days to
several weeks. As demand for oil increases, demand for tankers
increases to transport the products around the world.
This, in turn, drives TCE rates higher. As supply increases,
demand for tanker ships increases for storage purposes.
Frontline diversifies themselves among others by employing
59% of their ships within the spot market.
Time Charter Market: A steady stream of income from
charterers. This entails a nation, oil company, or other entity
signing an agreement to hire a vessel for a specified period of
time under a specific rate.
Under Frontline’s strategy, they employ 41% of their ships
through the fixed market.
FRO: SPOT TO FIXED FLEET DISTRIBUTION 2015
Sources for all content: FRO 20-F
7. 7
DETERMINATES OF REVENUE:
Dirty vs Clean Cargo
The Baltic indices track daily charter rates that drive oil tanker revenue. These rates are determine by the prices commodity producers pay to
have their goods shipped by sea.
The Baltic Clean Index (BCIY:IND) displays the revenue intake from the shipment of refined oil products while the Baltic Dirty Index
(BDIY:IND) shows the revenue intake from the shipment of crude oil products.
Frontline hedges risk by balancing their ship fleet to handle both crude and refined products.
Sources for all content: Lloyds Intelligence and EIA
8. 8
MR TCE SPOT MARKET EARNINGS
(in thousands)
VLCC TCE SPOT MARKET EARNINGS
(in thousands)
SUEXMAX TCE SPOT MARKET EARNINGS
(in thousands)
SPOT MARKET EARNINGS IN
RELATION TO ECONOMIC
INDICATORS
Historical global data indicates that world GDP
and oil demand growth have a strong positive
correlation – with increased economic growth
there is an increased need to consume oil.
Spot market rates generally follow oil demand
growth. With World GDP increasing by 2.46%
from 2014 to 2015, Frontline has experienced
higher time charter equivalency rates in the spot
market. As Frontline’s fleet is 59% percent part
of the spot market, revenue is derived from the
improved rates.
Sources for all content: TNP 20-F
9. 9
OIL CAPTURES 32.9% OF GLOBAL
ENERGY MARKET
AVG. FORECASTED QUARTERLY PERCENT CHANGE IN DEMAND
Third quarter’s growth is
predominately due to
seasonality in the
industry. In OECD coun-
tries, there is a high de-
mand for heating oil in
winter.
WORLD ENERGY CONSUMPTION BY ENERGY 1990-2040
(QUADRILLION BTU)
AVG. FORECASTED QUARTERLY GROWTH IN DEMAND
Annual rGDP
growth in the United
States, China, and
India indicate their
need to increase
consumption of
crude oil.
Worldwide,
consumption rates
of liquid fuels are
expected to improve
1.14% per year to
meet a growth rate
of 3.3% per year.
Petroleum products include
transportation fuels,
heating oil and electricity
generation, asphalt and
road oil, and feedstock for
chemicals and plastics.
United States primarily
uses oil for gasoline (76%)
and heating oil (21%).
rGDPGROWTHRATES,2012-2040(AVG.%CHANGE)
Sources for all content: EIA
10. 10
OIL: WORLD’S LEADING FUEL
OVER 1,100 BARRELS OF OIL ARE
CONSUMED PER SECOND WORLDWIDE
INDIA
3.66
MILLION B/D
RUSSIA
3.49
MILLION B/D
CHINA
10.48
MILLION B/DMIDDLE EAST
10.00
MILLION B/D
UNITED STATES
AND CANADA
21.44
MILLION B/D
EUROPE
13.70
MILLION B/D
BRAZIL
3.00
MILLION B/D
AFRICA
4.50
MILLION B/D
FRO VLCC ROUTE
FRO NON-VLCC ROUTE
Frontline’s investment in VLCC, Suezmax, and LR2 vessels position it to capture increasing refined and crude oil consumption de-
mands in emerging markets such as India, China, Brazil, and Africa. These markets’ expected demand growth is due to improve-
ments in motorization rates, refinery production, and technological development. Frontline’s routes also allow for a secure market
share in developed countries’ energy demand.
Sources for all content: FRO 20-F and EIA
11. 11
US EXPERIENCES HIGHEST
AUTOMOBILE SALES IN HISTORY
US Motor Vehicle Sales in 2015 reached an
all-time high of 17.39 million units sold
(5.8% increase from 2014) with truck
(56.7% market share) outselling cars
(43.3%).
Light truck sales have increased nearly 13%
over 2014. Looking ahead, forecasters such
as WardsAuto see 2016 motor vehicle sales
reaching another historic high.
Consumers are showing buying preferences
for less fuel efficient vehicles. With light
trucks being 27% less fuel efficient than
passenger cars, this indicates that depressed
national retail gas prices of approximately
$2.19 have encouraged consumers to be
more tolerant of less fuel efficient vehicles.
“US drivers set record of
3.1 trillion miles in 2015”
-Department of Transportation
“4% growth in
motorization rate to 808
vehicles per 1,000
inhabitants”
-International Organizations of Motor Vehicle
Manufactures
US VEHICLE SALES, 2015
FORECASTED US VEHICLE SALES
Sources for all content: Auto Alliance
12. 12
NORTHERN US BRACES FOR
“EXCEPTIONALLY COLD WINTER”
With nearly 25% of Americans - predominately
residing in the Northeast - relying on heating oil to
warm their homes in the winter and the Farmer’s
Almanac predicting an “exceptionally cold” winter
(potentially reaching 40 degrees below zero in
February) for the Northern Plains, Great Lakes,
Ohio Valley, Middle Atlantic, Northeast, and New
England, predictions can be made that there may
be increase in the consumption of heating oil.
Forecasters predict that heating oil will hold steady
at near-historic low of 1.45USD/GAL over the
next twelves months, further encouraging
consumption.
FORECASTED US HEATING OIL RATES ($/GAL)
Sources for all content: EIA, Farmer’s Almanac
13. 13
OIL CAPTURES 96% OF GLOBAL
TRANSPORTATION ENERGY MARKET
94% of the projected growth in world transportation
energy consumption is seen in the non-OECD countries;
predominately in India, China, and Brazil.
China’s demand alone for oil is expected to increase by
2.7% a year. Currently, China is investing in stockpiles of
oil to meet future consumption needs with the expectation
that demand will soon outstrip the available supply.
World motorization rates have improved by 25% since last
year as the standard of living in developing countries rise
and encourage consumers purchase personal vehicles. This
is reflected in the growth of vehicle sales in the past year.
WORLD ENERGY DEMAND
BY ENERGY SOURCE (BTU)
HISTORICAL WORLD CONSUMPTION OF OIL
GROWTH IN SALES OF VEHICLES
BY COUNTRY
Sources for all content: TNP 20-F, OICA, and EIA
14. 14
OUTLINE
FRONTLINE AT A GLANCE
INDUSTRY OVERVIEW
INVESTMENT DRIVERS
VALUATION & CONSIDERATIONS
APPENDIX
15. 15
FRONTLINE
LONG HISTORY OF RETURNING VALUE TO SHAREHOLDERS
Ability to Capture
Emerging
Markets
Highest Return
Due to Efficient
Margins
Hedging Risk
with Diversifying
Contracts
Superior
Distribution
of Fleet
16. 16
FRONTLINE
LONG HISTORY OF RETURNING VALUE TO SHAREHOLDERS
Ability to Capture Emerging Markets with Time Charter Equivalence
Frontline holds the highest time charter equivalent rates relative to the industry. With 20 newbuilds coming online over the next
year, they seek to hold the largest market share within the tanker industry.
VLCC AS PERCENTAGE OF INDUSTRY*
TIME CHARTER EQUIVALENCE BY COMPETITOR ($)
*Frontline — Q2 All other 2015/20-F
Fleet excludes 6 MR tankers being sold in Q3 in 2016
Includes 2 VLCC acquisitions - September 2016 and January 2017
Excludes 4 VLCC from newbuild due to uncertainty
Relative to competitors, Frontline commands the largest market share of the VLCC fleet. VLCC tankers generate the most reve-
nue in the spot market.
Sources for all content: FRO 20-F
($/DAY)
17. 17
FRONTLINE
LONG HISTORY OF RETURNING VALUE TO SHAREHOLDERS
Highest Return Due to Efficient
Margins
The financials for Frontline fair well against their competitors.
From 2014 to 2015, the overall oil tanker industry has improved.
This comes from higher revenues year over year due to an oil
supply glut in 2014. This has increased every competitor's
margins down the line. Frontline has enjoyed this appreciation
well above their competitors, beating most in nearly every
category. This has contributed to low operating costs relative to
net revenues.
Hedging Risk with Diversifying
Contracts
By having a well balanced set of contracts, Frontline is able to
hedge its risk against volatility in the market. Frontline is able to
maintain profitability regardless of spot market fluctuations due to
consistent charter rate revenues. When spot markets improve in
the winter months, Frontline stands to gain from the increased
prices.
SPOT TO FIXED FLEET COMPARISION
Sources for all content: FRO, NAT, TNK, TNP 20-F and GNRT, OSG 10-K
18. 18
FRONTLINE
LONG HISTORY OF RETURNING VALUE TO SHAREHOLDERS
Superior Distribution of Fleet
Frontline’s vessels are well diversified compared to their competitors. Frontline
penetrates both the refined and crude global oil tanking markets by maintaining a
specialized fleet of tankers, leading to cost efficiency in expenses. Having the
largest fleet, they are poised to generate increasing revenues, overall improved
profitability, and return to shareholders.
TOTAL FLEET COMPARISION
Sources for all content: FRO, NAT, TNK, TNP 20-F and GNRT, OSG 10-K
*FRO fleet excludes 6 MR tankers being sold in Q3 in 2016
Includes 2 VLCC acquisitions - September 2016 and January 2017
Excludes 4 VLCC from newbuild due to uncertainty
19. 19
OUTLINE
FRONTLINE AT A GLANCE
INDUSTRY OVERVIEW
INVESTMENT DRIVERS
VALUATION & CONSIDERATIONS
APPENDIX
20. 20
TARGET PRICE’S AND POTENTIAL RETURN
*Frontline -Q2 All other 2015/20-F
Fleet excludes 6 MR tankers being sold in Q3 in 2016
Includes 2 VLCC acquisitions - September 2016 and January 2017
Excludes 4 VLCC from newbuild due to uncertainty
Sources for all content: FRO, NAT, TNK, TNP 20-F and GNRT,OSG 10-K
21. 21
*Frontline - Q2 All other 2015/20-F
Fleet excludes 6 MR tankers being sold in Q3 in 2016
Includes 2 VLCC acquisitions - September 2016 and January 2017
Excludes 4 VLCC from newbuild due to uncertainty
Sources for all content: FRO, NAT, TNK, TNP 20-F and GNRT, OSG 10-K
22. 22
*Frontline -Q2 All other 2015/20-F
Fleet excludes 6 MR tankers being sold in Q3 in 2016
Includes 2 VLCC acquisitions - September 2016 and January 2017
Excludes 4 VLCC from newbuild due to uncertainty
Sources for all content: FRO, NAT, TNK, TNP 20-F and GNRT, OSG 10-K
DRIVING ROE
23. 23
Sources for all content: FRO, NAT, TNK, TNP 20-F and GNRT, OSG 10-K
PUBLIC COMPS
24. 24
PROJECTED REVENUES
Projected TCE Rates are slated to fall based on company
guidance and the expansion in industry capacity.
Projected fleet growth will more than offset the decline in
industry TCE rates in the near term
Sources for all content: FRO 20-F
25. 25
Projected TCE Rates Below Historical Industry Averages With projected TCE rates below historical in-
dustry averages, our projections leave room for
error
The standard deviation for clean tankers is less
than crude transporters —Frontline will have a
total of 22 LR2 clean tankers on the market by
2017. With lower standard deviations and less
fluctuation in TCE rates these ships will garner
more stable rates
Though we do predict lower rates in the near
term, we foresee rates returning to long term
historical averages over time
MARGIN OF SAFETY
26. 26
OUTLINE
FRONTLINE AT A GLANCE
INDUSTRY OVERVIEW
INVESTMENT DRIVERS
VALUATION & CONSIDERATIONS
APPENDIX
30. 30
GLOSSARY OF TERMS
Aframax tanker. Tanker ranging in size from 80,000 DWT to 120,000 DWT.
Baltic Clean Index. An index that tracks the market to ship refined products.
Baltic Dirty Index. An index that tracks the market to ship crude oil products.
Bunker Fuel. Fuel supplied to ships and aircraft in international transportation, irrespective of the flag of the carrier, consisting primarily of residual fuel oil for
ships and distillate and jet fuel oils for aircraft.
Charter. The hire of a vessel for a specified period of time or to carry a cargo from a loading port to a discharging port. A vessel is “chartered in” by an end user
and “chartered out” by the provider of the vessel.
DWT. Deadweight ton. A unit of a vessel’s capacity, for cargo, fuel oil, stores and crew, measured in metric tons of 1,000 kilograms. A vessel’s DWT or total
deadweight is the total weight the vessel can carry when loaded to a particular load line.
LR2. Acronym for Long Range 2 tankers ranging in size from 80,000 DWT to 160,000 DWT, a coated Afromax tanker
MR. Acronym for Medium Range tankers ranging in size from 25,000 DWT to 45,000 DWT.
Net voyage revenues. Voyage revenues minus voyage expenses.
Newbuilding. A new vessel under construction or just completed.
OECD. Organization for Economic Co-operation and Development: Australia, Austria, Belgium, Canada, Chile, the Czech Republic, Denmark, Estonia, Finland,
France, Germany, Greece, Hungary, Iceland, Ireland, Israel, Italy, Japan, Luxembourg, Mexico, the Netherlands, New Zealand, Norway, Poland, Portugal, Slo-
vakia, Slovenia, South Korea, Spain, Sweden, Switzerland, Turkey, the United Kingdom, and the United States.
OPEC. Organization of Petroleum Exporting Countries: Algeria, Angola, Ecuador, Gabon, Iran, Iraq, Kuwait, Libya, Nigeria, Qatar, Saudi Arabia, the United
Arab Emirates, Venezuela.
Panamax tanker. Tanker ranging in size from 60,000 DWT to 80,000 DWT.
Scrapping. The disposal of old vessel tonnage by way of sale as scrap metal.
Spot market. The market for immediate chartering of a vessel, usually on voyage charters.
Suezmax tanker. Tanker ranging in size from 120,000 DWT to 200,000 DWT.
Tanker. Vessel designed for the carriage of liquid cargoes in bulk with cargo space consisting of many tanks. Tankers carry a variety of products including crude
oil, refined products, liquid chemicals and liquid gas. Tankers load their cargo by gravity from the shore or by shore pumps and discharge using their own pumps.
TCE. Time charter equivalent. TCE is a measure of the average daily revenue performance of a vessel on a per voyage basis determined by dividing net voyage
revenue by total operating days for fleet.
VLCC. Acronym for Very Large Crude Carrier, or a tanker ranging in size from 200,000 DWT to 320,000 DWT.