Ensure the security of your HCL environment by applying the Zero Trust princi...
Stock Return Synchronicity and Technical Trading Rules
1. Stock Return Synchronicity and Technical Trading Rules
K.B. Kee* Qihui Chen
Singapore Management University Singapore Management University
School of Accountancy School of Economics
kbkee@smu.edu.sg qihui.chen.2009@smu.edu.sg
10 July 2010
ABSTRACT
We explore the potential source of returns from technical trading rules at the firm-level by
examining the cross-sectional relationship between technical trading returns and stock return
synchronicity. Inspired by Roll (1988) and Morck, Yeung and Yu (2000), we use R2 of a regression of
individual stock returns on the market return as our measure of synchronicity. If a low R2 is largely
attributable to noise trading, stocks will have lower synchronicity with market factors and lower R2.
Low R2 stocks earn higher expected returns, according to De Long, Shleifer, Summers, and
Waldmann (1989, 1990), or due to limits of arbitrage (Shleifer and Vishny, 1997), a predicted
relationship which we termed as the Noise Hypothesis. Overwhelming support in prior literature is in
favor of lower expected returns in low R2 stocks, or the Price-Informativeness Hypothesis according to
Morck, Yeung and Zarowin (2003). China is our context for investigation; it is the second most
synchronous market in the study by Morck et al (2000) which has grown to become the world’s third
largest stock market by market capitalization. We find evidence of a negative relationship between
returns from technical trading rules and R2 over 1991-2009, in favor of the Noise Hypothesis. Our
results remain robust after controlling for firm-specific characteristics which include market-to-book,
size, leverage, dividend payout ratio, turnover and firm age. Thus, an additional simple yet practical
statistics - the R2 - can guide trading decisions using technical trading rules. Do technical trading rules
work? Possibly only when the R2 is low, and for larger and younger stocks with lower turnover.
However, sub-period analysis reveal that when there is an improvement in the information
environment after the punctuation by an economically significant fundamental shock - the Non-
Tradable Share (NTS) reform in China in April 2005 - technical analysis work better post-NTS reform
during 2005-09 for stocks with higher R2, consistent with the Price-Informativeness Hypothesis, and
generally for older and bigger stocks with lower turnover and higher market-to-book ratio. Thus,
without the guide of R2, investors should take the market prognosis by all these “alchemists” with their
“voodoo” charts with a heavy dose of salt. We also reconciled the lively debate and extremely mixed
evidence on the interpretation of R2 and its relationship with the cross-sectional returns of stocks.
JEL classification: G11, G12, G14, G15, C1, O16, O53
Keywords: Stock return synchronicity, R2, idiosyncratic volatility, technical trading rules, price
informativeness, noise
*
We are grateful to Peter C. B. Phillips for his valuable suggestions and encouragement. All errors are ours.
# This paper is to be presented in the 2010 Global Development Finance Conference in Cape Town on Nov 24-26, 2010
Corresponding author: Singapore Management University, School of Accountancy, 60 Stamford Road, Level 4 Room 4019,
Singapore 178900, DID (65) 6828 1995, Fax (65) 6828 0600.
1
2. 1. INTRODUCTION AND MOTIVATION
Few departures in position in finance are as vexing as that of establishing consistent and
reliable returns predictability from past returns using technical trading rules and chart patterns across
markets and over time. While technical analysis, ridiculed as “alchemy” by Burton Malkiel in his
1973 book “A Random Walk Down Wall Street”, challenges the formidable market efficiency
orthodoxy (Fama, 1970), there is pervasive use by practitioners and the persistence of belief in
technical analysis techniques (see survey studies in Park and Irwin, 2007, and Menkhoff and Taylor,
2007). However, the intellectual vacuum at the core of technical analysis – that efficient markets
remove possible short-term patterns and autocorrelations in stock returns - has been increasingly filled
up in recent times by growing receptiveness that markets may not be fully efficient because of noise
trading (Kyle, 1985; Black, 1986), that herding behavior of short-horizon traders can result in
informational inefficiency (Froot, Scharfstein and Stein, 1992) and self-fulfilling tendencies (Frankel
and Froot, 1990), and that prices may be affected by behavioural biases (Barberis, Schleifer and
Vishny, 1998; Daniel, Kent, Hirshleifer and Subrahmanyam, 1998; Hirshleifer, 2001; Shiller, 2003).
Such peripheral views get reinforced the more difficult market conditions are, when techniques based
on profits and valuations failed (Talley, 2002), especially during the recent financial crisis (Avgouleas,
2009), and with the growing influence of quantitative hedge funds that employ the automation of
technical trading rules as one of their investment strategies (Lo and Hasanhodzic, 2009). Still, the
profitability of using technical trading rules based on past prices remains an open empirical question,
albeit an extensively examined one.
We tread a different path in our study by exploring the potential source of the returns of
technical trading rules at the firm-level, an issue that has not been commonly explored in prior studies.
We are motivated to examine this because of the parallel observation of a reported decline in technical
trading profitability in U.S. over time (Sullivan, Timmermann and White, 1999; LeBaron, 2000;
Kwon and Kish, 2002; Ready, 2002; Schulmeister, 2009), and a lower synchronicity of U.S. stock
prices, or higher idiosyncratic volatility of individual firms, over time as the U.S. economy developed
(Morck, Yeung and Yu, 2000, hereafter termed MYY).
The popular explanation for this profitability decline in deploying technical trading rules is
that markets have become more efficient and hence such opportunities have disappeared. This is
especially so with the advent of cheaper computing power to spark the proliferation of computer-
driven trading, the growth of electronic communication networks (ECNs) that allow thousands of buy
and sell orders to be matched at the speed of light without any human intervention1; the increasing
popularity of “dark pool” platform where buyers and sellers can anonymously match large blocks of
stock and keep details of the deals and prices concealed to prevent distorting prices in the broader
1
According to the New York Stock Exchange daily public disclosure, program trading accounts for about 20-25% and as
high as 80% of the trading volume on that exchange every day.
2
3. market; and the lower transaction costs; all of which are helping to remove possible short-term
patterns and autocorrelations in stock returns.
Similar to MYY, Campbell, Lettau, Malkiel and Xu (CLMX, 2001) also found a secular
decline in stock return synchronicity in the United States from 1960 to 1997, but they do not link it to
cross-sectional returns. This time-series observation suggests that there could be a cross-sectional
relationship between technical trading profitability and stock return synchronicity at the firm-level.
Thus, the source of the profitability (or losses) of technical trading rules could be due to varying
degrees of firm-level synchronicity with the market, a relationship that has not been explored in prior
literature.
We like to emphasize that our study is more concerned about investigating the source of the
returns from the technical trading rules by testing its association with stock return synchronicity,
rather than focusing on establishing the highly contentious point of whether the technical trading rules
are indeed profitable and robust to problems such as data-snooping biases (Sullivan, Timmerman and
White, 1999), since we acknowledge that these trading rules might perhaps not work for certain
stocks at the firm-level, and we want to know what are the predictors that determine the trading
profits or losses from applying these technical rules.
Inspired by Roll (1988), MYY is the first in a series of papers that uses the R2 of a regression
of individual stock returns on the market return as a measure of synchronicity, or the extent to which
the stock prices of individual firms within a country move together. R2 is also the ratio of
idiosyncratic volatility to systematic volatility; idiosyncratic volatility is thus the inverse measure of
synchronicity. In sum, lower R2, or higher idiosyncratic volatility of individual firms, indicates lower
synchronicity of stock returns. Roll (1988) offers an interesting discussion of R2, observing that the
low R2 statistics among U.S. stocks and for common asset pricing models is due to vigorous firm-
specific return variation not associated with identifiable news releases and public information. He
concludes that this implies “either private information or else occasional frenzy unrelated to concrete
information (noise)”. The incorporation of either firm-specific information or noise both result in a
lower R2, but these two effects lead to starkly different predictions of the relation between R2 and
expected stock returns:
(a) The Price-Informativeness Hypothesis: If a low R2 is largely resulted from the firm’s
environment causing the stock prices to aggregate more firm-specific information, greater
firm-specific uncertainty is resolved such that market factors should explain a smaller
proportion of the variation in stock returns, increasing the realized historical idiosyncratic
volatility, and investors holding these stocks should require lower expected returns.
(b) The Noise Hypothesis: If a low R2 is largely attributable to the trading by noise traders, stocks
will have lower synchronicity with market factors and lower R2 because the changes in stock
prices cannot be fully justified by changes in fundamental risks reflected in the common
3
4. factors, and investors should earn higher expected returns according to De Long, Shleifer,
Summers, and Waldmann (1989, 1990).
Both finance and accounting research had tilted overwhelmingly in favor of the Price-
Informativeness Hypothesis, in that R2 or stock return synchronicity is a measure for how much
private information is impounded into stock prices. When informed trading activity is generated, it
contributes to the lower R2 (or increase in idiosyncratic volatility). This is in the spirit of the
Grossman and Stiglitz (1980) argument who predict that improving the cost-benefit trade-off on
private information collection leads to more extensive informed trading and to more informative
pricing. In a market with many risky stocks, the ones with cheaper information about their
fundamental values are more attractive to traders. Accordingly, traders acquire more information
about these stocks and their prices are more volatile and more informative than the prices of stocks
with more costly information. Private information is turned into public information, thereby reducing
the adverse selection problem of uninformed investors trading with informed investors.
At the country-level, MYY (2000) find that stock prices are more synchronous (i.e. have
higher R2) in emerging markets which are low-income countries with weak protection of investors’
and property rights; weak institutions discourage the acquisition of information about individual
stocks and such markets lack informed traders because risk arbitrageurs find it more costly to keep
their profits in such economies. However, there are mixed results when the country-level findings are
examined at the firm-level. On one hand, Durnev, Morck, Yeung and Zarowin (2003) find evidence
that firm with lower R2 exhibit higher associations between current returns and future earnings,
suggesting that lower R2 is indicative of better informationally-efficient prices. Piotroski and
Roulstone (2004) find that both institutional and insider trading are positively associated with
idiosyncratic volatility. In other words, stocks with higher institutional trading and insider trading
have lower R2, since institutional trading accelerates the incorporation of firm-specific information
into stock prices, and consequently, lowers R2.
On the other hand, in a widely-cited paper, Ang, Hodrick, Xing, and Zhang (2006) report that
stocks with low R2 (or high idiosyncratic volatility) is associated with “abysmally low returns”. The
average differential between quintile value-weighted portfolios of the lowest and highest idiosyncratic
volatility is about -1.06 percent per month. Ang (2009) also confirm that the link also exists in 23
other developed markets. The Noise Hypothesis is originated by Shiller (1981) who finds that the
level of stock price volatility is too high to be explained by the volatility in the underlying
fundamentals, e.g. dividends. Other studies suggest that behavioural factors, bubbles, herding, and
other non-fundamental factors affect stock return volatility (see Shleifer (2000) for a review), and
ultimately the usefulness of the synchronicity measure as a gauge of firm-specific information.
Behavioural models, like Barberis and Huang (2001) predict that lower R2 stocks earn higher
expected returns. In environments with frictions and incomplete information (Merton, 1987) and
4
5. limits to arbitrage (Shleifer and Vishny, 1997), R2 (or the idiosyncratic volatility of a stock) is linked
to its expected return.
Thus, if there is a cross-sectional relationship between technical trading profitability and
stock return synchronicity, the direction is unclear due to the two competing hypotheses.
Still, the U.S. ranks as having the lowest synchronicity amongst the 40 countries in MYY
(2000) study and there might not be a great deal of cross-sectional variation in synchronicity at the
firm-level. China is the second most synchronous market in 1995 in MYY (2000) study, where over
80 percent of stocks often move in the same direction in a given average week. There are also several
important stylized facts about China that made it an economically important ground for investigation.
China’s GDP per capita was $455 in 1995 in the MYY (2000) study and has since surged more than
14-fold to $6,546 in 2009. While it is still an “emerging market” and “low-income country”, Shanghai
has the world’s third largest stock market by market capitalization at around $3 trillion in its $3.2
trillion economy, briefly overtaking Tokyo in July 2009. Shares worth $5.01 trillion changed hands on
the Shanghai Stock Exchange in 2009, compared with $4.07 trillion on the Tokyo Stock Exchange,
according to data compiled by Bloomberg. Only the NASDAQ stock market and the New York Stock
Exchange had higher trading volumes than Shanghai. As an emerging market, China has a very high
ratio of stocks changing hands. Wong (2006) reported that the turnover velocity of stocks, defined as
the total transaction volume divided by the total number of tradable shares, was about 500 percent,
suggesting the prevalence of noise trading in China. Moreover, some countries, including China, place
asymmetric restrictions on the price formation process, such as short-selling constraints, which
impede the impounding of bad news into prices in a timely manner and contribute to the high co-
movement of stock prices (Miller, 1977; Bris, Goetzmann and Zhu, 2003). Jin and Myers (2006) find
that such synchronous markets are more prone to crashes.
Using a comprehensive sample of China stocks since the inception of the Shanghai Exchange
in January 1991 to December 2009, we show that the returns from technical trading rules has a
negative association with stock return synchronicity, or the R2. Thus, we find evidence in favor of the
Noise Hypothesis in that stocks with lower R2 earn higher profits from technical trading rules.
Ranking the sample into 10 decile portfolios by R2, we find that the technical trading returns in N1
(lowest R2 portfolio) exceeds that in N10 (highest R2 portfolio) by an annualized 7-11 percent over the
sample period, depending on the type of technical trading rule that is employed. Our results remain
robust even after controlling for firm-specific characteristics which include market-to-book, size,
leverage, dividend payout ratio, turnover and firm age.
Thus, an additional simple yet practical statistics - the R2 - can guide trading decisions using
technical trading rules. Imagine that the Bloomberg terminal, Yahoo Finance and financial websites
should have an additional statistics – the synchronicity measure – to allow investors and traders to
assess how effective their technical analysis can be; for instance, if the informational environment is
5
6. generally noisy, then the technical traders should focus their efforts on less synchronous or low R2
stocks to increase their probability of generating abnormal profits.
Do technical trading rules work? Possibly only when the R2 is low, and for larger and
younger stocks with lower turnover. However, sub-period analysis reveal that when there is an
improvement in the information environment after the punctuation by an economically significant
fundamental shock - the Non-Tradable Share (NTS) reform in China in April 2005 - technical analysis
work better post-NTS reform during 2005-09 for stocks with higher R2, consistent with the Price-
Informativeness Hypothesis, and generally for older and bigger stocks with lower turnover and higher
market-to-book ratio. Thus, without the guide of R2, investors should take the market prognosis by all
these “alchemists” with their “voodoo” charts with a heavy dose of salt. We also reconciled the lively
debate and extremely mixed evidence on the interpretation of R2 and its relationship with the cross-
sectional returns of stocks.
The rest of the paper is organized as follows. Section 2 explores the literature review and
hypotheses development. Section 3 describes the data, variable description and construction, and
methodology. Section 4 presents the empirical results, while Section 5 examines the robustness of the
results in sub-periods. Section 6 concludes.
2. LITERATURE REVIEW AND HYPOTHESIS DEVELOPMENT
2.1 Technical Trading Rules
Two empirical papers were particularly important in supporting the predictive capabilities of
technical trading rules. Brock, Lakonishok and LeBaron (BLL, 1992) found significant technical
trading profits by utilizing 26 trading rules to a very long data series of the Dow Jones index daily
prices from 1897 to 1986. Lo, Mamaysky and Wang (2000) used a non-parametric kernel regression
pattern recognition method to automate the evaluation of technical analysis trading techniques over
the period from 1962 to 1996, and found strong evidence that there is incremental informational and
practical value in technical analysis, particularly in NASDAQ stocks.
BLL (1992) results remain robust even after correcting for the leptokurtic, conditionally
heteroskedastic, autocorrelated, and time-varying distribution in stock returns using the model-based
bootstrap technique to overcome the weaknesses of conventional t-tests. However, Sullivan,
Timmerman and White (STW, 1999) pointed out in that data-snooping biases can be severe when
evaluating technical rules, which can lead to the false conclusion that technical trading strategies can
predict future price movements. In particular, STW (1999) repeated BLL (1992) study by utilizing
White’s (2000) Reality Check bootstrap methodology to correct for data-snooping biases and find that
the trading rules examined do not generate superior out-of-sample performance. BLL acknowledged
that possible data snooping biases remain when they use a range of rules chosen ex post. They argue
that such dangers are minimized by the deliberate choice of a simple class of rules that has been in
common use for a long period of time. Interestingly, STW acknowledged that they found BLL in-
sample results to be robust to data-snooping over the 100-year period in BLL (1992).
6
7. However, our study is more concerned about investigating the source of the returns from the
technical trading rules by testing its association with stock return synchronicity, rather than focusing
on establishing the highly contentious point of whether the technical trading rules are indeed
profitable and robust to problems such as data-snooping biases (Sullivan, Timmerman and White,
1999), since we acknowledge that these trading rules might perhaps not work for certain stocks at the
firm-level, and we want to know what are the predictors that determine the trading profits or losses
from applying these technical rules.
There are surprisingly few papers that examine the value of technical analysis in China. Chen
and Li (2006) found weak evidence for technical trading profits over the period from 1994 to 2002,
but only for 39 companies which cover “23 percent of the daily turnover of the entire A-share market”.
There are some supporting evidence that technical analysis add value in emerging markets
(Bessembinder and Chan, 1995; Ito, 1999), but Ratner and Leal (1999) found the opposite results after
correcting for data-snooping bias and adjusting for round-trip transaction costs, while Chen, Huang
and Lai (2009) found there is a sharp decline in trading profits after implementing a one-day lag
scheme to account for non-synchronous trading bias in eight Asian markets. These studies exclude
China in their analysis.
Given the extraordinary growth in China to become the world’s third largest stock market in
recent years which were not in the sample period of most prior studies, it should be interesting to fill
the gap in the extant literature findings by examining the source of returns predictability from
deploying technical trading rules in a highly synchronous but fast-changing market like China.
2.2 R2 or Stock Return Synchronicity
The dominant interpretation of R2, or stock return synchronicity, is an important issue
because prior research suggests that more informative stock prices, measured by lower R2, lead to
better resource allocation, and therefore functional efficiency with efficient stock prices directing
capital to the highest-value users, which has implications for economic growth (Tobin, 1982; Wurgler,
2000; Durnev, Morck, and Yeung, 2004, Wang, Wu and Yang, 2009).
Since the influential studies by MYY (2000) and CLMX (2001) documenting the trend of
lower R2 over time, many proposed explanations have been instrumental in supporting the Price
Informativeness story, that is, low R2 is a reasonable measure for the quality of the information
environment at either the country-level or the firm-level.
In particular, at the country-level, MYY find that stock prices are more synchronous (i.e. have
higher R2) in emerging markets which are low-income countries with weak protection of investors’
and property rights; weak institutions discourage the acquisition of information about individual
stocks and such markets lack informed traders because risk arbitrageurs find it more costly to keep
their profits in such economies. At the firm-level, Durnev, Morck, Yeung and Zarowin (2003) find
evidence that firm with lower R2 exhibit higher associations between current returns and future
earnings, suggesting that lower R2 is indicative of better informationally-efficient prices. Piotroski and
7
8. Roulstone (2004) find that stocks with higher institutional trading and insider trading have lower R 2.
There is also evidence that Increased institutional ownership (Bennett, Sias, and Starks, 2003; Xu and
Malkiel, 2003) is associated with lower R2. The idea is that Institutional trading contributes to private
information collection and accelerates the incorporation of firm-specific information into stock prices
(Hartzell and Starks, 2003), and provides a better explanation for a lower R2. Hutton, Marcus and
Tehranian (2010) find that R2 decreases with information transparency. Ferreira and Laux (2007)
show that firms with better corporate governance (as measured by having fewer anti-takeover
provisions) display higher trading activity, better information about future earnings in stock prices,
and lower R2. Irvine and Pontiff (2009) found that lower R2 could be due to product markets
becoming more competitive.
In a widely-cited paper, Ang, Hodrick, Xing, and Zhang (2006) report that stocks with low R2
(or high idiosyncratic volatility) is associated with “abysmally low returns”. The average differential
between quintile value-weighted portfolios of the lowest and highest idiosyncratic volatility is about -
1.06 percent per month. Ang (2009) also confirm that the link also exists in 23 other developed
markets. Jiang, Xu and Yao (2009) find that firms with past low R2 (or high idiosyncratic volatility)
tend to have more negative future unexpected earnings surprises, leading to their low future returns.
There is overwhelming support for the Price Informativeness story of R2.
The Noise Hypothesis is originated by Shiller (1981) who finds that the level of stock price
volatility is too high to be explained by the volatility in the underlying fundamentals, e.g. dividends.
West (1988) provides a theoretical model in which low R2 is associated with less firm-specific
information and more noise in returns. In West’s model, relatively more information results in prices
being closer to fundamental values, and the release of new information results in smaller price
movements and lower R2. West empirically tests his model and reports results indicating that lower R2
is positively associated with bubbles, fad, and other non-fundamental factors. Recent evidence by
Brandt, Brav, Graham and Kumar (2010) show that the trend of lower R2 is a speculative episodic
event driven by low-priced stocks dominated by retail traders and that there is a reversal to higher R2
(or lower idiosyncratic firm volatility) during the 2000s, using small trades data from ISSM/TAQ and
brokerage data. Other direct or implicit opposing explanations of the Price Informativeness story view
include firm fundamentals become more volatile, such as an increase in the variance of return on
equity (Wei and Zhang 2006) or opaqueness in financial accounting information (Rajgopal and
Venkatachalam 2006); newly listed firms becoming increasingly younger (Fink et al. 2009) and
riskier (Brown and Kapadia 2007).
Rebutting the widely-cited claims by Ang et al (2006), Fu (2009) reports that expected
idiosyncratic volatility, estimated using the EGARCH model, is positively correlated with stock
returns. Duffee (1995) found a positive contemporaneous relation between realized monthly
idiosyncratic volatility and stock returns. Bali and Cakici (2008) show that the results in Ang et al
(2006) are sensitive to the methodology used to form volatility portfolios and to the data frequency
8
9. used to estimate idiosyncratic volatility, and that the negative relationship between idiosyncratic
volatility and expected returns disappears in the equal-weighted returns. Huang, Liu, Rhee and Zhang
(2010) point out that the results in Ang et al (2006) may be driven by monthly return reversals.
Other studies supporting the Noise Hypothesis suggest that behavioural factors, bubbles,
herding, and other non-fundamental factors affect stock return volatility (see Shleifer (2000) for a
review), and ultimately the usefulness of the synchronicity measure as a gauge of firm-specific
information. Behavioural models, like Barberis and Huang (2001) predict that lower R2 stocks earn
higher expected returns. In environments with frictions and incomplete information (Merton, 1987)
and limits to arbitrage (Shleifer and Vishny, 1997), R2 (or the idiosyncratic volatility of a stock) is
linked to its expected return. Merton (1987) suggests that, in the presence of incomplete markets
where investors have limited access to information, firm-specific risk cannot be fully diversified away,
and thus firms with low R2 require higher average returns to compensate investors for holding
imperfectly diversified portfolios. In the influential “limits of arbitrage” argument by Shleifer and
Vishny (1997), arbitrageurs tend to avoid stocks with low R2 (or high idiosyncratic volatility) during
the holding period, allowing these stocks to enjoy higher expected returns whose mispricing are not
arbitraged away. These arbitrageurs care more about the short-run performance, because they use
capital provided by investors, who tend to withdraw funds if the short-run performance is poor. Thus,
they desire to keep the ratio of reward-to-risk over shorter horizons high and are less willing to take
large positions in these stocks and thus the largest mispricing are found in these stocks which receive
the least arbitrage resources.
In addition, Barberis, Shleifer and Wurgler (2005) also find significant changes in firms’ R2
values surrounding additions and deletions to the S&P 500 Index in the U.S., consistent with market
frictions influencing synchronicity. Since additions and deletions to indices do not signal new
information to the market regarding firms’ fundamentals, the changes in firm’s R2 values surrounding
changes in the composition of indices is inconsistent with an information-based explanation of the R2
measure. Consistent with the noise-in-returns interpretation of the R2 measure, Kumar and Lee (2006)
find that noise traders (uninformed retail investors) have a significant influence on stock price
synchronicity. Thus, the findings of Barberis et al. (2005) and Kumar and Lee (2006) indicate that
market frictions, i.e., factors unrelated to information, have a significant influence on stock price
synchronicity. Other research supporting the Noise Hypothesis include Ali, Hwang and Trombley
(2003), Mashruwala, Rajgopal, and Shevlin (2006) and Zhang (2006).
2.3 Hypotheses
We posit that the source of the profitability (or losses) of technical trading rules could be due
to varying degrees of firm-level synchronicity with the market, a relationship that has not been
explored in prior literature. Yet, in the cross-sectional relationship between technical trading
profitability and stock return synchronicity, the direction is unclear due to the two competing
hypotheses, namely Price Informativeness Hypothesis and Noise Hypothesis. Given that China
9
10. appears to be a “noisy” market, we posit that there is a positive relationship in the regression of
technical trading returns on ψi, which is the inverse measure of R2 or lack of stock return
synchronicity (we will explain the rationale for transforming the variable in Section 3.2), that is, a
higher ψi or lack of stock return synchronicity (or lower R2) is associated with higher technical trading
returns. In other words, the coefficient on the synchronicity measure ψi is positively significant.
Our paper is similar in spirit to Teoh, Yang and Zhang (TYZ, 2009) and Chang and Luo
(2010) who find bigger anomalies among lower R2 stocks. The presence of anomalies indicates that
stock prices are inefficient with respect to information about future cashflows that are contained in the
predictive variables explored by TYZ (2009)2. Their findings suggest that stocks whose returns have
low R2 may incorporate less information about future fundamentals, and are more difficult for
investors to analyze accurately. Using a much larger sample size and different methodology compared
to Durnev et al (2003), TYZ (2009) also find that firms with lower R2 have smaller future earnings
response coefficients (ERCs), indicating that their current stock price incorporates a smaller amount
of future earnings news, and thus more uncertainty about future earnings news remains unresolved,
which is inconsistent with Durnev et al (2003). In addition, low R2 firms have worse information
environment as measured by earnings quality, earnings persistence, and earnings predictability, and
have higher probability of distress. These results imply that low R2 stocks incorporate less information
about future cashflows and thus inconsistent with the Price-Informativeness Hypothesis and more
consistent with the Noise Hypothesis.
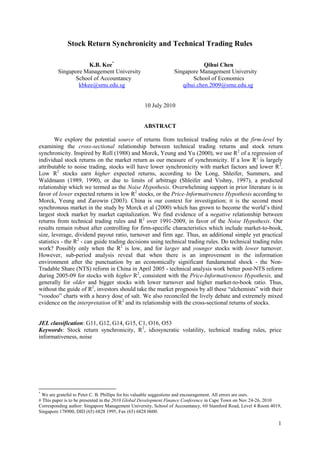
Figure 1: The declining synchronicity of China stock prices, or the declining fraction of China stock return variation
explained by the market as measured by R2, the statistic from running a market model regression using weekly returns
including dividend income from 1991 to 2009, using our sample size of 740 companies which represents around 90% of the
population of stocks on Shanghai Stock Exchange in terms of market capitalization. Returns and indexes data are from
Datastream. Note that the R2 in MYY (2000) for China in 1995 was 45.3% reported in their Panel C of Table 2 which is
consistent with MYY.
2
They are (1) the post-earnings announcement drift or PEAD (Ball and Brown, 1968; Bernard and Thomas, 1990); (2)
Value/Price or V/P (Lee, Myers and Swaminathan, 1998); (3) accruals (Sloan, 1996); and (4) net operating assets
(Hirshleifer, Teoh and Zhang, 2004).
10
11. Figure 1 graphs the average R2 across stocks, based on weekly returns from 1991 to 2009. We
observe an overall declining trend in R2. This brought us to the attention on whether there are any
time-series dynamics that could possibly affect the cross-sectional relationship between stock return
synchronicity and technical trading returns. We examine this issue further in Section 4.
We like to emphasize that we do not explore the time-series dynamics on why R2 is declining
over time; rather, we are more interested in what this time-series trend for our main predictor in the
synchronicity measure implies for the direction of the cross-sectional relationship between stock
return synchronicity and technical trading returns. Specifically, we want to find out whether or not
there is a structural break in the beta coefficient for the synchronicity measure ψi. If so, it will be
unclear whether the relationship of higher returns from lower R2 stocks still holds.
But what sub-period(s) should we investigate to assess whether our results are robust? To
avoid data-snooping biases (Lo and MacKinlay, 1990), we ask if there are any economically
significant fundamental shocks to the information environment faced by stocks in China over the
period. Indeed, there is the important Non-Tradable Share (NTS) reform that was announced in April
2005. Following the NTS reform in 2005, the market capitalization of Shanghai Stock Exchange grew
tremendously from around $380 billion to around $3 trillion at the end of 2009. Average R2 from Jan
1991 to April 2005 in the pre-NTS reform period was 37 percent as compared to 21 percent in the
post-NTS reform period from May 2005 to December 2009.
We hypothesize that the informational environment in China should improve in the post-NTS
reform period during May 2005-09 to the extent that R2 is now a measure that is more consistent with
the Price-Informativeness Hypothesis. In other words, the NTS reform will lead to greater
transparency for stocks and the cost-benefit trade-off on private information collection is improved,
leading to more extensive informed trading and more informative pricing, as in the spirit of Grossman
and Stiglitz (1980). Traders acquire more information about stocks and their prices are more volatile
(equivalently, lower R2) and more informative than the prices of stocks with more costly information.
Thus the positive coefficient on the synchronicity measure ψi for the overall period from 1991-2009
should flip to the negative sign during the post-NTS sub-period. As a result, we hypothesize that low
R2 stocks will now have lower returns from the technical trading rules (not higher as were under the
Noise Hypothesis) after the NTS reform where there is an economically significant fundamental shock
to the information environment.
3. DATA, VARIABLE DESCRIPTION AND CONSTRUCTION, AND RESEARCH
METHODOLOGY
We draw the data for our study from the Datastream database. Our initial sample includes all
847 firms traded on the Shanghai Composite Index since the inception of the Shanghai Stock
Exchange from 2 Jan 1991 to 31 December 2009. After removing firms with more than 100 days of
zero returns in any year in the construction of our returns from technical trading rules, requiring firms
to have a minimum of 40 weeks of non-zero returns to estimate our synchronicity measure ψi, and that
11
12. the sample to contain data for the control variables which include Market-to-Book, Size, Leverage,
Dividend Payout ratio, Turnover, and Firm Age, we are left with a final sample of 740 firms that
represent, on average, 90 percent of the initial population of stocks in terms of market capitalization.
3.1 Technical Trading Rules
Following BLL (1992), we evaluate three types of rules: Variable Length Moving Average
(VMA) rules, Fixed Length Moving Average (FMA) rules, and Trading Range Break (TRB) rules
(resistance and support levels). BLL (1992) provide additional description and motivation for these
trading rules, as well as some historical perspective on their usage:
(a) Variable Length Moving Average (VMA) and Fixed Moving Average (FMA): Moving average
trading models take advantage of positive serial correlation in equity returns. A trading signal
usually follows a large movement in stock price under the assumption that the autocorrelation
bias in the time series trend will continue in the same direction. The VMA rules analyzed are
as follows: 1± 1±
50, 150, 1±200, where the 1 represents the number of days in the short
moving average, and the 50, 150 and 200 represent the number of days in the long moving
average. Buy (sell) signals are emitted when the short-term average exceeds (is less than) the
long-term average by at least a pre-specified percentage band (0 percent or 1 percent). This
test is repeated daily with the changing moving averages throughout the sample. The buy
position is a long position in the stock and is maintained until a sell signal is indicated. With
the sell signal, the investor is out of the market. A rule is effective if the average buy minus
sell (buy-sell) signal is positive, significant, and greater than a buy and hold alternative after
trading costs. BLL (1992) evaluate each rule with a trading band of zero and one percent of
returns. A zero band classifies each return to emit either a buy or sell signal, while a band of
one would emit a buy or sell signal only when the short moving average crosses the trading
band. With a band of zero, this method classifies all days into either buys or sells. Buy (sell)
signals are emitted when the short moving average cuts the long moving average from below
(above) and moves beyond it by the pre-specified band. Once a signal is emitted, VMA rules
call for the position to be maintained until the short and long moving averages cross again,
while FMA rules hold the position for a fixed number of days. We evaluate FMA strategies
with fixed holding periods of ten days.
(b) Trading Range Break (TRB): TRB rules involve comparing the current price to the recent
minimum and maximum. TRB rules emit buy signals when the current price exceeds the
recent maximum by at least a pre-specified band, and emit sell signals when the current price
falls below the recent minimum by at least the pre-specified band. The rationale for this rule
is that when the current price reaches the previous peak, a great deal of selling pressure arises
because many people would like to sell at the peak. However, if the price exceeds the
previous peak, it is indicated that the upward trend has been initiated. Like BLL (1992), we
evaluate separate TRB rules where recent minimums and maximums are defined as the
12
13. extreme observations recorded over the prior 50, 150, and 200 days, respectively. We use
bands of 0 and 1 percent, making for a total of six TRB combinations, and then evaluate each
TRB rule using fixed investment horizons of 10 days.
3.2 Synchronicity Measure ψi
MYY (2000) is the first in a series of papers that uses the R2 of a regression of individual
stock returns on the market return as a measure of synchronicity, or the extent to which the stock
prices of individual firms within a country move together. R2 is also the ratio of idiosyncratic
volatility to systematic volatility; idiosyncratic volatility is thus the inverse measure of synchronicity.
Thus, lower R2, or higher idiosyncratic volatility of individual firms, indicates lower synchronicity of
stock returns. Following MYY (2000), we estimate firm-specific return variation using a two-factor
international model which includes both the local and U.S. market index returns:
rit = αi + β1rmt + β2rust + eit (1)
using weekly return data; where rit is the return of stock i in period t; rmt is the value-weighted local
market return; and rUSt is the value-weighted U.S. market return.
Like MYY (2000) and other international studies, we use weekly returns to deal with
infrequent trading in international markets. Following Dasgupta et al (2010), we compute the stock’s
lack of synchronicity as the ratio of idiosyncratic volatility to total volatility σ2ie=σ2i that is precisely 1-
R2i of Eq. (1). Given the bounded nature of R2; we conduct our tests using a logistic transformation of
1-R2i:
ψi = log(1-R2i) (2)
Thus, our predictor variable ψi measures idiosyncratic volatility relative to market-wide
variation, or the lack of synchronicity with the market. One reason for scaling idiosyncratic volatility
by the total variation in returns is that firms in some industries are more subject to economy-wide
shocks than others, and firm-specific events may be correspondingly more intense. Additionally, this
scaling and transformation allow for comparability to other studies. We do not add control variables
to our price regression in (1) because MYY (2000) view the R2 as a summary measure of the amount
of information reflected in returns.
3.3 Relationship between Stock Return Synchronicity and Returns from Technical Trading
Rules
We examine the relationship between technical trading returns and stock return synchronicity
2
R by estimating the following basic model:
TTRi = α + β ψi + γ Firm Controlsi + εi (3)
where TTRi is Technical Trading Returns calculated using the methodology by BLL (1992) discussed
in section 2.1; the synchronicity measure ψi is estimated from a market model that was discussed in
section 2.2; Firm Controls include those commonly used in the literature, namely, Size (defined as the
logarithmic of market value); Leverage (net debt over book equity); Dividend Payout ratio (dividend
over net profits); Turnover (annual volume over number of shares outstanding); Firm Age (the
13
14. number of years the company first appears on the Shanghai Exchange). We control for turnover as
volume may provide relevant information if prices do not react immediately to new information
(Blume, Easley and O’Hara, 1994).
The Price-Informativeness Hypothesis supports the view that expected returns from the
predictor variable would be low; thus, the beta coefficient on the synchronicity measure ψi will be
negative, that is, a higher ψi (lower R2) is associated with lower returns from the technical trading
rules. On the other hand, a positive beta coefficient on ψi is consistent with the Noise Hypothesis, that
is, a lower R2 is associated with higher returns.
4. EMPIRICAL RESULTS
4.1 Summary Statistics of Sample Characteristics and Returns from Technical Trading
Rules
The summary statistics of R2, other sample characteristics and the average return from the
three technical trading rules are reported in Panel A of Table 1. The average R2 is 25 percent, which is
a significant decline from the 45 percent reported in MYY (2000). Panel B of Table 1 reports the
cross-sectional average of the correlation among the sample characteristics; most of the sample
characteristics do not appear to be highly correlated with our main synchronicity predictor ψi.
The average annualized mean buy returns from the three technical trading rules are reported
in Panel C of Table 1. Because China does not allow for short-selling of stocks, we report only the
mean buy returns generated from the buy signal in the technical trading rules. They range from 22-42
percent (22-24 percent for VMA, 17-24 percent for FMA, and 22-47 percent for TRB), which is
significantly higher than the unconditional annualized average return of 8 percent, and also higher
than the 12 percent reported by BLL (1992) for U.S. Dow Jones index.
Table 1: Summary Statistics
Panel A presents the summary statistics of the sample characteristics. The construction details are described in Section 2.
Panel B reports the cross-sectional average of the correlation among the sample characteristics. Results in Panel C are for
daily data from January 1991 to December 2009 where mean buy returns using technical trading rules are annualized. Rules
are identified as (short, long, band) where short and long are the short and long moving averages respectively, and band is
the percentage difference that is needed to generate a signal. Because China does not allow for short-selling of stocks, we
report only the mean buy returns generated from the buy signal in the technical trading rules. Note that the unconditional
annualized average return is 8%.
Panel A: Summary Statistics
14
15. Panel B: Pearson Correlations
Panel C: Results for the Technical Trading Rules (VMA, FMA and TRB)
4.2 Properties of R2 Deciles and Univariate Analysis
From Table 2, we find that low R2 stocks are generally smaller, younger, have a lower
dividend payout ratio, and a higher leverage ratio. According to Baker and Wurgler (2006), such
stocks are more difficult to value and their prices tend to be affected by investor sentiment, and they
are more difficult to arbitrage, which could potentially result in these stocks having higher expected
returns to compensate investors as argued earlier in the “limits of arbitrage” insight proposed by
Shleifer and Vishny (1997) and consistent with the Noise Hypothesis. Interestingly, there is not any
significant difference between the lowest decile R2 stocks and the highest ones in the market-to-book
ratio. Also, high R2 stocks have a higher turnover ratio.
In addition, returns from technical trading rules have a negative association with stock return
synchronicity, or the R2. Thus, we find evidence in favor of the Noise Hypothesis in that stocks with
lower R2 earn higher profits from technical trading rules. Sorting the sample by R2 into deciles of 10
portfolios, we find that the technical trading returns in N1 (lowest R2 portfolio) exceeds that in N10
(highest R2 portfolio) by an annualized 10-37 percent over the sample period, depending on the type
of technical trading rule that is employed. In particular, the spread differential between the highest and
lowest R2 portfolios is the highest for the TRB technical trading rule.
In the next section, we carry out a multivariate regression analysis of equation (3) outlined in
Section 2.3 to control for the firm-level characteristics (market-to-book, size, leverage, dividend
15
16. payout ratio, turnover, and firm age) in order to ensure that our findings of the negative relationship
between technical trading returns and stock return synchronicity are robust.
Table 2: Characteristics of R2 Portfolios
Stocks are sorted into deciles of 10 portfolios based on the level of their average R2 over the sample period from low (L) to
high (H).
4.3 Multivariate Regression
The multivariate analysis of the regression model from Section 2.3 to investigate the
relationship between technical trading returns and synchronicity is presented in Table 3. The
coefficient on the synchronicity measure ψi remains positive and significant after controlling for a
battery of firm-level characteristics that include Market-to-Book, Size, Turnover, Leverage, Dividend
Payout and Firm Age across all three technical trading rules. Thus, the findings are consistent with the
Noise Hypothesis in that stocks with higher ψi (lower R2) have higher technical trading returns.
In addition, we find that the coefficients on the fundamental-based factors i.e. Market-to-Book,
Leverage and Dividend Payout, are insignificant across all three technical trading rules. This is an
appealing and intuitive result in that we should not expect any relationship between these fundamental
factors and technical trading returns since technical trading rules rely on non-fundamental trading
signals.
Finally, we find that Firm Age and Turnover are significantly negatively related to technical
trading returns, whereas Firm Size is significantly positively associated with technical trading returns,
across all three technical trading rules. Thus, larger and younger stocks with lower turnover have
higher technical trading returns. If turnover is a proxy for liquidity as suggested by existing literature,
the result is consistent since investors may demand a liquidity premium for low liquidity stocks which
are more costly to trade. Dasgupta et al (2010) find that younger firms tend to have significantly lower
R2 than do older firms, since the new information content (surprise) is larger for younger firms
(Dubinsky and Johaness, 2006) and that would drive higher firm-specific return variation. Thus, their
results suggest that younger firms have higher returns according to the Noise Hypothesis. However,
the findings that larger stocks have higher technical trading returns is a counter-intuitive and
important result because of the well-known “size effect” documented by Black (1976) and Banz
(1981) in that smaller firms have higher risk-adjusted returns, on average, than larger firms. Marshall,
16
17. Qian and Young (2009) also found that technical analysis is more profitable for smaller stocks, albeit
in U.S. over 1990-2004. We leave this interesting puzzle for future research.
Table 3: Relationship between Technical Trading Returns and Synchronicity (1992-2009)
This table reports the relationship between technical trading returns and synchronicity in the following model:
TTRi = α + β ψi + γ Firm Controlsi + εi
where the dependent variable TTRi is Technical Trading Returns calculated using the methodology by BLL (1992) discussed
in section 2.1; the synchronicity measure ψi is estimated from a market model that was discussed in section 2.2; Firm
Controls include those commonly used in the literature, namely, Size (defined as the logarithmic of market value); Leverage
(net debt over book equity); Dividend Payout ratio (dividend over net profits); Turnover (annual volume over number of
shares outstanding); Firm Age (the number of years the company first appears on the Shanghai Exchange). Panel A, B, and C
regress technical trading returns from applying the VMA, FMA and TRB rule on the synchronicity measure and firm
controls respectively. Model (1) regresses technical trading returns on only the synchronicity measure ψi. Model (2) includes
the additional control variables Market-to-Book and Size. Model (3) includes the rest of the control variables, namely
Turnover, Leverage, Dividend Payout and Firm Age. The numbers in parentheses are t-ratios based on Newey-West standard
errors.
Panel A: VMA (1, 150, 0) Panel B: FMA (1, 150, 0, 10) Panel C: TRB (150, 0, 10)
5. SUB-PERIOD ANALYSIS AND THE NON-TRADABLE SHARE (NTS) REFORM IN
2005
Following the Non-Tradable Share (NTS) reform that was announced in April 2005, the
market capitalization of Shanghai Stock Exchange grew tremendously from around $380 billion to
around $3 trillion at the end of 2009. Average R2 from Jan 1991 to April 2005 in the pre-NTS reform
period was 37 percent as compared to 21 percent in the post-NTS reform period from May 2005 to
December 2009.
We hypothesize that the informational environment in China should improve in the post-NTS
reform period during May 2005-09 to the extent that R2 is now a measure that is more consistent with
the Price-Informativeness Hypothesis. In other words, the NTS reform will lead to greater
transparency for stocks and the cost-benefit trade-off on private information collection is improved,
leading to more extensive informed trading and more informative pricing, as in the spirit of Grossman
and Stiglitz (1980). Traders acquire more information about stocks and their prices are more volatile
(equivalently, lower R2) and more informative than the prices of stocks with more costly information.
Thus the positive coefficient on the synchronicity measure ψi for the overall period from 1991-2009
should flip to the negative sign during the post-NTS sub-period. As a result, we hypothesize that low
17
18. R2 stocks will now have lower returns from the technical trading rules (not higher as were under the
Noise Hypothesis) after the NTS reform where there is an economically significant fundamental shock
to the information environment.
Section 5.1 covers some institutional background information on the NTS reform. Section 5.2
outlines the Chow Test to detect the presence of a structural break in beta coefficient for the
synchronicity measure ψi. Section 5.3 details the empirical results of the relationship between
technical trading returns and synchronicity in the two sub-periods, that is, pre-and post-NTS reform
(1992-04/2005 and 5/2005-2009), and a discussion on the implications of the findings.
5.1 Institutional Background on the Non-Tradable Share (NTS) Reform
The Shanghai and Shenzhen Stock Exchanges were established in December 1990 and July
1991 respectively. Non-tradable shares (NTS) prior to the 2005 reform composed of legal-person
shares and state shares are held by SOEs or government agencies. Legal-person shares were
transferable between domestic institutions upon the approval of CSRC. Tradable shares composed of
A-shares (denominated in local currency) and B-shares (denominated in foreign currencies and
reserved for foreign investors, and H-shares3. The non-tradable portion was as high as 72 percent in
1993, and well over 60 percent prior to the NTS reform in 2005. According to the data from Chinese
Security Regulatory Committee (CSRC), institutional investors held 28.89 percent of the value of
tradable shares at the end of 2007, an increase by almost 25 percent compared to 2001. Before the
NTS reform in 2005, the ownership structure in Chinese firms was concentrated, representing a partial
transition from an economy in which most enterprises were owned by the state. At least 80 percent of
the listed firms were created from the existing state-owned enterprises (SOEs) through carve-outs, in
which the original business group remains as the parent firm, as well as the controlling shareholder.
The largest shareholder controls more than 40 percent of the total shares in around 80 percent of listed
firms, while the second largest shareholder typically owns less than 10 percent.
The conflicting incentives of controlling and minority shareholders caused by this split-share
ownership structure can lead to significant inefficiencies inside the firm (Shleifer and Vishny, 1986,
1993; Rajan and Zingales, 2003). It has been argued that prior to the NTS reform, managers focused
too much on book value, since any trades of state shares or legal shares approved by the CSRC took
place at book value (Allen et al, 2007). Aharony, Lee and Wong (2000) documented that Chinese
SOEs engage in financial packaging for public listing. Allen et al (2005) showed that China’s formal
sector (consisting of state-controlled firms) underperforms the “informal sector” of non-state-owned
firms. Ball, Kothari and Robin (2000) provide evidence that accounting income in China lacks timely
incorporation of economic loss because of political influence on financial reporting practices.
3
While the two share classes of A and B shares issued by the same firm are identical in terms of shareholder rights (e.g.,
voting and dividend), B shares were traded at a significant discount relative to A shares and are traded less frequently than A
shares. The “B share discount” has been reduced significantly since the CSRC allowed Chinese citizens to trade B shares
(with foreign currency accounts) in 2001. In addition, Class H shares, issued by selected “Red Chip” Chinese companies, are
listed and traded on the HKSE.
18
19. Piotroski, Wong and Zhang (2009) find that state-controlled firms suppress negative financial
information around visible political events. Since the blockholders could not sell their shares, they
were inclined to expropriate wealth from minority shareholders (LaPorta et al, 2002; Wei, Xie and
Zhang, 2005; Cao, Dybvig and Qiu, 2007; Cheung et al, 2009; Chen, Jian and Xu, 2009). There is
also evidence of significant cash transfer or tunnelling of resources via related lending from listed
firms back to controlling owners after related-party transactions (Jian and Wong, 2008). State
shareholders are also less inclined to discipline their CEOs (Chang and Wong, 2009).
On 31 January 2004, the state council called for comments on how to promote the share-
trading reforms. This showed the Chinese government’s determination to change the structure of the
stock market4. On 29 April 2005, under the permission of state council, the CSRC issued “Notice on
the Pilot Reform of the Share-Trading Business of Listed Companies”. Under the new plan, the
remaining state shares among listed firms are converted to “G” shares and are tradable5. Four listed
firms were in the pilot scheme that started the NTS reform process6. On 4 September 2005, CSRC
issued Administrative Measures on Non-tradable Share Reform in Listed Companies and the reform
had gone into real implementation from the pilot stage. By November 2006, 1,200 firms accounting
for 96 percent of listed companies had completed the restructuring. By the end of 2007, there were
only a few companies that have not reached an agreement with their shareholders on the terms of the
reform.
During the reform, many new regulatory policies were launched, such as new accounting
standards which aimed to improve transparency and to protect the interest of minority shareholders7.
5.2 Structural Break Analysis
In the last section, we find that model (3) has the highest adjusted R2 for all three technical
trading rules. We select model (3) to carry out our Chow Test to examine whether the coefficient on
synchronicity is different in the two sub-periods, that is, pre-and post-NTS reform (1992-04/2005 and
4
From the latter half of 1998 to the first half of 1999, the Chinese government began an explorative trial to decrease state
shares (known as Guoyougu Jianchi). The trial was stopped soon because of the big gap between expectation and market
reactions. On 12 June 2001, the State Council of China issued Provisional Measures on Reducing State Shares and Raising
Social Security Funds. On July 24, 2001, the government announced that it would sell some fraction of its remaining shares
to ordinary investors, suddenly giving credibility and clarity to an ambiguously worded prior statement on future
privatization (Calomiris et al, 2008). Again, considering the poor market reaction, the regulation was suspended on 22
October 2001 and cancelled on 23 June 2002.
5
The CSRC outlines the format for compensating existing shareholders and also imposes lockups and restrictions on the
amount of G shares that can be sold immediately after they become tradable. More specifically, the new plan stipulates that
G shares are not to be traded or transferred within 12 months after the implementation of the share structure reform.
Shareholders owning more than 5% of the original non-tradable shares can only trade less than 5% of the total shares
outstanding within one year and less than 10% within 2 years. These restrictions of G share sales are intended to reduce the
downward pressure on the stock price, maintain market stability and protect the interests of public investors. The details of
the “fully floating plan” for a firm, including the number of G shares to be granted to each Class A shareholder and the time
window (e.g., one to three years) of G shares become fully floating, must be approved by two thirds of Class A shareholders
of the firm.
6
The first batch of the four pilot companies is Tsinghua Tongfang, Hebei Jinniu Energy Resources, Shanghai Zijiang
Enterprises Group and Sany Heavy Industry.
7
Other complementary policy measures must be undertaken before outside investors are willing to devote costly resources to
the production of information. Ball (2001) argued that simply transporting rules from one economic environment to another
can be unfruitful. Overall improvement in price informativeness is concentrated in countries with a strong macro
infrastructure in terms of the efficiency of the judicial system, investor protection, and financial reporting.
19
20. 5/2005-2009). We implement the three different trading rules (VMA (150,1,0), FMA (150,1,0,10),
TRB (150,0,10)) in the two sub-periods to obtain the returns for our sample of stocks. The
synchronicity measure ψi and the firm control factors for each sub-period are calculated using the
same approach as outlined in the previous sections. Thus, we have:
TTR1i = α1 + β1 ψ1i + γ1 Firm Control1i + ε1 where i, i = 1, 2, . . . , n1
TTR2i = α2 + β2 ψ2i + γ2 Firm Control2i + ε2 where i, i = 1, 2, . . . , n2
and the corresponding null hypotheses:
H10 : α1 = α2, β1 = β2, γ1 = γ2.
H20 : β1 = β2.
Table 4: Probability Values for Tests of H01 and H02
The probability values for these tests are given in Table 4 and we reject the null hypotheses
that the coefficient on the synchronicity measure ψi is equal. Thus, there exists a structural break pre-
and post-NTS reform (i.e. before and after 5/2005).
5.3 Empirical Results of the Relationship between Technical Trading Returns and
Synchronicity Pre- and Post NTS Reform8
The average annualized mean buy returns from the three technical trading rules in the two
sub-periods are reported in Table 5. The technical trading returns are negative during the pre-NTS
reform sub-period, ranging from -4 to -33 percent depending on the technical rules applied, compared
to the unconditional annualized average return of -15 percent. Post-NTS reform, the technical trading
returns are hugely positive, ranging from 35 to 65 percent depending on the technical rules applied,
which is better than the unconditional annualized average return of 25 percent.
Table 6 show the important result that the sign of the coefficient in the synchronicity measure
ψi for the VMA and FMA technical rule flips from positive during the pre-NTS reform period and to
negative during the post-NTS reform period as hypothesized. While the sign for the TRB rule remains
positive, it has now become insignificant. In other words, lower R2 stocks will now have lower returns
from the technical trading rules (not higher as were under the Noise Hypothesis) after the NTS reform.
When there is an economically significant fundamental shock to the information environment as was
the case for the NTS reform, R2 is now a proxy measure for informative prices and a measure that is
more consistent with the Price-Informativeness Hypothesis.
8
The results are robust when the real policy implementation announcement on 4 September 2005 is used as the break date,
rather than the 9 April 2005 pilot scheme announcement.
20
21. Table 5: Results for the Technical Trading Rules (VMA, FMA and TRB) Pre- and Post-NTS
Reform
Results in Table 5 are for daily data for the two sub-periods: pre-NTS reform from 4/1992-2005 and post-NTS reform from
5.2005-2009. Rules are identified as (short, long, band) where short and long are the short and long moving averages
respectively, and band is the percentage difference that is needed to generate a signal. Because China does not allow for
short-selling of stocks, we report only the mean buy returns generated from the buy signal in the technical trading rules. Note
that the unconditional annualized average return is -15% pre-NTS reform and 25% post-NTS reform.
Table 6: Technical Trading Returns and Synchronicity Pre- and Post-NTS Reform
This table reports the relationship between technical trading returns and synchronicity in the following model:
TTRi = α + β ψi + γ Firm Controlsi + εi
where the dependent variable TTRi is Technical Trading Returns calculated using the methodology by BLL (1992) discussed
in section 2.1; the synchronicity measure ψi is estimated from a market model that was discussed in section 2.2; Firm
Controls include those commonly used in the literature, namely, Size (defined as the logarithmic of market value); Leverage
(net debt over book equity); Dividend Payout ratio (dividend over net profits); Turnover (annual volume over number of
shares outstanding); Firm Age (the number of years the company first appears on the Shanghai Exchange). Panel A and B
presents the results from the regression of technical trading returns from applying the VMA, FMA and TRB rule on the
synchronicity measure and firm controls for the two sub-periods 1/1992-4/2005 and 5/2005-12/2009 respectively. The
numbers in parentheses are t-ratios based on Newey-West standard errors.
Panel A: Pre-NTS Reform Sub-Period 1/1992-4/2005 Panel B: Post-NTS Reform Sub-period 5/2005-12/2009
21
22. The implications for these findings are important since it reconciles the lively debate and
extremely mixed evidence on the interpretation of the synchronicity measure. Does low R2 stand for
informed trading leading to more informative prices under the Price-Informativeness Hypothesis, or
does it imply noisy trading, limits of arbitrage or/and incomplete market under the Noise Hypothesis?
As emphasized, these two competing hypotheses have starkly different relationship with expected
returns, that is, both informed and noisy trading lead to low R2, but the former is related to lower
expected returns, while the latter indicate higher expected returns.
Thus, technical trading rules work better for low R2 stocks when the information environment
does not experience any economically significant fundamental shock, such as the case for China
during the sub-period from 1991 till April 2005 before the NTS reform, which is consistent with the
Noise Hypothesis. However, an economically significant fundamental shock to the information
environment will lead to the synchronicity measure to become a proxy for informative pricing, as was
the case for China post-NTS reform from May 2005 till December 2009, resulting in lower technical
trading returns to low R2 stocks, consistent with the Price-Informativeness Hypothesis.
After an economically significant fundamental shock to the information environment, higher
technical trading returns come from stocks with higher R2 for the VMA and FMA technical rules, and
generally for older (not younger) and bigger stocks with lower turnover. In addition, we observe that
the coefficient on the fundamental factor Market-to-Book is now significantly positive. If MTB is a
proxy for “growth” stocks (Lakonishok, Shleifer, and Vishny, 1994), the result indicates that these
companies have higher technical trading returns. When MTB is a proxy for distress (Fama and French,
1993, 1995) and profitability9 (Daniel and Titman, 2006; Ecker, Francis, Olsson and Schipper, 2009),
the result suggests that less distressed and less profitable stocks have higher technical trading returns.
To sum up, the relationship between stock return synchronicity and technical trading returns
is negative over the period 1991-2009, that is, low R2 stocks have higher technical trading returns,
consistent with the Noise Hypothesis. Post-NTS reform, during the period from May 2005-2009,
stock return synchronicity and technical trading returns are positively related, that is, low R2 stocks
have lower technical trading returns, consistent with the Price-Informativeness Hypothesis. We do not
find this result to be conflicting. After all, we have only around four years of informed trading post-
NTS reform during May 2005 to December 2009 as compared to around fourteen years of noise
trading pre-NTS reform during January 1991 to April 2005, and the overall sample period from 1991-
2009 is therefore dominated by noise trading, and hence the overall significantly negative relationship
between stock return synchronicity and technical trading returns can be justified. As the information
environment in China improves going forward in the next few decades, we can expect that the
interpretation of R2 to be more consistent with the Price-Informativeness Hypothesis.
9
Daniel and Titman (2006) dispute Fama and French’s (1995) analysis of the book-to-market ratio as an indicator of distress,
and perform their own analysis of this ratio as an indicator of valuation-relevant information that is not contained in past
accounting-based performance measures
22
23. Interestingly, the results suggest that fundamental analysis could play a bigger role in the
gathering of relevant firm-specific information for decision-making in investing in developing
transitional economies determined in establishing the institutional structures and complementary
changes in country infrastructure to create incentives for higher quality informational environment
and good governance to protect investors’ rights.
A higher quality informational environment is important because the risk generated by noise
trading can reduce the capital stock and consumption of the economy (De Long et al, 1989), and also
forces managers to focus on the short term, and to bias the choice of investments against long-term
projects. Shleifer and Summers (1990) argued that even if investors earn higher average returns from
noise trading, it is because they bear more risk than they think. And even if they get rich over time, it
is only because they underestimate the risk and get lucky.
There are policy implications in noise trading. Shleifer and Summers (1990) gave the analogy
that making it costly for noise traders to bet on the stock market to protect them from their own utility
losses is in principle identical to the case for prohibiting casinos, horse races, and state lotteries. In
addition, noise trading benefit arbitrageurs who take advantage of noise traders. For instance, when
noise traders are optimistic about particular securities, it pays arbitrageurs to create more of them.
These securities might be mutual funds, new share issues, penny oil stocks, or junk bonds: anything
that is overpriced at the moment. Just as entrepreneurs spend resources to build casinos to take
advantage of gamblers, arbitrageurs build investment banks and brokerage firms to predict and feed
noise trader demand. This suggests that regulatory actions could be needed when noise trading is
prevalent to regulate the activities of these arbitrageurs taking advantage of the noise traders, as
evident from the recent 2008 Financial Crisis with noise traders chasing subprime mortgage assets
created by the financial institutions.
Thus, our results appear to suggest that the relationship between technical trading returns and
R2 can also help regulators to assess whether the informational environment is “noisy” or
“informative”, and make their policy recommendations and regulatory actions accordingly.
6. SUMMARY AND CONCLUSION
We acknowledge that technical trading rules might perhaps not work for certain stocks at the
firm-level, and we want to know about the source behind the trading profits or losses from applying
these technical rules. We believe that we are the first to empirically establish the link between
technical trading returns and stock return synchronicity. An additional and a very simple yet practical
statistics - the R2 - can guide trading decisions using technical trading rules 10 . Imagine that the
Bloomberg terminal, Yahoo Finance and financial websites should have an additional statistics – the
synchronicity measure – to allow investors and traders to assess how effective their technical analysis
can be; for instance, if the informational environment is generally noisy, then the technical traders
10
Volatility is well-known to be persistent (Engle, 1982) and past idiosyncratic volatility, or R 2, should still have predictive
power when longer sample periods are used to compute R2.
23
24. should focus their efforts on less synchronous or low R2 stocks to increase their probability of
generating abnormal profits.
Do technical trading rules work? Possibly only when the R2 is low, and for larger and
younger stocks with lower turnover, consistent with the Noise Hypothesis. However, sub-period
analysis reveal that when there is an improvement in the information environment after the
punctuation by an economically significant fundamental shock - the NTS reform in China announced
in April 2005 - higher technical trading returns post NTS-reform in 2005-2009 come from stocks with
higher R2 for the VMA and FMA technical rules, consistent with the Price-Informativeness
Hypothesis, and generally for older (not younger) and bigger stocks with lower turnover and higher
market-to-book (MTB). Thus, without the guide of R2, investors should take the market prognosis by
all these “alchemists” with their “voodoo” charts with a heavy dose of salt11. We thus reconcile the
lively debate and extremely mixed evidence on the interpretation of R2 and its relationship with the
cross-sectional returns of stocks.
An economically significant fundamental shock to the information environment also lead to
the significance of the Market-to-Book (MTB) ratio, suggesting that growth, distress and profitability
(fundamental factors which MTB ratio proxies for) are important determinants to technical trading
returns. Thus, fundamental analysis could play a bigger role in the gathering of relevant firm-specific
information for decision-making in investing in developing transitional economies determined in
establishing the institutional structures and complementary changes in country infrastructure to create
incentives for higher quality informational environment and good governance to protect investors’
rights.
Our results also appear to suggest that the relationship between technical trading returns and
R can also help regulators to assess whether the informational environment is “noisy” or
2
“informative”, and make their policy recommendations and regulatory actions accordingly. For
instance, when the informational environment is noisy, regulatory actions could be needed to regulate
the activities of arbitrageurs taking advantage of the noise traders to protect them from their own
utility losses, as evident from the recent 2008 Financial Crisis with noise traders chasing subprime
mortgage assets created by the financial institutions.
A cross-country study adapting our research methodology will likely be helpful to assess the
relative usefulness and interpretation of R2.
Using a Bayesian framework, Treynor and Ferguson (1985) suggest that past prices, when
combined with other valuable information, can be helpful in achieving unusual profit. He concludes
that: “It is the non-price information that creates the opportunity. The past prices serve only to permit
its efficient exploitation.” A natural important extension would be to examine the use of fundamental
analysis in conjunction with technical analysis, which we leave for future research.
11
The idea of scaling investment signals by the past idiosyncratic volatility of the stock is conveyed in a well-known book to
practitioners, “Active Portfolio Management” (Grinold and Kahn 1999). Jacobs and Levy (1996) provide similar advice.
24
25. References
Aharony, Lee and Wong (2000), Financial Packaging of IPO Firms in China, Journal of Accounting
Research 38(1): 103-126
Ali, Hwang and Trombley (2003), Arbitrage Risk and the Book-to-Market Anomaly, Journal of Financial
Economics 69: 355-373
Allen, Franklin, Qian, J., and Qian M. (2005), Law, Finance, and Economic Growth in China, Journal of
Financial Economics 77: 57-116
Allen, Franklin, Qian, J., Qian M., Zhao, M. (2008), A Review of China’s Financial System and Initiatives
for the Future, working paper
Allen, Franklin, Qian, J., and Qian M. (2007), China’s Financial System: Past, Present and Future,
“China’s Great Economic Transformation,” edited by T. Rawski and L. Brandt, and published by the
Cambridge University Press
Ang, Hodrick, Xing and Zhang (2006), The Cross Section of Volatility and Expected Returns, Journal of
Finance 61(1): 259-299
Ang, Hodrick, Xing and Zhang (2009), High Idiosyncratic Volatility and Low Returns: International and
Further U.S. Evidence, Journal of Financial Economics 91: 1-23
Avgouleas (2009), The Global Financial Crisis, Behavioral Finance and Financial Regulation: In Search of
a New Orthodoxy, Journal of Corporate Law Studies (April):23-59
Baker and Wurgler (2006), Investor Sentiment and the Cross-Section of Stock Returns, Journal of Finance
61: 1645-1680
Bali and Cakici (2008), Idiosyncratic Volatility and the Cross Section of Expected Returns, Journal of
Financial and Quantitative Analysis 43(1): 29-58
Ball, Kothari and Robin (2000), The effect of international institutional factors on properties of accounting
earnings, Journal of Accounting & Economics 29(1): 1-51
Ball (2001), Infrastructure Requirements for an Economically Efficient System of Public Financial
Reporting and Disclosure, Brookings Papers on Financial Services: 127–169
Banz (1981), The Relation between Return and Market Value of Common Stocks, Journal of Financial
Economics 9: 3–18
Barberis, Shleifer and Vishny (1998), A Model of Investor Sentiment, Journal of Financial Economics 49:
307-343
Barberis and Huang (2001), Mental Accounting, Loss-Aversion, and Individual Stock Returns, Journal of
Finance 56: 1247-1292
Barberis, Shleifer and Wurgler (2005), Comovement, Journal of Financial Economics 75: 283-317
Bennett, Sias, and Starks (2003), Greener Pastures and the Impact of Dynamic Institutional Preferences,
Review of Financial Studies 16: 1203–38
Bernard and Thomas (1990), Evidence that Stock Prices do not Fully Reflect the Implications of Current
Earnings for Future Earnings, Journal of Accounting and Economics 13: 305-340
Bessembinder and Chan (1995), The Profitability of Technical Trading Rules in the Asian Stock Markets,
Pacific-Basin Finance Journal 3: 257-284
Black, F. (1976), Studies of Stock Price Volatility Changes, in Proceedings of the 1976 Meetings of the
Business and Economic Statistics Section, American Statistical Association, 177–18.
Black, F. (1986), Noise, Journal of Finance 16(3): 529-543
Blume, Easley and O’Hara (1994), Market Statistics and Technical Analysis: The Role of Volume, Journal
of Finance 49: 153-181
Brandt, Brav, Graham and Kumar (2010), The Idiosyncratic Volatility Puzzle: Time Trend or Speculative
Episodes? Review of Financial Studies 23(2): 863-899
Bris, Goetzmann and Zhu (2003), Efficiency and the Bear: Short Sales and Markets Around the World,
working paper
Brock, Lakonishok and LeBaron (1992), Simple Technical Trading Rules and the Stochastic Properties of
Stock Returns, Journal of Finance 47(5): 1731-64
Brown and Kapadia (2007), Firm-Specific Risk and Equity Market Development. Journal of Financial
Economics 84: 358–88
Calomiris, Fisman and Wang (2008), Profiting from Government Stakes in a Command Economy:
Evidence from Chinese Asset Sales, working paper
Campbell, Lettau, Malkiel and Xu (2001), Have individual stocks become more volatile? An empirical
exploration of idiosyncratic risk, Journal of Finance 56: 1–43
25
26. Cao, Dybvig and Qiu (2007), Money Grab in China, working paper
Chan and Hameed (2006), Stock Price Synchronicity and Analyst Coverage in Emerging Markets, Journal
of Financial Economics 80: 115-147
Chang and Luo (2010), R2, Noise and Stock Returns, working paper
Chang and Wong (2009), Governance with Multiple Objectives: Evidence from Top Executive Turnover
in China, Journal of Corporate Finance 15: 230-244
Chen, Huang and Lai (2009), The Impact of Data Snooping on the Testing of Technical Analysis: An
Empirical Study of Asian Stock Markets, Journal of Asian Economics 20: 580-591
Chen, Jian and Xu (2009), Dividends for Tunneling in a Regulated Economy: The Case of China, Pacific-
Basin Finance Journal 17: 209-223
Chen and Li (2006), Is Technical Analysis Useful for Stock Traders in China? Evidence from the SZSE
Component A-Share Index, Pacific Economic Review 11(4): 477-488
Cheung, Rau and Stouraitis (2009), Helping Hand or Grabbing Hand? Central vs. Local Government
Shareholders in Chinese-Listed Firms, working paper
Daniel, Kent, Hirshleifer and Subrahmanyam (1998), Investor Psychology and Security Market Under or
Over-Reaction, Journal of Finance 53(6): 1839-1885
Daniel and Titman (2006), Market Reactions to Tangible and Intangible Information, Journal of Finance
61(4): 1605-43
Dasgupta, Gan and Gao (2010), Transparency, Stock Return Synchronicity, and the Informativeness of
Stock Prices, Theory and Evidence, Journal of Financial and Quantitative Analysis, forthcoming
De Long, Shleifer, Summers and Waldmann (1989), The Size and Incidence of Losses from Noise Trading,
Journal of Finance 44: 681-696
De Long, Shleifer, Summers, and Waldmann (1990a), Noise trader risk in financial markets, Journal of
Political Economy 98: 703–738
De Long, Shleifer, Summers, and Waldmann (1990b), Positive feedback investment strategies and
destabilizing rational speculation, Journal of Finance 45: 379–395
De Long, Shleifer, Summers, and Waldmann (1991), The survival of noise traders in financial markets,
Journal of Business 64: 1–19
Dubinsky and Johaness (2006), Earnings Announcements and Equity Options, working paper
Duffee (1995), Stock Returns and Volatility: A Firm-Level Analysis, Journal of Financial Economics 37:
399-420
Durnev, A., Morck, R., Yeung, B., and Zarowin, P. (2003), Does greater firm-specific return variation
mean more or less informed stock pricing? Journal of Accounting Research 41(5): 797-836
Durnev, A., Morck, R., Yeung, B., and Zarowin, P. (2004), Value-Enhancing Capital Budgeting and Firm-
Specific Stock Return Variation, Journal of Finance 59(1): 65-105
Ecker, Francis, Olsson and Schipper (2009), A Comparison of Market-Based and Accounting-Based
Descriptions of Business Risk, working paper
Engle (1982), Autoregressive Conditional Heteroskedasticity with Estimates of the Variance of the United
Kingdom Inflation, Econometrica 50(4): 987-1007
Fama (1970), Efficient capital markets: A review of theory and empirical work, Journal of Finance 25:
383–417
Fama and French (1993), Common Risk Factors in the Returns on Stocks and Bonds, Journal of Financial
Economics 33: 3-56
Fama and French (1995), Size and Book-to-Market Factors in Earnings and Returns, Journal of Finance
(1): 131-155
Fan, Joseph P.H., T.J. Wong and Tianyu Zhang (2007), Politically connected CEOs, corporate governance,
and Post-IPO performance of China's newly partially privatized firms, Journal of Financial
Economics 84(2): 330-357
Ferreira and Laux (2007), Corporate Governance, Idiosyncratic Risk, and Information Flow, Journal of
Finance 62(2): 951-989
Fink, Fink, Grullon and Weston (2010), What Drove the Increase in Idiosyncratic Volatility during the
Internet Boom? Journal of Financial and Quantitative Analysis, forthcoming
Frankel and Froot (1990), The Rationality of the Foreign Exchange Rate: Chartists, Fundamentalists, and
Trading in the Foreign Exchange Rate, American Economic Review 80: 181-5
Froot, Scharfstein and Stein (1992), Heard on the Street: Information Inefficiencies in a Market with Short-
Term Speculators, Journal of Finance 47: 1461-84
26
27. Fu (2009), Idiosyncratic Risk and the Cross-Section of Expected Stock Returns, Journal of Financial
Economics 91: 24-37
Grinold and Kahn (1999), Active Portfolio Management: A Quantitative Approach for Producing Superior
Returns and Controlling Risk, McGraw Hill
Grossman and Stiglitz (1980), On the Impossibility of Informationally Efficient Markets, American
Economic Review 70:393–408
Hartzell and Starks (2003), Institutional Investors and Executive Compensation, Journal of Finance 58(6):
2351-74
Hirshleifer (2001), Investor Psychology and Asset Pricing, Journal of Finance 56(4): 1533-97
Hirshleifer, Hou, Teoh and Zhang (2004), Do Investors Overvalue Firms with Bloated Balance Sheet,
Journal of Accounting and Economics 38: 297-331
Hu, F. (2009), Government Incentives, Top Management Turnover and Accounting Information: Evidence
from China’s SOEs, working paper
Huang, Liu, Rhee and Zhang (2010), Return Reversals, Idiosyncratic Risk, and Expected Returns, Review
of Financial Studies 23(1), forthcoming
Hutton, Marcus and Tehranian (2009), Opaque Financial Reports, R2, and Crash Risk, Journal of
Financial Economics 94: 67-86
Irvine and Pontiff (2009), Idiosyncratic Return Volatility, Cash Flows, and Product Market Competition,
Review of Financial Studies 22: 1149–77
Ito (1999), Profits on Technical Trading Rules and Time-Varying Expected Returns: Evidence from
Pacific-Basin Equity Markets, Pacific-Basin Finance Journal 7: 283-330
Jegadeesh (2000), Discussion on Foundations of Technical Analysis: Computational Algorithms,
Statistical Inference, and Empirical Implementation, Journal of Finance 55(4): 1765-70
Jiang, Xu and Yao (2009), The Information Content of Idiosyncratic Volatility, Journal of Financial and
Quantitative Analysis 44(1): 1-28
Jin, Li and Myers, Stewart C. (2006), R2 around the World: New Theory and New Tests, Journal of
Financial Economics 79: 257-292
Kumar and Lee (2006), Retail investor sentiment and return comovement, Journal of Finance 61: 2451-
2486
Kumar (2009), Who Gambles in the Stock Market, Journal of Finance 64: 1889-1933
Kwon, K-Y., Kish, R.J. (2002), A comparative study of technical trading strategies and return
predictability: An extension of Brock, Lakonishok, and LeBaron 1992 Using NYSE and NASDAQ
indices, Quarterly Review of Economics & Finance 42 (3): 611–631
Kyle (1985), Continuous Auctions and Insider Trading, Econometrica (November): 1315-36
LaPorta, R., Lopez-de-Silanes, R., Shleifer, A. and R. Vishny (2002), Investor protection and corporate
valuation, Journal of Finance 57: 1147-1170
LeBaron, B (2000), The stability of moving average technical trading rules on the Dow Jones index,
Derivatives Use, Trading Regulation 5(4): 324–338
Lee, Myers, and Swaminathan (1999), What is the Intrinsic Value of the Dow? Journal of Finance 54:
1693-1741
Lo, Andrew and MacKinlay (1990), Data-Snooping Biases in Tests of Financial Asset Pricing Models,
Review of Financial Studies 3: 431-467
Lo, Andrew, Mamaysky, H. and Wang, J. (2000), Foundations of Technical Analysis: Computational
Algorithms, Statistical Inference, and Empirical Implementation, Journal of Finance 55(4): 1705-65
Lo and Hasanhodzic (2009), The Heretics of Finance, Bloomberg Press
Malkiel, Burton (1996), A Random Walk down Wall Street: Including a Life-Cycle Guide to Personal
Investing, W. W. Norton, New York
Marshall, Qian and Young (2009), Is Technical Analysis Profitable on U.S. Stocks with Certain Size,
Liquidity or Industry Characteristics, Applied Financial Economics 19: 1213-21
Mashruwala, Christina, Rajgopal and Shevlin (2006), Why is the Accrual Anomaly Not Arbitraged Away?
The Role of Idiosyncratic Risk and Transaction Costs, Journal of Accounting and Economics 42: 3-33
Menkhoff and Taylor (2007), The Obstinate Passion of Foreign Exchange Professionals: Technical
Analysis, Journal of Economic Literature 45: 936-972
Miller (1977), Risk, Uncertainty and Divergence of Opinion, Journal of Finance 32: 1151-1168
Morck, Yeung and Yu (2000), The Information Content of Stock Markets: Why Do Emerging Markets
Have Synchronous Stock Price Movements, Journal of Financial Economics 58: 215-260
27
28. Park and Irwin (2007), What Do We Know About Technical Analysis, Journal of Economic Surveys 21(4):
786-826
Piotroski and Roulstone (2004), The Influence of Analysts, Institutional Investors, and Insiders on the
Incorporation of Market, Industry, and Firm-Specific Information into Stock Prices, Accounting
Review 79(4): 1119-51
Piotroski, T.J. Wong and Zhang (2009), Political Incentives to Suppress Negative Financial Information:
Evidence from State-Controlled Chinese Firms, working paper
Rajan, R. and L. Zingales (2003), The Great Reversals: The politics of financial development in the 20th
century, Journal of Financial Economics 69: 5-50
Rajgopal and Venkatachalam (2006), Financial Reporting Quality and Idiosyncratic Volatility over the
Last Four Decades, working paper
Ratner and Leal (1999), Tests of Technical Trading Strategies in the Emerging Equity Markets of Latin
America and Asia, Journal of Banking & Finance 23: 1887-1905
Ready, M.J. (2002), Profits from technical trading rules, Financial Management 31(3): 43–61
Roll, R. (1988), R-squared, Journal of Finance 43: 541–566
Schulmeister (2009), Profitability of Technical Stock Trading: Has It Moved From Daily to Intraday Data?
Review of Financial Economics 18: 190-201
Shiller (1981), The Use of Volatility Measures in Assessing Market Efficiency, Journal of Finance 36:
291-304
Shiller (2003), From Efficient Markets Theory to Behavioral Finance, Journal of Economic Perspectives
17(1): 83-104
Shleifer and Vishny (1986), Large Shareholders and Corporate Control, Journal of Political Economy 94:
461–88
Shleifer and Summers (1990), The Noise Trader Approach to Finance, Journal of Economic Perspectives:
19-33
Shleifer and Vishny (1993), Corruption, Quarterly Journal of Economics 108: 599-618
Sloan (1996), Do Stock Prices Fully Reflect Information in Accruals and Cashflows about Future Earnings?
Accounting Review 71: 289-315
Sullivan, Timmermann and White (1999), Data-Snooping, Technical Trading Rule Performance, and the
Bootstrap, Journal of Finance 44(5): 1647-91
Talley (2002), Stock Forecasters Are Having a Technical Rise in Popularity, Wall Street Journal 26: June
2002
Teoh, Yang and Zhang (2009), R2 and Market Efficiency, working paper
Tobin, J. (1982), On the efficiency of the financial system, Lloyd’s Banking Review 153: 1–15
Treynor and Ferguson (1985), In Defense of Technical Analysis, Journal of Finance 14(3): 757-773
Wang, Wu and Yang (2009), Does the Stock Market Affect Firm Investment in China? A Price
Informativeness Perspective, Journal of Corporate Finance 33: 53-62
Wei, Xie and Zhang (2005), Ownership Structure and Firm Value in China’s Privatized Firms: 1991–2001,
Journal of Financial and Quantitatively Analysis 40: 87-108
Wei and Zhang (2006), Why Did Individual Stocks Become More Volatile? Journal of Business 79: 259–
92
West (1988), Dividend Innovations and Stock Price Volatility, Econometrica 56: 37-61
White, H. (2000), A Reality Check for Data Snooping, Econometrica 68: 1097-1126
Wong, M.L.S. (2006), China's stock market: a marriage of capitalism and socialism. Cato Journal 26: 1–
35
Wurgler (2000), Financial Markets and the Allocation of Capital, Journal of Financial Economics 58:
187–214
Xu and Malkiel (2003), Investigating the Behavior of Idiosyncratic Volatility, Journal of Business 76:
613–44
Zhang (2006), Information Uncertainty and Stock Returns, Journal of Finance 61: 105-137
28