10 Essential Facts About Medicaer and Prescription Drug Spending
•
1 like•1,592 views

10 Essential Facts About Medicaer and Prescription Drug Spending

Recommended
Recommended
More Related Content
What's hot
What's hot (19)
Viewers also liked
Viewers also liked (17)
Similar to 10 Essential Facts About Medicaer and Prescription Drug Spending
Similar to 10 Essential Facts About Medicaer and Prescription Drug Spending (20)
More from KFF
More from KFF (20)
Recently uploaded
Recently uploaded (20)
10 Essential Facts About Medicaer and Prescription Drug Spending
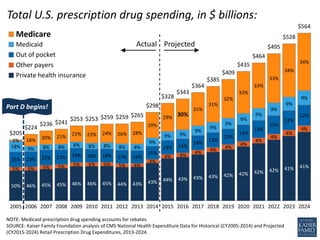
- 1. 50% 46% 45% 45% 46% 46% 45% 44% 43% 43% 44% 43% 43% 43% 42% 42% 42% 42% 41% 41%5% 5% 5% 5% 5% 5% 5% 5% 4% 4% 4% 4% 4% 4% 4% 4% 4% 4% 4% 4% 25% 23% 22% 21% 19% 18% 18% 17% 16% 15% 15% 14% 14% 13% 13% 13% 13% 13% 12% 12% 18% 9% 8% 8% 8% 8% 8% 8% 8% 9% 9% 9% 9% 9% 9% 9% 9% 9% 9% 9% 2% 18% 20% 21% 22% 23% 24% 26% 28% 29% 29% 30% 31% 31% 32% 33% 33% 33% 34% 34% $205 $224 $236 $241 $253 $253 $259 $259 $265 $298 $328 $343 $364 $385 $409 $435 $464 $495 $528 $564 2005 2006 2007 2008 2009 2010 2011 2012 2013 2014 2015 2016 2017 2018 2019 2020 2021 2022 2023 2024 Medicare Medicaid Out of pocket Other payers Private health insurance NOTE: Medicaid prescription drug spending accounts for rebates. SOURCE: Kaiser Family Foundation analysis of CMS National Health Expenditure Data for Historical (CY2005-2014) and Projected (CY2015-2024) Retail Prescription Drug Expenditures, 2013-2024. Total U.S. prescription drug spending, in $ billions: Actual Projected Part D begins!
- 2. SOURCE: DHHS ASPE Issue Brief, “Medicare Part B Drugs: Pricing and Incentives,” Table 1, March 2016, and 2016 Medicare Trustees Report (Tables III.D3 and V.B1). Total Medicare Spending in 2014 = $613.3 billion 13% 3% 84% Part D drug spending Part B drug spending Other Medicare spending
- 3. 7.4% 2.5% 9.2% 6.0% SOURCE: Kaiser Family Foundation analysis of data from 2016 Medicare Trustees Report (Table III.D4). Total Part D benefit spending growth rates (average annual growth) Per capita Part D benefit spending growth rates (average annual growth) Actual 2006-2015 Projected 2015-2025 Actual 2006-2015 Projected 2015-2025
- 4. SOURCE: Senate Finance Committee report, Appendix C, November 2015. Spending on Hepatitis C drugs, in $ millions: $116 $216 $356 $436 $491 $482 $481 $417 $373 $380 $421 $629 $628 $695 $864 $837 $773 $793 Jan 2014 Feb 2014 Mar 2014 Apr 2014 May 2014 Jun 2014 Jul 2014 Aug 2014 Sep 2014 Oct 2014 Nov 2014 Dec 2014 Jan 2015 Feb 2015 Mar 2015 Apr 2015 May 2015 Jun 2015
- 5. SOURCE: 2016 Medicare Trustees Report (Table V.D1). $5,019 $5,522 $2,203 $6,901 $8,642 $3,861 2015 2025 3.2% 4.6% 5.8% Part A Part B Part D Average Medicare per beneficiary spending: Projected average annual growth in Medicare per beneficiary spending for Parts A, B, and D between 2015-2025
- 6. NOTE: Analysis excludes beneficiaries enrolled in Medicare Advantage plans. SOURCE: Kaiser Family Foundation analysis of the Medicare Current Beneficiary Survey 2011 Cost & Use file. Average Total Out-of-Pocket Spending on Services in 2011: $2,763 Long-Term Care Facility 32% Medical Providers 23% Prescription Drugs 19% Dental 11% Outpatient Care 6% SNF & Home Health 5% Inpatient Care 4% Prescription drugs as a share of beneficiary out-of-pocket spending:
- 7. $383 $388 $373 $374 $389 $398 $409 $487 $566 $618 $658 $694 $730 $770 $811 $846 $310 $310 $320 $325 $310 $320 $360 $400 $410 $445 $485 $520 $550 $580 $610 $645 $0 $100 $200 $300 $400 $500 $600 $700 $800 $900 2010 2011 2012 2013 2014 2015 2016 2017 2018 2019 2020 2021 2022 2023 2024 2025 SOURCE: 2016 Medicare Trustees Report (Table V.E2). WE ARE HERE Annual Part D deductible Annual Part D premium Past and projected Medicare Part D premiums and deductibles:
- 8. 100% 100% 50% 86% 47.5% 72% 45% 58% 35% 44% 25% 25% Brand-name drugs Generic drugs 2010 2012 2014 2016 2018 2020 SOURCE: Kaiser Family Foundation illustration of data from the Centers for Medicare & Medicaid Services. Share of total drug costs beneficiaries pay in the coverage gap as the “doughnut hole” closes:
- 9. 24% 33% 38% 66% 65% 65% 49% 51% 53% 39% 42% 43% 76% 67% 62% 34% 35% 35% 51% 49% 47% 61% 58% 57% $0 $2,000 $4,000 $6,000 $8,000 $10,000 $12,000 $14,000 Revlimid Gleevec Zytiga Enbrel Humira Orencia Copaxone Tecfidera Avonex Harvoni Sovaldi Viekira Pak NOTE: Analysis includes 20 national and near-national stand-alone prescription drug plans in Baltimore, MD (zip code 21201) and reflects pricing at a Rite Aid pharmacy in this zip code. SOURCE: Georgetown/Kaiser Family Foundation analysis of 2016 Medicare Plan Finder data. HepatitisCMultiple Sclerosis Rheumatoid Arthritis Cancer $6,608 $7,153 $6,516 $5,979 $6,448 $6,235 $4,413 $4,864 $4,872 $11,538 $8,503 $7,227 Up to catastrophic coverage phase In catastrophic coverage phase Median on-formulary out-of- pocket costs in 2016:
- 10. Percent who say they favor each of the following: 86% 83% 76% 72% 48% Requiring drug companies to release information to the public on how they set their drug prices Allowing the federal government to negotiate with drug companies to get a lower price on medications for people on Medicare Limiting the amount drug companies can charge for high-cost drugs for illnesses like hepatitis or cancer Allowing Americans to buy prescription drugs imported from Canada Encouraging people to buy lower cost drugs by requiring them to pay a higher share if they choose a similar, higher cost drug NOTE: Items asked of half sample. SOURCE: Kaiser Family Foundation Health Tracking Poll (conducted August 6-11, 2015).