June 2019 and YTD Calgary Home Sale Stats from Calgary Real Estate Board and Licenced Realtors of Calgary
•
1 like•112 views

June 2019 and YTD 2019 Calgary Home Sale Stats. Buyers remain in control of the Calgary Real Estate Market. Mortgage Companies remain in control of Home Buyers. CMHC Rule changes to Mortgage Insurance Rules continues to soften markets in Vancouver and Toronto but hammers Calgary Real Estate. Want More Information - Contact Me - Jerry Charlton 403 831 0842

Recommended
Recommended
More Related Content
What's hot
What's hot (20)
Similar to June 2019 and YTD Calgary Home Sale Stats from Calgary Real Estate Board and Licenced Realtors of Calgary
Similar to June 2019 and YTD Calgary Home Sale Stats from Calgary Real Estate Board and Licenced Realtors of Calgary (20)
More from Jerry Charlton
More from Jerry Charlton (12)
Recently uploaded
Recently uploaded (20)
June 2019 and YTD Calgary Home Sale Stats from Calgary Real Estate Board and Licenced Realtors of Calgary
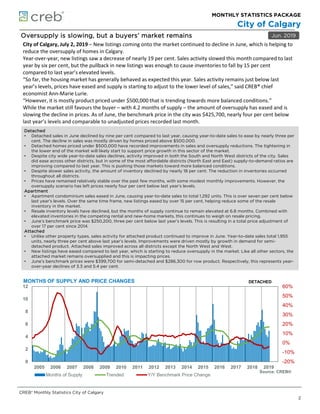
- 1. MONTHLY STATISTICS PACKAGE City of Calgary Oversupply is slowing, but a buyers’ market remains Jun. 2019 Detached • Detached sales in June declined by nine per cent compared to last year, causing year-to-date sales to ease by nearly three per cent. The decline in sales was mostly driven by homes priced above $500,000. • Detached homes priced under $500,000 have recorded improvements in sales and oversupply reductions. The tightening in the lower end of the market will likely start to support price growth in this sector of the market. • Despite city wide year-to-date sales declines, activity improved in both the South and North West districts of the city. Sales did ease across other districts, but in some of the most affordable districts (North East and East) supply-to-demand ratios are improving compared to last year. This is pushing those markets toward more balanced conditions. • Despite slower sales activity, the amount of inventory declined by nearly 18 per cent. The reduction in inventories occurred throughout all districts. • Prices have remained relatively stable over the past few months, with some modest monthly improvements. However, the oversupply scenario has left prices nearly four per cent below last year’s levels. Apartment • Apartment condominium sales eased in June, causing year-to-date sales to total 1,292 units. This is over seven per cent below last year’s levels. Over the same time frame, new listings eased by over 15 per cent, helping reduce some of the resale inventory in the market. • Resale inventory levels have declined, but the months of supply continue to remain elevated at 6.8 months. Combined with elevated inventories in the competing rental and new-home markets, this continues to weigh on resale pricing. • June’s benchmark price was $250,200, three per cent below last year’s levels. This is resulting in a total price adjustment of over 17 per cent since 2014. Attached • Unlike other property types, sales activity for attached product continued to improve in June. Year-to-date sales total 1,955 units, nearly three per cent above last year’s levels. Improvements were driven mostly by growth in demand for semi- detached product. Attached sales improved across all districts except the North West and West. • New listings have eased compared to last year, which is starting to reduce oversupply in the market. Like all other sectors, the attached market remains oversupplied and this is impacting prices. • June’s benchmark prices were $399,700 for semi-detached and $286,300 for row product. Respectively, this represents year- over-year declines of 3.3 and 5.4 per cent. -20% -10% 0% 10% 20% 30% 40% 50% 60% 0 2 4 6 8 10 12 2005 2006 2007 2008 2009 2010 2011 2012 2013 2014 2015 2016 2017 2018 2019 DETACHEDMONTHS OF SUPPLY AND PRICE CHANGES Months of Supply Trended Y/Y Benchmark Price Change Source: CREB® City of Calgary, July 2, 2019 – New listings coming onto the market continued to decline in June, which is helping to reduce the oversupply of homes in Calgary. Year-over-year, new listings saw a decrease of nearly 19 per cent. Sales activity slowed this month compared to last year by six per cent, but the pullback in new listings was enough to cause inventories to fall by 15 per cent compared to last year’s elevated levels. “So far, the housing market has generally behaved as expected this year. Sales activity remains just below last year’s levels, prices have eased and supply is starting to adjust to the lower level of sales,” said CREB® chief economist Ann-Marie Lurie. “However, it is mostly product priced under $500,000 that is trending towards more balanced conditions.” While the market still favours the buyer – with 4.2 months of supply – the amount of oversupply has eased and is slowing the decline in prices. As of June, the benchmark price in the city was $425,700, nearly four per cent below last year’s levels and comparable to unadjusted prices recorded last month. CREB® Monthly Statistics City of Calgary 2
- 2. Summary Stats City of Calgary Jun-18 Jun-19 Y/Y % Change 2018 YTD 2019 YTD % Change DETACHED Total Sales 1,209 1,100 -9.02% 5,255 5,100 -2.95% Total Sales Volume $693,638,790 $592,011,814 -14.65% $2,985,588,422 $2,759,215,973 -7.58% New Listings 2,304 1,791 -22.27% 11,422 9,834 -13.90% Inventory 4,816 3,961 -17.75% 3,452 3,692 6.97% Months of Supply 3.98 3.60 -9.60% 3.94 4.34 10.22% Sales to New Listings Ratio 52.47% 61.42% 8.94% 46.01% 51.86% 5.85% Sales to List Price Ratio 97.03% 96.79% -0.24% 97.29% 96.64% -0.65% Days on Market 41 49 19.53% 42 54 28.57% Benchmark Price $507,100 $488,900 -3.59% $507,200 $484,183 -4.54% Median Price $496,500 $470,000 -5.34% $496,000 $468,000 -5.65% Average Price $573,729 $538,193 -6.19% $568,142 $541,023 -4.77% Index 207 199 -3.58% 207 200 -3.40% APARTMENT Total Sales 292 262 -10.27% 1,396 1,292 -7.45% Total Sales Volume $84,780,433 $67,100,692 -20.85% $414,407,880 $349,852,572 -15.58% New Listings 659 670 1.67% 4,013 3,400 -15.28% Inventory 1,877 1,790 -4.64% 1,679 1,492 -11.14% Months of Supply 6.43 6.83 6.28% 7.22 6.93 -3.99% Sales to New Listings Ratio 44.31% 39.10% -5.21% 34.79% 38.00% 3.21% Sales to List Price Ratio 95.63% 94.99% -0.64% 96.11% 95.52% -0.59% Days on Market 59 71 20.55% 63 71 12.70% Benchmark Price $258,300 $250,200 -3.14% $256,167 $249,950 -2.43% Median Price $260,500 $233,750 -10.27% $255,250 $240,000 -5.97% Average Price $290,344 $256,110 -11.79% $296,854 $270,784 -8.78% Index 179 173 -3.14% 177 175 -1.38% ATTACHED Total Sales 394 418 6.09% 1,900 1,955 2.89% Total Sales Volume $157,776,325 $167,229,743 5.99% $769,558,965 $757,148,304 -1.61% New Listings 906 674 -25.61% 4,668 4,201 -10.00% Inventory 2,137 1,790 -16.24% 1,679 1,772 5.53% Months of Supply 5.42 4.28 -21.05% 5.30 5.44 2.57% Sales to New Listings Ratio 43.49% 62.02% 18.53% 40.70% 46.54% 5.83% Sales to List Price Ratio 97.32% 96.85% -0.47% 97.31% 96.70% -0.61% Days on Market 51 62 22.42% 54 64 18.52% Benchmark Price $332,900 $317,300 -4.69% $330,867 $315,117 -4.76% Median Price $345,500 $328,783 -4.84% $343,750 $325,500 -5.31% Average Price $400,448 $400,071 -0.09% $405,031 $387,288 -4.38% Index 196 187 -4.69% 195 188 -3.39% CITY OF CALGARY Total Sales 1,895 1,780 -6.07% 8,551 8,347 -2.39% Total Sales Volume $936,195,548 $826,342,249 -11.73% $4,169,555,267 $3,866,216,849 -7.28% New Listings 3,869 3,135 -18.97% 20,103 17,435 -13.27% Inventory 8,830 7,541 -14.60% 6,810 6,956 2.15% Months of Supply 4.66 4.24 -9.08% 4.78 5.00 4.65% Sales to New Listings Ratio 48.98% 56.78% 7.80% 42.54% 47.87% 5.34% Sales to List Price Ratio 96.95% 96.65% -0.30% 97.17% 96.55% -0.63% Days on Market 46 55 20.84% 48 59 22.92% Benchmark Price $442,900 $425,700 -3.88% $441,883 $422,450 -4.40% Median Price $434,000 $420,000 -3.23% $430,000 $412,287 -4.12% Average Price $494,035 $464,237 -6.03% $487,610 $463,186 -5.01% Index 201 193 -3.88% 201 194 -3.19% For a list of definitions, see page 26. Jun. 2019 CREB® Monthly Statistics City of Calgary 3
- 3. Summary Stats City of Calgary Jun-18 Jun-19 Y/Y % Change 2018 YTD 2019 YTD % Change CITY OF CALGARY SEMI-DETACHED Total Sales 183 190 3.83% 842 894 6.18% Total Sales Volume $90,863,463 $95,496,041 5.10% $423,598,604 $431,438,613 1.85% Share of Sales with Condo Title 18.03% 14.21% -3.82% 16.30% 14.78% -1.52% New Listings 410 290 -29.27% 2,041 1,820 -10.83% Inventory 919 742 -19.26% 698 765 9.61% Months of Supply 5.02 3.91 -22.23% 4.98 5.14 3.23% Sales to New Listings Ratio 44.63% 65.52% 20.88% 41.25% 49.12% 7.87% Sales to List Price Ratio 97.57% 96.96% -0.61% 97.48% 96.73% -0.75% Days on Market 47 65 40.02% 50 63 26.00% Benchmark Price $413,300 $399,700 -3.29% $413,750 $394,450 -4.66% Median Price $408,180 $416,500 2.04% $410,000 $389,950 -4.89% Average Price $496,522 $502,611 1.23% $503,086 $482,594 -4.07% Index 209 202 -3.30% 209 202 -3.50% CITY OF CALGARY ROW Total Sales 211 228 8.06% 1,058 1,061 0.28% Total Sales Volume $66,912,862 $71,733,702 7.20% $345,960,361 $325,709,691 -5.85% Share of Sales with Condo Title 94.31% 92.54% -1.77% 93.46% 90.94% -2.52% New Listings 496 384 -22.58% 2,627 2,381 -9.36% Inventory 1,218 1,048 -13.96% 981 1,006 2.63% Months of Supply 5.77 4.60 -20.37% 5.56 5.69 2.34% Sales to New Listings Ratio 42.54% 59.38% 16.83% 40.27% 44.56% 4.29% Sales to List Price Ratio 97.00% 96.72% -0.28% 97.10% 96.66% -0.43% Days on Market 54 60 9.54% 57 64 12.28% Benchmark Price $302,600 $286,300 -5.39% $299,533 $285,350 -4.74% Median Price $293,500 $294,250 0.26% $300,000 $287,000 -4.33% Average Price $317,123 $314,622 -0.79% $326,995 $306,984 -6.12% Index 189 179 -5.39% 187 181 -3.21% CITY OF CALGARY ATTACHED Total Sales 394 418 6.09% 1,900 1,955 2.89% Total Sales Volume $157,776,325 $167,229,743 5.99% $769,558,965 $757,148,304 -1.61% Share of Sales with Condo Title 58.88% 56.94% -3.30% 59.27% 56.57% -4.55% New Listings 906 674 -25.61% 4,668 4,201 -10.00% Inventory 2,137 1,790 -16.24% 1,679 1,772 5.53% Months of Supply 5.42 4.28 -21.05% 5.30 5.44 2.57% Sales to New Listings Ratio 43.49% 62.02% 18.53% 40.70% 46.54% 5.83% Sales to List Price Ratio 97.32% 96.85% -0.47% 97.31% 96.70% -0.61% Days on Market 51 62 22.42% 54 64 18.52% Benchmark Price $332,900 $317,300 -4.69% $330,867 $315,117 -4.76% Median Price $345,500 $328,783 -4.84% $343,750 $325,500 -5.31% Average Price $400,448 $400,071 -0.09% $405,031 $387,288 -4.38% Index 196 187 -4.69% 195 188 -3.39% For a list of definitions, see page 26. Jun. 2019 CREB® Monthly Statistics City of Calgary 4
- 4. Calgary Districts June 2019 Sales New Listings Sales to New Listings Ratio Inventory Months of Supply Benchmark Price Year-over-year benchmark price change Month-over- month benchmark price change Detached City Centre 102 230 44.35% 653 6.40 $659,000 -5.55% 0.37% North East 106 221 47.96% 444 4.19 $369,800 -1.88% -0.48% North 137 207 66.18% 479 3.50 $416,800 -1.98% 0.22% North West 176 276 63.77% 530 3.01 $527,700 -3.90% -0.30% West 114 216 52.78% 534 4.68 $707,200 -4.03% 0.93% South 276 351 78.63% 744 2.70 $456,200 -5.25% -0.04% South East 167 251 66.53% 496 2.97 $440,200 -2.07% 0.99% East 22 40 55.00% 80 3.64 $337,800 -4.33% 0.42% TOTAL CITY 1,100 1,791 61.42% 3,961 3.60 $488,900 -3.59% 0.20% Apartment City Centre 136 296 45.95% 894 6.57 $277,100 -3.68% 0.95% North East 10 19 52.63% 55 5.50 $226,000 2.68% 2.59% North 19 29 65.52% 80 4.21 $205,300 -4.38% -1.11% North West 21 46 45.65% 132 6.29 $235,900 -1.59% 1.07% West 23 71 32.39% 193 8.39 $231,800 -6.46% 0.43% South 22 70 31.43% 190 8.64 $217,500 -2.38% 1.07% South East 22 128 17.19% 212 9.64 $229,000 -3.70% -1.12% East 9 11 81.82% 34 3.78 $187,200 2.41% 1.91% TOTAL CITY 262 670 39.10% 1,790 6.83 $250,200 -3.14% 0.81% Semi-detached City Centre 68 120 56.67% 332 4.88 $731,700 -4.43% 0.90% North East 21 29 72.41% 72 3.43 $290,600 -3.52% -0.41% North 17 19 89.47% 46 2.71 $328,000 3.47% -0.09% North West 22 33 66.67% 65 2.95 $378,700 -2.85% 0.48% West 12 28 42.86% 77 6.42 $506,700 -2.61% 1.52% South 26 37 70.27% 74 2.85 $308,700 -6.14% -0.10% South East 15 15 100.00% 51 3.40 $312,100 -2.65% 0.94% East 9 9 100.00% 25 2.78 $276,800 -5.24% 0.00% TOTAL CITY 190 290 65.52% 742 3.91 $399,700 -3.29% 0.50% Row City Centre 38 69 55.07% 206 5.42 $439,100 -7.46% 0.16% North East 18 40 45.00% 119 6.61 $193,400 -2.27% 0.83% North 38 53 71.70% 154 4.05 $250,900 -3.98% 0.72% North West 25 53 47.17% 122 4.88 $296,700 -6.52% -0.77% West 31 47 65.96% 148 4.77 $330,400 -5.00% 0.70% South 43 67 64.18% 154 3.58 $245,800 -6.18% -1.09% South East 27 49 55.10% 116 4.30 $284,500 -4.56% -0.56% East 8 6 133.33% 29 3.63 $157,600 -7.89% 1.74% TOTAL CITY 228 384 59.38% 1,048 4.60 $286,300 -5.39% -0.07% *Total city figures can include activity from areas not yet represented by a community / district Jun. 2019 CREB® Monthly Statistics City of Calgary 5
- 5. District Trends 0 500 1,000 1,500 2,000 2,500 3,000 Jun. '05 Jun. '06 Jun. '07 Jun. '08 Jun. '09 Jun. '10 Jun. '11 Jun. '12 Jun. '13 Jun. '14 Jun. '15 Jun. '16 Jun. '17 Jun. '18 Jun. '19 TOTAL SALES City Centre South East South West North West North North East East Source: CREB® JUNE - 2.0 4.0 6.0 8.0 10.0 12.0 Detached Apartment Semi - Detached Row MONTHS OF SUPPLY City Centre South East South West North West North North East East Calgary Source: CREB® JUNE 0 1,000 2,000 3,000 4,000 5,000 6,000 7,000 8,000 9,000 10,000 Jun. '05 Jun. '06 Jun. '07 Jun. '08 Jun. '09 Jun. '10 Jun. '11 Jun. '12 Jun. '13 Jun. '14 Jun. '15 Jun. '16 Jun. '17 Jun. '18 Jun. '19 TOTAL INVENTORY City Centre South East South West North West North North East East Source: CREB® JUNE Jun. 2019 CREB® Monthly Statistics City of Calgary 6
- 6. Price Comparisons TYPICAL HOME ATTRIBUTES - DETACHED HOMES City Centre North East North North West West South South East East City of Calgary Gross Living Area (Above Ground) 1,233 1,170 1,338 1,501 1,703 1,365 1,468 1,091 1,341 Lot Size 5,528 4,070 4,396 5,328 5,625 5,242 4,273 4,805 4,908 Above Ground Bedrooms 2 3 3 3 3 3 3 3 3 Year Built 1951 1985 1997 1994 1997 1983 1999 1974 1991 Full Bathrooms 2 2 2 2 2 2 2 2 2 Half Bathrooms 0 1 1 1 1 1 1 0 1 - 100,000 200,000 300,000 400,000 500,000 600,000 700,000 800,000 Detached Apartment Semi - Detached Row Total Residential BENCHMARK PRICE - JUNE City Centre North East North North West West South South East East Calgary Source: CREB® -10% -8% -6% -4% -2% 0% 2% 4% 6% Detached Apartment Semi - Detached Row Total Residential YEAR OVER YEAR PRICE GROWTH COMPARISON - JUNE City Centre North East North North West West South South East East Calgary Source: CREB® Jun. 2019 CREB® Monthly Statistics City of Calgary 7
- 7. District Graphs 0 200 400 600 800 1,000 1,200 1,400 1,600 <$200,000 $200,000 - $299,999 $300,000 - $399,999 $400,000 - $499,999 $500,000 - $599,999 $600,000 - $699,999 $700,000 - 999,999 $1,000,000+ TOTAL INVENTORY BY PRICE RANGE - JUNE City Centre North East North North West West South South East East Source: CREB® 102 106 137 176 114 276 167 22 136 10 19 21 23 22 22 68 21 17 22 12 26 15 38 18 38 25 31 43 27 0 50 100 150 200 250 300 350 400 City Centre North East North North West West South South East East SALES BY PROPERTY TYPE - JUNE Detached Apartment Semi - Detached Row Source: CREB® 9% 10% 12% 16% 10% 25% 15% 2% 52% 4% 7% 8% 9% 8% 8% 36% 11% 9% 12% 6% 14% 8% 17% 8% 17% 11% 14% 19% 12% 0% 20% 40% 60% 80% 100% 120% City Centre North East North North West West South South East East SHARE OF CITY WIDE SALES - JUNE Detached Apartment Semi - Detached Row Source: CREB® 0 50 100 150 200 250 300 350 400 450 500 <$200,000 $200,000 - $299,999 $300,000 - $399,999 $400,000 - $499,999 $500,000 - $599,999 $600,000 - $699,999 $700,000 - 999,999 $1,000,000+ TOTAL SALES BY PRICE RANGE - JUNE City Centre North East North North West West South South East East Source: CREB® Jun. 2019 CREB® Monthly Statistics City of Calgary 8
- 8. City of Calgary Total Residential Jan. Feb. Mar. Apr. May Jun. Jul. Aug. Sept. Oct. Nov. Dec. 2018 01/01/18 02/01/18 03/01/18 04/01/18 05/01/18 06/01/18 07/01/18 08/01/18 09/01/18 10/01/18 11/01/18 12/01/18 Sales 959 1,089 1,369 1,514 1,725 1,895 1,547 1,491 1,267 1,320 1,172 794 New Listings 2,456 2,403 3,445 3,564 4,366 3,869 2,961 3,057 3,086 2,437 1,914 1,044 Inventory 4,640 5,207 6,389 7,334 8,458 8,830 8,473 8,139 7,961 7,338 6,534 4,916 Days on Market 61 51 45 47 46 46 52 56 56 60 63 69 Benchmark Price 439,400 440,700 442,000 443,400 442,900 442,900 440,900 437,400 434,300 432,300 429,000 424,600 Median Price 415,000 425,000 439,000 430,500 428,000 434,000 423,500 427,000 413,000 410,250 396,625 401,000 Average Price 468,023 493,008 495,374 478,116 490,207 494,035 479,224 483,752 466,016 468,444 443,533 449,000 Index 199 200 201 201 201 201 200 199 197 196 195 193 2019 01/01/19 02/01/19 03/01/19 04/01/19 05/01/19 06/01/19 07/01/19 08/01/19 09/01/19 10/01/19 11/01/19 12/01/19 Sales 802 973 1,327 1,545 1,920 1,780 New Listings 2,572 2,207 2,978 3,125 3,418 3,135 Inventory 5,496 5,899 6,611 7,078 7,487 7,541 Days on Market 71 64 61 55 56 55 Benchmark Price 421,100 420,200 420,700 422,400 424,600 425,700 Median Price 390,750 399,250 412,500 410,000 420,000 420,000 Average Price 450,777 460,317 460,368 460,745 472,763 464,237 Index 191 191 191 192 193 193 Jun-18 Jun-19 YTD 2018 YTD 2019 CALGARY TOTAL SALES 06/01/18 06/01/19 06/01/18 06/01/19 >$100,000 1 5 4 10 $100,000 - $199,999 100 106 463 548 $200,000 - $299,999 244 265 1,180 1,260 $300,000 -$ 349,999 203 209 907 977 $350,000 - $399,999 238 222 1,032 1,128 $400,000 - $449,999 228 217 1,082 1,012 $450,000 - $499,999 179 184 791 820 $500,000 - $549,999 157 126 707 601 $550,000 - $599,999 116 91 568 421 $600,000 - $649,999 92 85 376 340 $650,000 - $699,999 75 65 295 290 $700,000 - $799,999 94 64 413 347 $800,000 - $899,999 55 70 237 201 $900,000 - $999,999 37 28 145 118 $1,000,000 - $1,249,999 27 19 163 123 $1,250,000 - $1,499,999 25 14 85 81 $1,500,000 - $1,749,999 8 3 39 22 $1,750,000 - $1,999,999 6 2 26 16 $2,000,000 - $2,499,999 5 2 20 19 $2,500,000 - $2,999,999 3 1 9 2 $3,000,000 - $3,499,999 1 2 4 7 $3,500,000 - $3,999,999 1 - 4 3 $4,000,000 + - - 1 1 1,895 1,780 8,551 8,347 0 500 1,000 1,500 2,000 2,500 <$200,000 $200,000 - $299,999 $300,000 - $399,999 $400,000 - $499,999 $500,000 - $599,999 $600,000 - $699,999 $700,000 - 999,999 $1,000,000+ YTD JUNE CITY OF CALGARY TOTAL SALES BY PRICE RANGE YTD 2016 YTD 2017 YTD 2018 YTD 2019 Source: CREB® Jun. 2019 CREB® Monthly Statistics City of Calgary 9
- 9. City of Calgary Total Residential 0 2,000 4,000 6,000 8,000 10,000 12,000 14,000 16,000 YTD 2009 YTD 2010 YTD 2011 YTD 2012 YTD 2013 YTD 2014 YTD 2015 YTD 2016 YTD 2017 YTD 2018 YTD 2019 YTD JUNE Detached Apartment Semi - Detached Row 10 Year Average Source: CREB® CITY OF CALGARY TOTAL SALES 0 5,000 10,000 15,000 20,000 25,000 YTD 2009 YTD 2010 YTD 2011 YTD 2012 YTD 2013 YTD 2014 YTD 2015 YTD 2016 YTD 2017 YTD 2018 YTD 2019 YTD JUNE Detached Apartment Semi - Detached Row 10 Year Average Source: CREB® CITY OF CALGARY TOTAL NEW LISTINGS 405,000 410,000 415,000 420,000 425,000 430,000 435,000 440,000 445,000 - 1,000 2,000 3,000 4,000 5,000 6,000 7,000 8,000 9,000 10,000 Jun. '18 Jul. '18 Aug. '18 Sep. '18 Oct. '18 Nov. '18 Dec. '18 Jan. '19 Feb. '19 Mar. '19 Apr. '19 May. '19 Jun. '19 Inventory Sales Benchmark Price Source: CREB® CITY OF CALGARY TOTAL INVENTORY AND SALES - 1 2 3 4 5 6 7 8 2014 2015 2016 2017 2018 2019 Months of Supply Trended Source: CREB® 12 month moving average inventory CITY OF CALGARY TOTAL MONTHS OF INVENTORY -10% -5% 0% 5% 10% 15% 2014 2015 2016 2017 2018 2019 Average Price Y/Y% Change Median Price Y/Y% Change Benchmark Y/Y% Change Source: CREB® CITY OF CALGARY TOTAL PRICE CHANGE 320,000 340,000 360,000 380,000 400,000 420,000 440,000 460,000 480,000 500,000 520,000 2014 2015 2016 2017 2018 2019 Average Price Median Price Benchmark Price Source: CREB® CITY OF CALGARY TOTAL PRICES Jun. 2019 CREB® Calgary Regional Housing Market Statistics 10
- 10. City of Calgary Detached Jan. Feb. Mar. Apr. May Jun. Jul. Aug. Sept. Oct. Nov. Dec. 2018 01/01/18 02/01/18 03/01/18 04/01/18 05/01/18 06/01/18 07/01/18 08/01/18 09/01/18 10/01/18 11/01/18 12/01/18 Sales 584 653 844 906 1,059 1,209 968 928 788 829 680 496 New Listings 1,288 1,295 1,870 2,005 2,660 2,304 1,731 1,820 1,784 1,388 1,087 574 Inventory 2,200 2,459 3,079 3,652 4,504 4,816 4,592 4,444 4,354 3,985 3,506 2,598 Days on Market 55 45 37 41 40 41 49 51 52 57 60 66 Benchmark Price 504,100 507,100 507,800 509,300 507,800 507,100 504,600 500,900 497,000 494,100 491,400 486,200 Median Price 474,000 497,000 509,450 495,000 500,000 496,500 485,000 485,000 470,500 470,000 455,500 450,000 Average Price 545,711 575,329 568,654 558,840 577,253 573,729 560,720 563,704 539,455 543,462 532,883 511,103 Index 206 207 207 208 207 207 206 204 203 201 200 198 2019 01/01/19 02/01/19 03/01/19 04/01/19 05/01/19 06/01/19 07/01/19 08/01/19 09/01/19 10/01/19 11/01/19 12/01/19 Sales 486 589 816 928 1,181 1,100 New Listings 1,358 1,181 1,700 1,788 2,016 1,791 Inventory 2,844 2,995 3,397 3,700 3,931 3,961 Days on Market 67 63 57 49 50 49 Benchmark Price 482,000 480,600 481,500 484,200 487,900 488,900 Median Price 443,950 459,900 460,000 475,000 480,000 470,000 Average Price 521,285 541,086 528,494 545,216 557,111 538,193 Index 197 196 196 197 199 199 Jun-18 Jun-19 YTD 2018 YTD 2019 CALGARY TOTAL SALES 06/01/18 06/01/19 06/01/18 06/01/19 >$100,000 - - - - $100,000 - $199,999 - 1 2 3 $200,000 - $299,999 22 26 106 154 $300,000 -$ 349,999 98 93 363 425 $350,000 - $399,999 160 164 683 803 $400,000 - $449,999 183 179 855 846 $450,000 - $499,999 147 167 649 733 $500,000 - $549,999 137 113 625 543 $550,000 - $599,999 101 84 493 364 $600,000 - $649,999 83 72 321 281 $650,000 - $699,999 63 37 257 209 $700,000 - $799,999 70 50 307 244 $800,000 - $899,999 44 56 180 165 $900,000 - $999,999 31 18 109 87 $1,000,000 - $1,249,999 21 16 133 103 $1,250,000 - $1,499,999 25 14 78 73 $1,500,000 - $1,749,999 8 3 35 21 $1,750,000 - $1,999,999 6 2 24 14 $2,000,000 - $2,499,999 5 2 18 19 $2,500,000 - $2,999,999 3 1 8 2 $3,000,000 - $3,499,999 1 2 4 7 $3,500,000 - $3,999,999 1 - 4 3 $4,000,000 + - - 1 1 1,209 1,100 5,255 5,100 0 500 1,000 1,500 2,000 2,500 <$200,000 $200,000 - $299,999 $300,000 - $399,999 $400,000 - $499,999 $500,000 - $599,999 $600,000 - $699,999 $700,000 - 999,999 $1,000,000+ YTD JUNE CITY OF CALGARY DETACHED SALES BY PRICE RANGE YTD 2016 YTD 2017 YTD 2018 YTD 2019 Source: CREB® Jun. 2019 CREB® Monthly Statistics City of Calgary 11
- 11. City of Calgary Detached 0 1,000 2,000 3,000 4,000 5,000 6,000 7,000 8,000 9,000 YTD 2009 YTD 2010 YTD 2011 YTD 2012 YTD 2013 YTD 2014 YTD 2015 YTD 2016 YTD 2017 YTD 2018 YTD 2019 YTD JUNE Detached 10 Year Average Source: CREB® CITY OF CALGARY DETACHED SALES 0 2,000 4,000 6,000 8,000 10,000 12,000 14,000 16,000 YTD 2009 YTD 2010 YTD 2011 YTD 2012 YTD 2013 YTD 2014 YTD 2015 YTD 2016 YTD 2017 YTD 2018 YTD 2019 YTD JUNE Detached 10 Year Average Source: CREB® CITY OF CALGARY DETACHED NEW LISTINGS 465,000 470,000 475,000 480,000 485,000 490,000 495,000 500,000 505,000 510,000 - 1,000 2,000 3,000 4,000 5,000 6,000 Jun. '18 Jul. '18 Aug. '18 Sep. '18 Oct. '18 Nov. '18 Dec. '18 Jan. '19 Feb. '19 Mar. '19 Apr. '19 May. '19 Jun. '19 Inventory Sales Benchmark Price Source: CREB® CITY OF CALGARY DETACHED INVENTORY AND SALES - 1 2 3 4 5 6 7 2014 2015 2016 2017 2018 2019 Months of Supply Trended Source: CREB® 12 month moving average inventory CITY OF CALGARY DETACHED MONTHS OF INVENTORY -15% -10% -5% 0% 5% 10% 15% 2014 2015 2016 2017 2018 2019 Average Price Y/Y% Change Median Price Y/Y% Change Benchmark Y/Y% Change Source: CREB® CITY OF CALGARY DETACHED PRICE CHANGE 320,000 370,000 420,000 470,000 520,000 570,000 620,000 2014 2015 2016 2017 2018 2019 Average Price Median Price Benchmark Price Source: CREB® CITY OF CALGARY DETACHED PRICES Jun. 2019 CREB® Calgary Regional Housing Market Statistics 12
- 12. City of Calgary Apartment Jan. Feb. Mar. Apr. May Jun. Jul. Aug. Sept. Oct. Nov. Dec. 2018 01/01/18 02/01/18 03/01/18 04/01/18 05/01/18 06/01/18 07/01/18 08/01/18 09/01/18 10/01/18 11/01/18 12/01/18 Sales 145 197 219 261 282 292 254 242 212 213 239 105 New Listings 588 544 721 725 776 659 541 546 560 473 345 213 Inventory 1,290 1,436 1,695 1,853 1,924 1,877 1,781 1,668 1,624 1,508 1,325 1,030 Days on Market 76 68 64 59 59 59 62 71 66 69 65 74 Benchmark Price 256,000 255,300 256,000 255,800 255,600 258,300 258,200 257,000 256,400 256,600 252,400 251,200 Median Price 255,000 270,000 252,500 255,000 250,000 260,500 245,000 258,000 252,250 255,000 242,000 240,000 Average Price 298,942 325,905 300,005 286,118 289,715 290,344 280,879 294,787 300,967 286,192 275,078 283,916 Index 177 177 177 177 177 179 179 178 177 177 175 174 2019 01/01/19 02/01/19 03/01/19 04/01/19 05/01/19 06/01/19 07/01/19 08/01/19 09/01/19 10/01/19 11/01/19 12/01/19 Sales 125 150 189 251 315 262 New Listings 515 449 578 563 625 670 Inventory 1,178 1,301 1,496 1,549 1,655 1,790 Days on Market 80 71 74 68 70 71 Benchmark Price 251,100 250,800 249,600 249,800 248,200 250,200 Median Price 225,000 250,000 249,000 230,000 242,000 233,750 Average Price 271,209 285,468 294,108 263,009 268,028 256,110 Index 174 173 173 173 172 173 Jun-18 Jun-19 YTD 2018 YTD 2019 CALGARY TOTAL SALES 06/01/18 06/01/19 06/01/18 06/01/19 >$100,000 1 4 4 8 $100,000 - $199,999 76 84 350 391 $200,000 - $299,999 105 98 532 510 $300,000 -$ 349,999 45 39 201 161 $350,000 - $399,999 20 15 101 81 $400,000 - $449,999 15 12 71 57 $450,000 - $499,999 11 3 50 22 $500,000 - $549,999 7 2 23 15 $550,000 - $599,999 4 2 17 14 $600,000 - $649,999 1 - 8 9 $650,000 - $699,999 2 1 3 4 $700,000 - $799,999 - 1 6 9 $800,000 - $899,999 1 1 6 2 $900,000 - $999,999 2 - 7 3 $1,000,000 - $1,249,999 2 - 6 2 $1,250,000 - $1,499,999 - - 5 2 $1,500,000 - $1,749,999 - - 3 - $1,750,000 - $1,999,999 - - 1 2 $2,000,000 - $2,499,999 - - 1 - $2,500,000 - $2,999,999 - - 1 - $3,000,000 - $3,499,999 - - - - $3,500,000 - $3,999,999 - - - - $4,000,000 + - - - - 292 262 1,396 1,292 0 100 200 300 400 500 600 700 800 <$200,000 $200,000 - $299,999 $300,000 - $399,999 $400,000 - $499,999 $500,000 - $599,999 $600,000 - $699,999 $700,000 - 999,999 $1,000,000+ YTD JUNE CITY OF CALGARY APARTMENT SALES BY PRICE RANGE YTD 2016 YTD 2017 YTD 2018 YTD 2019 Source: CREB® Jun. 2019 CREB® Monthly Statistics City of Calgary 13
- 13. City of Calgary Apartment 0 500 1,000 1,500 2,000 2,500 3,000 YTD 2009 YTD 2010 YTD 2011 YTD 2012 YTD 2013 YTD 2014 YTD 2015 YTD 2016 YTD 2017 YTD 2018 YTD 2019 YTD JUNE Apartment 10 Year Average Source: CREB® CITY OF CALGARY APARTMENT SALES 0 500 1,000 1,500 2,000 2,500 3,000 3,500 4,000 4,500 5,000 YTD 2009 YTD 2010 YTD 2011 YTD 2012 YTD 2013 YTD 2014 YTD 2015 YTD 2016 YTD 2017 YTD 2018 YTD 2019 YTD JUNE Apartment 10 Year Average Source: CREB® CITY OF CALGARY APARTMENT NEW LISTINGS 242,000 244,000 246,000 248,000 250,000 252,000 254,000 256,000 258,000 260,000 - 200 400 600 800 1,000 1,200 1,400 1,600 1,800 2,000 Jun. '18 Jul. '18 Aug. '18 Sep. '18 Oct. '18 Nov. '18 Dec. '18 Jan. '19 Feb. '19 Mar. '19 Apr. '19 May. '19 Jun. '19 Inventory Sales Benchmark Price Source: CREB® CITY OF CALGARY APARTMENT INVENTORY AND SALES - 2 4 6 8 10 12 2014 2015 2016 2017 2018 2019 Months of Supply Trended Source: CREB® 12 month moving average inventory CITY OF CALGARY APARTMENT MONTHS OF INVENTORY -25% -20% -15% -10% -5% 0% 5% 10% 15% 20% 2014 2015 2016 2017 2018 2019 Average Price Y/Y% Change Median Price Y/Y% Change Benchmark Y/Y% Change Source: CREB® CITY OF CALGARY APARTMENT PRICE CHANGE 200,000 220,000 240,000 260,000 280,000 300,000 320,000 340,000 360,000 2014 2015 2016 2017 2018 2019 Average Price Median Price Benchmark Price Source: CREB® CITY OF CALGARY APARTMENT PRICES Jun. 2019 CREB® Calgary Regional Housing Market Statistics 14
- 14. City of Calgary Semi-Detached Jan. Feb. Mar. Apr. May Jun. Jul. Aug. Sept. Oct. Nov. Dec. 2018 01/01/18 02/01/18 03/01/18 04/01/18 05/01/18 06/01/18 07/01/18 08/01/18 09/01/18 10/01/18 11/01/18 12/01/18 Sales 99 106 143 155 156 183 150 142 121 125 108 87 New Listings 234 246 387 348 416 410 299 323 327 279 203 110 Inventory 447 533 674 756 861 919 901 890 852 816 752 570 Days on Market 62 48 45 52 52 47 48 56 55 60 78 79 Benchmark Price 411,200 414,100 414,100 415,500 414,300 413,300 411,000 410,200 406,200 402,100 399,300 396,100 Median Price 376,500 402,815 445,000 421,000 402,844 408,180 395,750 413,750 371,500 397,500 355,000 363,500 Average Price 460,514 509,176 551,874 507,585 484,474 496,522 491,368 484,917 448,723 477,262 437,269 467,019 Index 208 209 209 210 209 209 208 207 205 203 202 200 2019 01/01/19 02/01/19 03/01/19 04/01/19 05/01/19 06/01/19 07/01/19 08/01/19 09/01/19 10/01/19 11/01/19 12/01/19 Sales 84 103 148 167 202 190 New Listings 308 253 314 316 339 290 Inventory 649 689 759 770 795 742 Days on Market 67 59 66 63 61 65 Benchmark Price 392,000 391,200 390,000 396,100 397,700 399,700 Median Price 395,250 385,000 389,000 385,000 382,500 416,500 Average Price 498,689 465,963 478,728 473,561 475,852 502,611 Index 198 198 197 200 201 202 Jun-18 Jun-19 YTD 2018 YTD 2019 CALGARY TOTAL SALES 06/01/18 06/01/19 06/01/18 06/01/19 >$100,000 - - - - $100,000 - $199,999 2 4 9 23 $200,000 - $299,999 29 35 127 145 $300,000 -$ 349,999 23 29 124 160 $350,000 - $399,999 31 21 136 137 $400,000 - $449,999 16 17 77 71 $450,000 - $499,999 11 7 47 32 $500,000 - $549,999 7 3 32 20 $550,000 - $599,999 8 2 32 28 $600,000 - $649,999 6 11 35 39 $650,000 - $699,999 9 24 28 69 $700,000 - $799,999 24 13 94 90 $800,000 - $899,999 10 12 50 32 $900,000 - $999,999 4 9 26 25 $1,000,000 - $1,249,999 3 3 22 18 $1,250,000 - $1,499,999 - - 2 4 $1,500,000 - $1,749,999 - - - 1 $1,750,000 - $1,999,999 - - - - $2,000,000 - $2,499,999 - - 1 - $2,500,000 - $2,999,999 - - - - $3,000,000 - $3,499,999 - - - - $3,500,000 - $3,999,999 - - - - $4,000,000 + - - - - 183 190 842 894 0 50 100 150 200 250 300 350 400 <$200,000 $200,000 - $299,999 $300,000 - $399,999 $400,000 - $499,999 $500,000 - $599,999 $600,000 - $699,999 $700,000 - 999,999 $1,000,000+ YTD JUNE CITY OF CALGARY SEMI-DETACHED SALES BY PRICE RANGE YTD 2016 YTD 2017 YTD 2018 YTD 2019 Source: CREB® Jun. 2019 CREB® Monthly Statistics City of Calgary 15
- 15. City of Calgary Semi-Detached 0 200 400 600 800 1,000 1,200 1,400 YTD 2009 YTD 2010 YTD 2011 YTD 2012 YTD 2013 YTD 2014 YTD 2015 YTD 2016 YTD 2017 YTD 2018 YTD 2019 YTD JUNE Semi - Detached 10 Year Average Source: CREB® CITY OF CALGARY SEMI-DET. SALES 0 500 1,000 1,500 2,000 2,500 YTD 2009 YTD 2010 YTD 2011 YTD 2012 YTD 2013 YTD 2014 YTD 2015 YTD 2016 YTD 2017 YTD 2018 YTD 2019 YTD JUNE Semi - Detached 10 Year Average Source: CREB® CITY OF CALGARY SEMI-DET. NEW LISTINGS 375,000 380,000 385,000 390,000 395,000 400,000 405,000 410,000 415,000 420,000 - 100 200 300 400 500 600 700 800 900 1,000 Jun. '18 Jul. '18 Aug. '18 Sep. '18 Oct. '18 Nov. '18 Dec. '18 Jan. '19 Feb. '19 Mar. '19 Apr. '19 May. '19 Jun. '19 Inventory Sales Benchmark Price Source: CREB® CITY OF CALGARY SEMI-DET. INVENTORY AND SALES - 1 2 3 4 5 6 7 8 9 2014 2015 2016 2017 2018 2019 Months of Supply Trended Source: CREB® 12 month moving average inventory CITY OF CALGARY SEMI-DET. MONTHS OF INVENTORY -20% -15% -10% -5% 0% 5% 10% 15% 20% 25% 2014 2015 2016 2017 2018 2019 Average Price Y/Y% Change Median Price Y/Y% Change Benchmark Y/Y% Change Source: CREB® CITY OF CALGARY SEMI-DET. PRICE CHANGE 250,000 300,000 350,000 400,000 450,000 500,000 550,000 600,000 650,000 2014 2015 2016 2017 2018 2019 Average Price Median Price Benchmark Price Source: CREB® CITY OF CALGARY SEMI-DET. PRICES Jun. 2019 CREB® Calgary Regional Housing Market Statistics 16
- 16. City of Calgary Row Jan. Feb. Mar. Apr. May Jun. Jul. Aug. Sept. Oct. Nov. Dec. 2018 01/01/18 02/01/18 03/01/18 04/01/18 05/01/18 06/01/18 07/01/18 08/01/18 09/01/18 10/01/18 11/01/18 12/01/18 Sales 131 133 163 192 228 211 175 179 146 153 145 106 New Listings 346 318 467 486 514 496 390 368 415 297 279 147 Inventory 703 779 941 1,073 1,169 1,218 1,199 1,137 1,131 1,029 951 718 Days on Market 69 62 61 54 50 54 59 60 62 64 64 71 Benchmark Price 296,900 295,700 298,000 300,400 303,600 302,600 300,700 296,900 294,300 293,500 293,000 288,600 Median Price 295,000 300,000 300,000 308,950 308,450 293,500 292,500 300,000 299,000 289,900 289,000 295,250 Average Price 314,512 323,453 328,860 334,402 337,798 317,123 305,903 323,800 323,639 308,489 306,841 307,143 Index 186 185 187 188 190 189 188 186 184 184 183 181 2019 01/01/19 02/01/19 03/01/19 04/01/19 05/01/19 06/01/19 07/01/19 08/01/19 09/01/19 10/01/19 11/01/19 12/01/19 Sales 107 131 174 199 222 228 New Listings 391 324 386 458 438 384 Inventory 825 914 959 1,059 1,106 1,048 Days on Market 85 64 65 61 61 60 Benchmark Price 284,400 284,700 285,000 285,200 286,500 286,300 Median Price 284,000 281,000 295,075 284,900 284,950 294,250 Average Price 302,691 292,931 305,854 305,481 311,733 314,622 Index 178 178 178 179 179 179 Jun-18 Jun-19 YTD 2018 YTD 2019 CALGARY TOTAL SALES 06/01/18 06/01/19 06/01/18 06/01/19 >$100,000 - 1 - 2 $100,000 - $199,999 22 17 102 131 $200,000 - $299,999 88 106 415 451 $300,000 -$ 349,999 37 48 219 231 $350,000 - $399,999 27 22 112 107 $400,000 - $449,999 14 9 79 38 $450,000 - $499,999 10 7 45 33 $500,000 - $549,999 6 8 27 23 $550,000 - $599,999 3 3 26 15 $600,000 - $649,999 2 2 12 11 $650,000 - $699,999 1 3 7 8 $700,000 - $799,999 - - 6 4 $800,000 - $899,999 - 1 1 2 $900,000 - $999,999 - 1 3 3 $1,000,000 - $1,249,999 1 - 2 - $1,250,000 - $1,499,999 - - - 2 $1,500,000 - $1,749,999 - - 1 - $1,750,000 - $1,999,999 - - 1 - $2,000,000 - $2,499,999 - - - - $2,500,000 - $2,999,999 - - - - $3,000,000 - $3,499,999 - - - - $3,500,000 - $3,999,999 - - - - $4,000,000 + - - - - 211 228 1,058 1,061 0 100 200 300 400 500 600 <$200,000 $200,000 - $299,999 $300,000 - $399,999 $400,000 - $499,999 $500,000 - $599,999 $600,000 - $699,999 $700,000 - 999,999 $1,000,000+ YTD JUNE CITY OF CALGARY ROW SALES BY PRICE RANGE YTD 2016 YTD 2017 YTD 2018 YTD 2019 Source: CREB® Jun. 2019 CREB® Monthly Statistics City of Calgary 17
- 17. City of Calgary Row 0 200 400 600 800 1,000 1,200 1,400 1,600 1,800 2,000 YTD 2009 YTD 2010 YTD 2011 YTD 2012 YTD 2013 YTD 2014 YTD 2015 YTD 2016 YTD 2017 YTD 2018 YTD 2019 YTD JUNE Row 10 Year Average Source: CREB® CITY OF CALGARY ROW SALES 0 500 1,000 1,500 2,000 2,500 3,000 YTD 2009 YTD 2010 YTD 2011 YTD 2012 YTD 2013 YTD 2014 YTD 2015 YTD 2016 YTD 2017 YTD 2018 YTD 2019 YTD JUNE Row 10 Year Average Source: CREB® CITY OF CALGARY ROW NEW LISTINGS 275,000 280,000 285,000 290,000 295,000 300,000 305,000 - 200 400 600 800 1,000 1,200 1,400 Jun. '18 Jul. '18 Aug. '18 Sep. '18 Oct. '18 Nov. '18 Dec. '18 Jan. '19 Feb. '19 Mar. '19 Apr. '19 May. '19 Jun. '19 Inventory Sales Benchmark Price Source: CREB® CITY OF CALGARY ROW INVENTORY AND SALES - 1 2 3 4 5 6 7 8 9 2014 2015 2016 2017 2018 2019 Months of Supply Trended Source: CREB® 12 month moving average inventory CITY OF CALGARY ROW MONTHS OF INVENTORY -15% -10% -5% 0% 5% 10% 15% 2014 2015 2016 2017 2018 2019 Average Price Y/Y% Change Median Price Y/Y% Change Benchmark Y/Y% Change Source: CREB® CITY OF CALGARY ROW PRICE CHANGE 200,000 220,000 240,000 260,000 280,000 300,000 320,000 340,000 360,000 380,000 400,000 2014 2015 2016 2017 2018 2019 Average Price Median Price Benchmark Price Source: CREB® CITY OF CALGARY ROW PRICES Jun. 2019 CREB® Calgary Regional Housing Market Statistics 18
- 18. City of Calgary CITY CENTRE CITY CENTCITY CENTCITY CENTCITY CENTCITY CENTCITY CENTRE PRICES 0 500 1,000 1,500 2,000 2,500 3,000 3,500 YTD 2009 YTD 2010 YTD 2011 YTD 2012 YTD 2013 YTD 2014 YTD 2015 YTD 2016 YTD 2017 YTD 2018 YTD 2019 YTD JUNE CITY CENTRE TOTAL SALES Detached Apartment Semi - Detached Row 10 Year Average Source: CREB® 470,000 475,000 480,000 485,000 490,000 495,000 500,000 505,000 510,000 515,000 520,000 - 500 1,000 1,500 2,000 2,500 Jun. '18 Jul. '18 Aug. '18 Sep. '18 Oct. '18 Nov. '18 Dec. '18 Jan. '19 Feb. '19 Mar. '19 Apr. '19 May. '19 Jun. '19 CITY CENTRE INVENTORY AND SALES Inventory Sales Benchmark Price Source: CREB® - 2 4 6 8 10 12 14 2014 2015 2016 2017 2018 2019 CITY CENTRE MONTHS OF INVENTORY Months of Supply Trended Source: CREB® 12-month moving average -15% -10% -5% 0% 5% 10% 15% 20% 2014 2015 2016 2017 2018 2019 CITY CENTRE PRICE CHANGE Semi Y/Y%change Row Y/Y% change Apartment Y/Y% change Detached Y/Y% Change Source: CREB® Benchmark Price Change 100,000 200,000 300,000 400,000 500,000 600,000 700,000 800,000 900,000 2014 2015 2016 2017 2018 2019 CITY CENTRE PRICES Detached Price Apartment Price Row Price Semi Price Source: CREB® Benchmark Price 0 50 100 150 200 250 300 350 400 YTD JUNE CITY CENTRE TOTAL SALES BY PRICE RANGE YTD 2016 YTD 2017 YTD 2018 YTD 2019 Source: CREB® Jun. 2019 CREB® Calgary Regional Housing Market Statistics 19
- 19. City of Calgary NORTHEAST NORTHEANORTHEANORTHEANORTHEANORTHEANORTHEAST PRICES 0 200 400 600 800 1,000 1,200 1,400 1,600 YTD 2009 YTD 2010 YTD 2011 YTD 2012 YTD 2013 YTD 2014 YTD 2015 YTD 2016 YTD 2017 YTD 2018 YTD 2019 YTD JUNE NORTHEAST TOTAL SALES Detached Apartment Semi - Detached Row 10 Year Average Source: CREB® 330,000 332,000 334,000 336,000 338,000 340,000 342,000 344,000 346,000 348,000 - 100 200 300 400 500 600 700 800 900 Jun. '18 Jul. '18 Aug. '18 Sep. '18 Oct. '18 Nov. '18 Dec. '18 Jan. '19 Feb. '19 Mar. '19 Apr. '19 May. '19 Jun. '19 NORTHEAST INVENTORY AND SALES Inventory Sales Benchmark Price Source: CREB® - 1 2 3 4 5 6 7 2014 2015 2016 2017 2018 2019 NORTHEAST MONTHS OF INVENTORY Months of Supply Trended Source: CREB® 12-month moving average -15% -10% -5% 0% 5% 10% 15% 20% 25% 30% 2014 2015 2016 2017 2018 2019 NORTHEAST PRICE CHANGE Semi Y/Y%change Row Y/Y% change Apartment Y/Y% change Detached Y/Y% Change Source: CREB® Benchmark Price Change 100,000 150,000 200,000 250,000 300,000 350,000 400,000 450,000 2014 2015 2016 2017 2018 2019 NORTHEAST PRICES Detached Price Apartment Price Row Price Semi Price Source: CREB® Benchmark Price 0 50 100 150 200 250 300 350 400 450 500 . NORTHEAST TOTAL SALES BY PRICE RANGE YTD 2016 YTD 2017 YTD 2018 YTD 2019 Source: CREB® Jun. 2019 CREB® Calgary Regional Housing Market Statistics 20
- 20. City of Calgary NORTH NORTH TONORTH TONORTH INNORTH MNORTH P NORTH PRICES 0 200 400 600 800 1,000 1,200 1,400 1,600 1,800 YTD 2009 YTD 2010 YTD 2011 YTD 2012 YTD 2013 YTD 2014 YTD 2015 YTD 2016 YTD 2017 YTD 2018 YTD 2019 YTD JUNE NORTH TOTAL SALES Detached Apartment Semi - Detached Row 10 Year Average Source: CREB® 355,000 360,000 365,000 370,000 375,000 380,000 385,000 - 200 400 600 800 1,000 1,200 Jun. '18 Jul. '18 Aug. '18 Sep. '18 Oct. '18 Nov. '18 Dec. '18 Jan. '19 Feb. '19 Mar. '19 Apr. '19 May. '19 Jun. '19 NORTH INVENTORY AND SALES Inventory Sales Benchmark Price Source: CREB® - 1 2 3 4 5 6 7 2014 2015 2016 2017 2018 2019 NORTH MONTHS OF INVENTORY Months of Supply Trended Source: CREB® 12-month moving average -10% -5% 0% 5% 10% 15% 2014 2015 2016 2017 2018 2019 NORTH PRICE CHANGE Semi Y/Y%change Row Y/Y% change Apartment Y/Y% change Detached Y/Y% Change Source: CREB® Benchmark Price Change 100,000 150,000 200,000 250,000 300,000 350,000 400,000 450,000 500,000 2014 2015 2016 2017 2018 2019 NORTH PRICES Detached Price Apartment Price Row Price Semi Price Source: CREB® Benchmark Price 0 50 100 150 200 250 300 350 400 450 YTD JUNE NORTH TOTAL SALES BY PRICE RANGE YTD 2016 YTD 2017 YTD 2018 YTD 2019 Source: CREB® Jun. 2019 CREB® Calgary Regional Housing Market Statistics 21
- 21. City of Calgary NORTHWEST NORTHWNORTHWNORTHWNORTHWNORTHWNORTHWEST PRICES 0 200 400 600 800 1,000 1,200 1,400 1,600 1,800 2,000 YTD 2009 YTD 2010 YTD 2011 YTD 2012 YTD 2013 YTD 2014 YTD 2015 YTD 2016 YTD 2017 YTD 2018 YTD 2019 YTD JUNE NORTHWEST TOTAL SALES Detached Apartment Semi - Detached Row 10 Year Average Source: CREB® 445,000 450,000 455,000 460,000 465,000 470,000 475,000 480,000 485,000 490,000 495,000 - 200 400 600 800 1,000 1,200 Jun. '18 Jul. '18 Aug. '18 Sep. '18 Oct. '18 Nov. '18 Dec. '18 Jan. '19 Feb. '19 Mar. '19 Apr. '19 May. '19 Jun. '19 NORTHWEST INVENTORY AND SALES Inventory Sales Benchmark Price Source: CREB® - 1 2 3 4 5 6 7 2014 2015 2016 2017 2018 2019 NORTHWEST MONTHS OF INVENTORY Months of Supply Trended Source: CREB® 12-month moving average -10% -5% 0% 5% 10% 15% 20% 2014 2015 2016 2017 2018 2019 NORTHWEST PRICE CHANGE Semi Y/Y%change Row Y/Y% change Apartment Y/Y% change Detached Y/Y% Change Source: CREB® Benchmark Price Change 100,000 200,000 300,000 400,000 500,000 600,000 700,000 2014 2015 2016 2017 2018 2019 NORTHWEST PRICES Detached Price Apartment Price Row Price Semi Price Source: CREB® Benchmark Price 0 50 100 150 200 250 300 350 400 YTD JUNE NORTHWEST TOTAL SALES BY PRICE RANGE YTD 2016 YTD 2017 YTD 2018 YTD 2019 Source: CREB® Jun. 2019 CREB® Calgary Regional Housing Market Statistics 22
- 22. City of Calgary WEST WEST TOTWEST TOTWEST INVWEST MOWEST PRIWEST PRICES 0 200 400 600 800 1,000 1,200 1,400 1,600 YTD 2009 YTD 2010 YTD 2011 YTD 2012 YTD 2013 YTD 2014 YTD 2015 YTD 2016 YTD 2017 YTD 2018 YTD 2019 YTD JUNE WEST TOTAL SALES Detached Apartment Semi - Detached Row 10 Year Average Source: CREB® 510,000 520,000 530,000 540,000 550,000 560,000 570,000 580,000 - 200 400 600 800 1,000 1,200 Jun. '18 Jul. '18 Aug. '18 Sep. '18 Oct. '18 Nov. '18 Dec. '18 Jan. '19 Feb. '19 Mar. '19 Apr. '19 May. '19 Jun. '19 WEST INVENTORY AND SALES Inventory Sales Benchmark Price Source: CREB® - 1 2 3 4 5 6 7 8 9 10 2014 2015 2016 2017 2018 2019 WEST MONTHS OF INVENTORY Months of Supply Trended Source: CREB® 12-month moving average -15% -10% -5% 0% 5% 10% 15% 2014 2015 2016 2017 2018 2019 WEST PRICE CHANGE Semi Y/Y%change Row Y/Y% change Apartment Y/Y% change Detached Y/Y% Change Source: CREB® Benchmark Price Change 100,000 200,000 300,000 400,000 500,000 600,000 700,000 800,000 2014 2015 2016 2017 2018 2019 WEST PRICES Detached Price Apartment Price Row Price Semi Price Source: CREB® Benchmark Price 0 50 100 150 200 250 300 YTD JUNE WEST TOTAL SALES BY PRICE RANGE YTD 2016 YTD 2017 YTD 2018 YTD 2019 Source: CREB® Jun. 2019 CREB® Calgary Regional Housing Market Statistics 23
- 23. City of Calgary SOUTH SOUTH TOSOUTH TOSOUTH INSOUTH MSOUTH PRSOUTH PRICES 0 500 1,000 1,500 2,000 2,500 3,000 YTD 2009 YTD 2010 YTD 2011 YTD 2012 YTD 2013 YTD 2014 YTD 2015 YTD 2016 YTD 2017 YTD 2018 YTD 2019 YTD JUNE SOUTH TOTAL SALES Detached Apartment Semi - Detached Row 10 Year Average Source: CREB® 375,000 380,000 385,000 390,000 395,000 400,000 405,000 410,000 415,000 420,000 425,000 - 200 400 600 800 1,000 1,200 1,400 1,600 Jun. '18 Jul. '18 Aug. '18 Sep. '18 Oct. '18 Nov. '18 Dec. '18 Jan. '19 Feb. '19 Mar. '19 Apr. '19 May. '19 Jun. '19 SOUTH INVENTORY AND SALES Inventory Sales Benchmark Price Source: CREB® - 1 2 3 4 5 6 7 2014 2015 2016 2017 2018 2019 SOUTH MONTHS OF INVENTORY Months of Supply Trended Source: CREB® 12-month moving average -15% -10% -5% 0% 5% 10% 15% 20% 2014 2015 2016 2017 2018 2019 SOUTH PRICE CHANGE Semi Y/Y%change Row Y/Y% change Apartment Y/Y% change Detached Y/Y% Change Source: CREB® Benchmark Price Change 100,000 150,000 200,000 250,000 300,000 350,000 400,000 450,000 500,000 550,000 2014 2015 2016 2017 2018 2019 SOUTH PRICES Detached Price Apartment Price Row Price Semi Price Source: CREB® Benchmark Price 0 100 200 300 400 500 600 700 YTD JUNE SOUTH TOTAL SALES BY PRICE RANGE YTD 2016 YTD 2017 YTD 2018 YTD 2019 Source: CREB® Jun. 2019 CREB® Calgary Regional Housing Market Statistics 24
- 24. City of Calgary SOUTHEAST SOUTHEASOUTHEASOUTHEASOUTHEASOUTHEASOUTHEAST PRICES 0 200 400 600 800 1,000 1,200 1,400 1,600 1,800 2,000 YTD 2009 YTD 2010 YTD 2011 YTD 2012 YTD 2013 YTD 2014 YTD 2015 YTD 2016 YTD 2017 YTD 2018 YTD 2019 YTD JUNE SOUTHEAST TOTAL SALES Detached Apartment Semi - Detached Row 10 Year Average Source: CREB® 390,000 395,000 400,000 405,000 410,000 415,000 420,000 425,000 - 200 400 600 800 1,000 1,200 Jun. '18 Jul. '18 Aug. '18 Sep. '18 Oct. '18 Nov. '18 Dec. '18 Jan. '19 Feb. '19 Mar. '19 Apr. '19 May. '19 Jun. '19 SOUTHEAST INVENTORY AND SALES Inventory Sales Benchmark Price Source: CREB® - 1 2 3 4 5 6 7 2014 2015 2016 2017 2018 2019 SOUTHEAST MONTHS OF INVENTORY Months of Supply Trended Source: CREB® 12-month moving average -15% -10% -5% 0% 5% 10% 15% 20% 2014 2015 2016 2017 2018 2019 SOUTHEAST PRICE CHANGE Semi Y/Y%change Row Y/Y% change Apartment Y/Y% change Detached Y/Y% Change Source: CREB® Benchmark Price Change 100,000 150,000 200,000 250,000 300,000 350,000 400,000 450,000 500,000 2014 2015 2016 2017 2018 2019 SOUTHEAST PRICES Detached Price Apartment Price Row Price Semi Price Source: CREB® Benchmark Price 0 50 100 150 200 250 300 350 400 450 YTD JUNE SOUTHEAST TOTAL SALES BY PRICE RANGE YTD 2016 YTD 2017 YTD 2018 YTD 2019 Source: CREB® Jun. 2019 CREB® Calgary Regional Housing Market Statistics 25
- 25. City of Calgary EAST EAST TOTEAST TOTEAST INV EAST MO EAST PRICEAST PRICES 0 50 100 150 200 250 300 350 400 450 500 YTD 2009 YTD 2010 YTD 2011 YTD 2012 YTD 2013 YTD 2014 YTD 2015 YTD 2016 YTD 2017 YTD 2018 YTD 2019 YTD JUNE EAST TOTAL SALES Detached Apartment Semi - Detached Row 10 Year Average Source: CREB® 280,000 285,000 290,000 295,000 300,000 305,000 - 50 100 150 200 250 Jun. '18 Jul. '18 Aug. '18 Sep. '18 Oct. '18 Nov. '18 Dec. '18 Jan. '19 Feb. '19 Mar. '19 Apr. '19 May. '19 Jun. '19 EAST INVENTORY AND SALES Inventory Sales Benchmark Price Source: CREB® - 1 2 3 4 5 6 7 8 2014 2015 2016 2017 2018 2019 EAST MONTHS OF INVENTORY Months of Supply Trended Source: CREB® 12-month moving average -15% -10% -5% 0% 5% 10% 15% 20% 25% 2014 2015 2016 2017 2018 2019 EAST PRICE CHANGE Semi Y/Y%change Row Y/Y% change Apartment Y/Y% change Detached Y/Y% Change Source: CREB® Benchmark Price Change 100,000 150,000 200,000 250,000 300,000 350,000 400,000 2014 2015 2016 2017 2018 2019 EAST PRICES Detached Price Apartment Price Row Price Semi Price Source: CREB® Benchmark Price 0 20 40 60 80 100 120 140 160 YTD JUNE EAST TOTAL SALES BY PRICE RANGE YTD 2016 YTD 2017 YTD 2018 YTD 2019 Source: CREB® Jun. 2019 CREB® Calgary Regional Housing Market Statistics 26
- 26. CREB® Definitions 183 190 DEFINITIONS Benchmark Price- Represents the monthly price of the typical home based on its attributes such as size, location and number of bedrooms. MLS® Home Price Index – Changes in home prices by comparing current price levels relative to January 2005 price level. Absorption Rate – Refers to the ratio between the amount of sales occurring in the market relative to the amount of inventory. Months of Supply – Refers to the ratio between Inventory and sales which represents at the current pace of sales how long it would take to clear existing inventory. Detached - A unit that is not attached to any other unit. Semi-detached - A single dwelling built as one of a pair that share one common wall. Row - A single dwelling attached to each other by a common wall with more than two properties in the complex. Attached - Both row and semi-detached properties. Apartment - A unit within a high rise or low rise condominium building with access through an interior hallway. Total Residential - Includes detached, attached and apartment style properties. Exclusions – Data included in this package do not include activity related to multiple-unit sales, rental, land or leased properties. ABOUT CREB® CREB® is a professional body of more than 5,100 licensed brokers and registered associates, representing 245 member offices. CREB® is dedicated to enhancing the value, integrity and expertise of its REALTOR® members. Our REALTORS® are committed to a high standard of professional conduct, ongoing education, and a strict Code of Ethics and standards of business practice. Any use or reference to CREB® data and statistics must acknowledge CREB® as the source. The board does not generate statistics or analysis of any individual member or company’s market share. All MLS® active listings for Calgary and area may be found on the board’s website at ww.creb.com. CREB® is a registered trademark of the Calgary Real Estate Board Cooperative. The trademarks MLS® and Multiple Listing Service® are owned by the Canadian Real Estate Association (CREA) and identify the quality of services provided by real estate professionals who are members of CREA. The trademarks REALTOR® and REALTORS® are controlled by CREA and identify real estate professionals who are members of CREA, and subsequently the Alberta Real Estate Association and CREB®, used under licence. Jun. 2019 CREB® Monthly Statistics City of Calgary 27