Parameters Optimization SAGmill 40x26.compressed
•
0 recomendaciones•675 vistas


Recomendados
Más contenido relacionado
Similar a Parameters Optimization SAGmill 40x26.compressed
Similar a Parameters Optimization SAGmill 40x26.compressed (20)
Parameters Optimization SAGmill 40x26.compressed
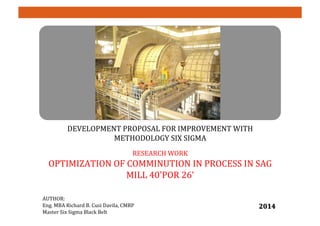
- 1. DEVELOPMENT PROPOSAL FOR IMPROVEMENT WITH METHODOLOGY SIX SIGMA RESEARCH WORK OPTIMIZATION OF COMMINUTION IN PROCESS IN SAG MILL 40'POR 26’ AUTHOR: Eng. MBA Richard B. Cusi Davila, CMRP Master Six Sigma Black Belt 2014
- 2. Introduc)on CHINALCO: • It is the second largest alumina producer in the world and the third largest producer of primary aluminum. • The Toromocho project is a large deposit of copper and molybdenum is 1.53 million tons of reserves. • The Toromocho project is located in the east side of the Andes in Peru, 140 km east of Lima along the Carretera Central, road to La Oroya. SAG MILL: • The CHINALCO mining, has the SAG mill with a design capacity of 5,250 tons per hour based on 93% availability. • The plant is designed to operate 24 hours a day, 365 days a year. • We need to detect, measure and correct the problems that cause poor discharge (amount) of mineral in the SAG mill.
- 3. Definir – Planteamiento del proyecto C D M A I 6σ ISSUE VOC (Voice of Client) CCR (Critical Customer Requirement) TARGET SCOPE • SAG mill production does not reach the expected levels of 2620 tph. (*) • The mill output is less than planned impacting share product delivery to customers. • I need the fresh mineral is greater than or equal to the ram-‐up production. CTP (Critical to Process) • The balls and lime supply must remain constant during operation of the mill. • The mill should not generate constraints for the discharge of ore milled. • Improve the amount of fresh ore produced and exceed expected levels of 2620 tph. • It includes improvements related to the mill. • Does not include upstream equipment (conveyor, feeders, etc.) • Excludes downstream equipment (sieve classieication, regrind, etc.) (*) Status taken in January 2014.
- 4. C D M A I 6σProcess tons in SAG Mill (tons by day)
- 5. C D M A I 6σ STABILIZATION STAGE Concept Jan-14 Feb-14 Mar-14 Actual Production (ton) (*) 200,000.00 1,640,800.00 1,965,935.48 REAL BENEFITS ($) 1,028,741.64 8,439,796.40 10,112,198.45 Design Production (ton) 3,515,400.00 3,515,400.00 3,515,400.00 Loss Production (ton) -3,315,400.0 -1,874,600.0 -1,549,464.5 Lost Production ($) - 17,053,450.1 -9,642,395.4 -7,969,993.3 Optimization Loss after improvement ($) Target Production - 6 Sigma (ton) Target vs. Real (ton) OBJETIVE BENEFITS ($) STAGE AFTER OF IMPROVEMENT (changes grate) Concept abr-14 may-14 jun-14 Actual Production (ton) (*) REAL BENEFITS ($) Design Production (ton) 3,515,400.00 3,515,400.00 3,515,400.00 Loss Production (ton) Lost Production ($) 0.0 0.0 0.0 Optimization Loss after improvement ($) 0.0 0.0 0.0 Target Production - 6 Sigma (ton) 2,829,600.00 2,829,600.00 2,829,600.00 Target vs. Real (ton) OBJETIVE BENEFITS ($) 14,554,636.70 14,554,636.70 14,554,636.70 * The value of real output, is reported by the Operations.
- 6. SIPOC C D M A I 6σ Supplier Inputs Outputs Customers Process Primary Crushing Ore transport, storage and dosage of lime and balls Ore processing mill Mineral classieication in the trommel Mine Input capacity trucks Particle size 345 Tn <= 630 mm Particle size Crushing capacity <= 180 mm 6510 tph Promary Chusher Conveyors System Overland Coveyor 200-‐CV-‐003 Conveyor 210-‐CV-‐001 Fresh crushed ore Fresh Mineral, pebbles, beads and lime 10300 tph 6324 tph Uninterrupted power supply capacity 12 hrs Ball Consumption Lime consumption 340 g/t 4000 g/t Feed chute SAG Mineral processing Particle size Electrical Power Mill speed 5250 tph 180 mm >= 280 MW ~9.3 RPM Percent Solids >= 65% Mineral processing >= 65% Trommel discharge SAG Mill SAG Mill Stock pile Particle Size >= 700 micrones Classieication Shale and cyclones
- 7. Fun)onal Process source: PI System C D M A I 6σ
- 8. Measure – Process Blocks C D M A I 6σ Supply fresh crushed ore Recirculation of pebbles Adding balls and spinning mill Classieication of ore per grates and trommel 1 1 Y1-‐out step 1: Tonnes processed fresh y2-‐out step 2: Mineral Density (% solids) y3-Output Step 3: Power consumption (Kwh) y4-‐out step 4: download tons (tph) Step 1 Check In: Cr: Tons processed fresh tph C: Speed of feeding belt N: Number of foreign material S: PS1 Tickets step 2: X2 –Cr: mineral density (% solids) X1 -‐ C: Amount of water N: Tonnes of ore processed S: PS2 Inputs step 3: X3-‐ Cr: Power consumption (Kwh) X4 -‐ C: mill speed (Rpm) N: Inertia (weight of mineral) S: PS3 Step 4 Check In: Cr: Short circuit or return of mineral X5 -‐ C: Slot grill (Evacuation Area). N: mineral recirculation (internal to the mill) S: PS4 Nomenclature of the types of variables Cr: Variable Review C: Controllable variable N: Variable noise S: Standard Operating Procedure.
- 9. Salida Paso 1 : Toneladas Frescas Procesadas (tph) y2: Salida Paso 2 : Densidad de mineral (% de solidos) Salida Paso 3 : Potencia consumida (kWh) Salida Paso 4 : Toneladas de Descarga (tph) Variables de Salida Y1 Y2 Y3 Y4 Importancia de 1 a 10 10 4 4 6 Variables de Entrada Calificación x1 C: Cantidad de agua 1 3 1 1 32 x2 Cr: Densidad de mineral (% de solidos) 1 3 0 1 28 x3 Cr: Potencia consumida (kWh) 3 1 9 0 70 x4 C. Velocidad de Molino (rpm) 9 0 3 9 156 x5 C: Slot de Parrilla 9 0 0 9 144 Total puntuación "Y" 23 7 13 20 Correlación 0 Ninguna 1 Baja 3 Moderada 9 Alta Correlación entre x´s e y´s Cause and Effect Matrix C D M A I 6σ The results of the matrix cause -‐ effect, the variables with the greatest impact on production are speed mill and slot grill.
- 10. C D M A I 6σ
- 11. Process Capability -‐ Baseline C D M A I 6σ 48004000320024001600800 LEI LEI 2620 O bjetiv o * LES * Media de la muestra 2595.74 Número de muestra 879 Desv .Est. (Dentro) 442.663 Desv .Est. (General) 919.55 Procesar datos Z.Bench -0.05 Z.LEI -0.05 Z.LES * C pk -0.02 Z.Bench -0.03 Z.LEI -0.03 Z.LES * Ppk -0.01 C pm * C apacidad general C apacidad (dentro) del potencial % < LEI 50.85 % > LES * % Total 50.85 Desempeño observ ado % < LEI 52.19 % > LES * % Total 52.19 Exp. Dentro del rendimiento % < LEI 51.05 % > LES * % Total 51.05 Exp. Rendimiento general Dentro de General Capacidad de proceso Baseline • As a baseline we have a process with a capacity of 1.45 Sigmas and 51% of production that does not eit within specieication.
- 12. Analyze -‐ Demonstra)on of causality C D M A I 6σ Variables X1: Water Quantity X2: Percent solids X3: Power input X4: Speed mill Results of individual regression P value Adjusted R2 0.00 31.9% 0.00 6.0% 0.00 8.8% 0.00 33.8% 0.00 0.8% X5: Slot grate Multiple regression results • The single most signieicant variables are X1-‐Water Quantity and X3-‐speed mill, however the variables together explain only 74% model. Y: TnProcesadas = - 8677 + 1.50 X1: CantAgua + 93.4 X2: %Sólido - 38.5 X3: Potencia + 345 X4: VelocMolino + 24.0 X5: SlotParrila Predictor Coef SE Coef T P VIF Constante -8677.4 216.7 -40.04 0.000 X1: CantAgua 1.50295 0.03516 42.74 0.000 2.261 X2: %Sólido 93.436 2.766 33.79 0.000 2.038 X3: Potencia -38.492 6.377 -6.04 0.000 4.310 X4: VelocMolino 345.47 26.44 13.06 0.000 5.339 X5: SlotParrila 24.002 2.001 11.99 0.000 1.151 S = 422.022 R-cuad. = 74.0% R-cuad.(ajustado) = 73.9%
- 13. 3000 1500 0 8 6 4 24 16 8 80 60 40 500030001000 70 60 50 300015000 864 24168 806040 Y: TnProcesadas X1: CantAgua x2: VelocMolino X3: Potencia X4: %Sólido X5: SlotParrila Gráfica de matriz de Y: TnProcesa, X1: CantAgua, x2: VelocMol, ... Y: Process Tons X1: Water quantity X2: Mill Speed X3: Power X4: % Solid X5: Slot grate Correlation level: 0.82 P Value: 0.00 Correla)on analysis between variables • The level of correlation between the speed and power of the mill is high. • Looking for experimentation only consider one of them. C D M A I 6σ
- 14. Design of Experiments C D M A I 6σ DOE Results Regresión factorial: Y vs. CantAgua, %Sólidos, Velocidad, Slot Análisis de Varianza Fuente GL SC Ajust. MC Ajust. Valor F Valor p Modelo 10 25716841 2571684 32.75 0.000 Lineal 4 17227423 4306856 54.84 0.000 CantAgua 1 4420610 4420610 56.29 0.000 %Sólidos 1 6961461 6961461 88.64 0.000 Velocidad 1 420140 420140 5.35 0.031 Slot 1 5425212 5425212 69.08 0.000 Interacciones de 2 términos 5 8052373 1610475 20.51 0.000 CantAgua*%Sólidos 1 1294945 1294945 16.49 0.001 CantAgua*Velocidad 1 171750 171750 2.19 0.154 CantAgua*Slot 1 4608884 4608884 58.69 0.000 %Sólidos*Velocidad 1 640244 640244 8.15 0.009 %Sólidos*Slot 1 1336550 1336550 17.02 0.000 Interacciones de 3 términos 1 437045 437045 5.56 0.028 CantAgua*%Sólidos*Velocidad 1 437045 437045 5.56 0.028 Error 21 1649253 78536 Falta de ajuste 5 1649253 329851 4.21834E+29 0.000 Error puro 16 0 0 Total 31 27366094 Resumen del modelo R-cuad. R-cuad. S R-cuad. (ajustado) (pred) 280.242 93.97% 91.10% 86.01% • When performing the experiments as DOE, with the four variables, we obtain an adjusted R2 of 91.10%. • Only used 4 of the 5 initial variables.
- 15. C D M A I 6σ DOE -‐ Graphic Effects Graph of standardized effects Pareto standardized effects • Both the individual variables and their interactions are signieicant.
- 16. • All variables except "speed" have very marked effects on the dependent variable. • • • There are important interactions that have a signieicant effect on production. • • Main effects plot Graph of interaction for Y C D M A I 6σ
- 17. CantAgua 1425 %Sólidos 64 Velocidad 7.25 Slot Alto Valores fijos %Sólidos*CantAgua 16801560144013201200 70 65 60 Velocidad*CantAgua 16801560144013201200 7.8 7.5 7.2 6.9 6.6 Velocidad*%Sólidos 706560 7.8 7.5 7.2 6.9 6.6 > – – – – – < 2400 2400 2700 2700 3000 3000 3300 3300 3600 3600 3900 3900 Y Gráficas de contorno de Y CantAgua 1425 %Sólidos 64 Velocidad 7.25 Slot Alto Valores fijos 0021 0041 1 06 0 5002 3000 0350 0021 0041 06 00 7 56 06 770 0350 04 00 Y sodilóS% augAtnaC 21 00 1 004 1 006 0003 31 05 21 00 1 004 07. 00 5.7 07. 0.8 5 31 05 0033 Y dadicoleV augAtnaC 60 56 0002 5 002 3000 60 56 0.8 7.5 7.0 07 3500 Y dadicoleV sodilóS% Y ed eicifrepus ed sacifárG C D M A I 6σ Contour plot Graphical response surface • These graphs show the expected production levels for specieic setteos by variables. Contour plots and response surface
- 18. C D M A I 6σ • According to optimize production DOE should settear variables at their maximum values. Combina)on of variables suggested by DOE to op)mize produc)on
- 19. C D M A I 6σ 4900430037003100250019001300700 160 120 80 40 0 LEI Z.Bench -0.055 Z.LEI -0.055 Z.LES * Cpk -0.018 Dentro de Z.Bench -0.026 Z.LEI -0.026 Z.LES * Ppk -0.009 Cpm * General Dentro de General 4900430037003100250019001300700 240 180 120 60 0 LEI Z.Bench 1.980 Z.LEI 1.980 Z.LES * Cpk 0.660 Dentro de Z.Bench 0.714 Z.LEI 0.714 Z.LES * Ppk 0.238 Cpm * General Dentro de General Histogramas de capacidad de Antes, Despues Antes Despues Residual plot • A shift in the mean of 2,595 tph to 3,210 tph was achieved, and production improved after ~ 24% higher. • The production that was out of spec went from ~ 51% to ~ 26%. • The Sigma level rose from 1.47 to 2.2, the increase is not higher because there is still variability. • In the three months after the improvement has been steadily losing ~ 5.4 MM USD. Results aMer implementa)on of improvements
- 20. C D M A I 6σ Investment Value: $ 1,200,000.00 (2 sets of grill, drawers discharge, accessories). PAYMENT IS Jun14.
- 21. Control -‐ Process Control System 6σ C D M A I
- 22. Concluding • This project's main achievement a shift of the average 24%, from a production of 2,595 to 3,210 tph NPT; and reducing off-‐spec production which increased from 51% to 26%. • The Sigma level rose from 1.47 to 2.2, the increase is not higher because there is still variability. Is pending develop initiatives that aim to further reduce variability in production. • In the three months after the improvement has been steadily losing ~ 5.4 MM USD. • With the developed methodology, we have identieied signieicant variables in the process and the ideal combination of them; in order to achieve higher levels of productivity of the mill, as it was achieved in this project. • For the remaining steps (2 and 3) we improve follow the line obtained in this experiment and work on continuous improvement in order to achieve the expected levels.
- 23. BACK UP
- 24. FMEA -‐ Priority risk C D M A I 6σ Paso del Proceso Funcion Salida o Entrada Modo de Falla Potencial Severida d (1-‐ 10) G Causa Potencial de la Falla Frecuenc ia (1 a 10) F Detectabi lidad (1-‐ 10) D 1 Suministro de mineral fresco desde Chancado Alimentar constantemente de mineral fresco en las mejores condiciones (sin material extraño); al molino SAG. Salida Paso 1 : Toneladas Frescas Procesadas (tph) Restricción para ingresar mineral, por atoramiento de molino SAG 10 Desgaste de piezas de molienda 6 10 2 Recirculación (pebbles), y adiciòn de agua Optimizar el grado de molienda, aprovechando el mineral chancado con las chancadoras RAPTOR. Mantener la molienda constante; a través de los elementos de molienda (Bolas 5"). Conseguri el nivel optimo de la densidad de mineral. y2: Salida Paso 2 : Densidad de mineral (% de solidos) Exceso o deficit del % solidos en alimentación de molino. 2 Sistema filtración mal seleccionado 4 6 3 Adición de Bolas 5" (Potencia) y Giro de molino a velocidad RPM crítico Generar el "riñon de molienda" dentro del molino, para generar conminución por abrasión e impacto. Salida Paso 3 : Potencia consumida (kWh) Tamaño de mineral molino mayor al deseado. Desgaste excesivo de liners de molino; por impacto directo de bolas y poca cantidad de mineral fresco. 6 Parrillas rotas muy tempranament e y nivel de descarga indeseado 5 8 4 Clasificaciòn de Mineral por Parrilas, Pulpdischarge y Trommel Descargar mineral conminuido en optimas condiciones (ni mas o menos tamaño). Salida Paso 4 : Toneladas de Descarga (tph) Atoramiento de mineral y bolas en las parrillas y cajones de descarga. 8 Parrillas y cajones de descarga atorados con mineral y bolas 8 4 600 Proceso Atrapamiento de mineral en la descarga del molino. 240 256 Control remoto de Molino SAG implementado en PI System. Control remoto de Molino SAG implementado en PI System. Plan de mantenimiento e inspeción frecuente. Controles actuales..existe alguna actividad de Mantenimiento que prevenga la causa de falla?? Parrilla atorada con bolas desgastadas (CHIPs) y/o mineral grueso. Atrapamiento de mineral en la descarga del molino. Atrapamiento de mineral en la descarga del molino. Rotura de liners y parada de planta anticipada. Numero de Prioridad de Riesgo RPN 48 Efecto Potencial del Modo de Falla Se hacen inspecciones programadas de acuerdo al tiempo de vida de los equipos (segùn recomendación del proveedor).
- 25. FMEA -‐ New risk priority C D M A I 6σ Paso del Proceso Acción Recomendada Responsable Fecha Compromiso de Ejecución Nueva Severidad G Nueva Frecuenci a F Nueva Detectabilida d D Nuevo RPN 1 Suministro de mineral fresco desde Chancado Se hacen mediciones de espesores y slot (tamaño de abertura) en las paradas programadas (metodo de escaneo laser o mediciòn directa). Equipo Monitore Condicones Cada parada menor programada 14-dic 01-abr 5 3 10 150 2 Recirculación (pebbles), y adiciòn de agua Minimizar la frecuencia de inspecciones de filtros Mantenimiento Procesos c/semanal 2 1 8 16 3 Adición de Bolas 5" (Potencia) y Giro de molino a velocidad RPM crítico Implementar control manual de velocidad critica del molino. Se hacen mediciones de espesores y slot (tamaño de abertura) en las paradas programadas (metodo de escaneo laser o mediciòn directa). Operadores de turno / Personal de Mantenimiento c/ hora / Cada parada de planta 5 2 5 50 4 Clasificaciòn de Mineral por Parrilas, Pulpdischarge y Trommel Analizar nuevos diseños de parrillas y cajones de descarga Ing. Mantenimiento 05-ene-14 2 5 2 20 Proceso ResultadosAcciones 11-dic-13 15-ene-14 Acción tomada en Fecha 13-dic-13
- 26. Ishikawa Analysis C D M A I 6σ Problema : - La carga de mineral fresco es menor a 5,250 t/h Frecuencia mediciones largos Persona Sistema monitoreo PI System mal configurado Peso excesivo del molino Restricción para mineral fresco por potencia del molino Tamaño demineral ingreso (F80) mayor a 180mm Material Chancado ineficiente Ambiente Mala proyección de geología Método Restricción en la descarga Máquinas Atoramiento de mineral y bolas en parrilla Recirculación excesiva Directores y cajones de dscarga demasiado largos Demasiada diferencia en mediciones de turnos Mediciones Operadores hacen control de peso con diferentes unidades Pesometro a la salida del molino con indicacion erronea Falta de calibración del sensor Falta de configuración e instalación de Servidor PI El seting (luz) del Chancadora mal configurada Estudio de factibilidad errado Piezas del molino metalicos Mal diseño de directores y cajones de descarga No hay programa de calibración de sensores Operador no capacitado Slot de parrilla muy pequeña La dureza mineral es mayor a 15
- 27. Measurement plan C D M A I 6σ Métrica X or Y Definicion Operativa Tipo de Dato (discreto o continuo) Fuente de los Datos Tamaño de Muestra Responsable Fecha Cómo Cómo voy a usar y mostrar la data ( Grafico o Herramienta Estadistica) MSA o Gage R&R C: Cantidad de agua x1 Dosificaciónde agua para generar la homogeneidad de materialentodo elcircuito de molienda. Continua Sistema de Control (PAS) Medidiónpromedio por turno (anual) Operaciones 15-ene-14 Revisiónde valores medidos por elPAS Agregaremos valores totoales promedio por cada turno de las x's e y's MSA Cr: Densidad de mineral(% de solidos) x2 Distribuciònde mineral, en proporcióna los materiales adicionales como bolas, caly agua. Continua Sistema de Control (PAS) Medidiónpromedio por turno (anual) Operaciones 15-ene-14 Revisiónde valores medidos por elPAS Agregaremos valores totoales promedio por cada turno de las x's e y's MSA Cr: Potencia consumida (kWh) x3 Energía necesaria para la funciónde molienda optima. Indirectamente es la cantidad de bolas. Continua Sistema de Control (PAS) Medidiónpromedio por turno (anual) Operaciones 15-ene-14 Revisiónde valores medidos por elPAS Agregaremos valores totoales promedio por cada turno de las x's e y's MSA C. Velocidad de Molino (rpm) x4 Velocidad crítica de molienda para generar elriñonde molienda Continua Sistema de Control (PAS) Medidiónpromedio por turno (anual) Operaciones 15-ene-14 Revisiónde valores medidos por elPAS Agregaremos valores totoales promedio por cada turno de las x's e y's MSA C: Slot de Parrilla x5 Area de evacuación necesaria para optimizar la cantridad de mineral conminuido Discreto Ingeniería Medidiónpromedio por campañas (parada de planta) / semestraly/o trimestral Ingeniería 01-abr-14 Estudio elementos discretos yfinitos Agregaremos valores totoales promedio por cada turno de las x's e y's MSA Salida Paso 1 : Toneladas Frescas Procesadas (tph) y1 Mineralprocesado fresco que viene de la chancadora. Discreto Ingeniería Medidiónpromedio por turno (anual) Ingeniería 15-ene-14 Revisiónde valores medidos por elPAS Agregaremos valores totoales promedio por cada turno de las x's e y's MSA y2: Salida Paso 2 : Densidad de mineral(% de solidos) y2 Grado de molienda ideal. Continua Sistema de Control (PAS) Medidiónpromedio por turno (anual) Operaciones 15-ene-14 Revisiónde valores medidos por elPAS Agregaremos valores totoales promedio por cada turno de las x's e y's MSA Salida Paso 3 : Potencia consumida (kWh) y3 Energía necesaria para la funciónde molienda optima. Continua Sistema de Control (PAS) Medidiónpromedio por turno (anual) Operaciones 15-ene-14 Revisiónde valores medidos por elPAS Agregaremos valores totoales promedio por cada turno de las x's e y's MSA Salida Paso 4 : Toneladas de Descarga (tph) y4 Mineralprocesado junto a agua, cal, chips; que por balance de masas es el mismo "mineral" alde ingreso (carga fresca). Continua Sistema de Control (PAS) Medidiónpromedio por turno (anual) Operaciones 15-ene-14 Revisiónde valores medidos por elPAS Agregaremos valores totoales promedio por cada turno de las x's e y's MSA