WORLDWIDE GLACIER MONITORING AS PART OF POLICY-RELATED CLIMATE OBSERVATION
•
0 likes•610 views

Recommended

Recommended
More Related Content
What's hot
What's hot (18)
Viewers also liked
Similar to WORLDWIDE GLACIER MONITORING AS PART OF POLICY-RELATED CLIMATE OBSERVATION
Similar to WORLDWIDE GLACIER MONITORING AS PART OF POLICY-RELATED CLIMATE OBSERVATION (20)
More from InfoAndina CONDESAN
More from InfoAndina CONDESAN (20)
WORLDWIDE GLACIER MONITORING AS PART OF POLICY-RELATED CLIMATE OBSERVATION
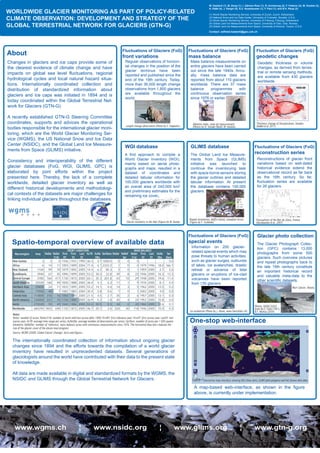
- 1. www.wgms.ch ¦ www.nsidc.org ¦ www.glims.org ¦ www.gtn-g.org Interactive map interface showing WGI (blue dots), GLIMS (pink polygons) and FoG (brown dots) data A map-based web-interface, as shown in the figure above, is currently under implementation. One-stop web-interface The internationally coordinated collection of information about ongoing glacier changes since 1894 and the efforts towards the compilation of a world glacier inventory have resulted in unprecedented datasets. Several generations of glaciologists around the world have contributed with their data to the present state of knowledge. All data are made available in digital and standardized formats by the WGMS, the NSIDC and GLIMS through the Global Terrestrial Network for Glaciers. Macroregion Area FRONT VARIATION MASS BALANCE NoSer NoSer 21th First RY First SY Last SY AvTR AvNo Obs SerDens NoSer NoRef Ser NoSer 21st First SY Last SY AvNo Obs Ser Dens New Guinea 3 3 0 1936 1941 1990 46.3 4.7 1000.0 0 0 0 0.0 Africa 6 14 11 1893 1899 2004 71.4 6.1 2333.3 1 0 0 1979 1996 18.0 166.7 New Zealand 1160 99 70 1879 1892 2005 14.4 6.2 85.3 3 0 1 1959 2005 2.7 2.6 Scandinavia 2940 67 45 1896 1899 2005 53.2 30.2 22.8 39 8 23 1946 2005 16.3 13.3 Central Europe 3785 764 417 1730 1815 2005 65.1 35.3 201.8 43 10 29 1948 2005 19.6 11.4 South America 25500 160 49 1830 1888 2005 36.4 4.1 6.3 11 1 9 1976 2005 8.1 0.4 Northern Asia 59600 24 11 1833 1895 2005 55.2 14.1 0.4 14 3 5 1962 2005 13.5 0.2 Antarctica 77000 48 7 1882 1883 2004 30.4 2.8 0.6 1 0 1 2002 2005 4.0 0.0 Central Asia 114800 310 16 1850 1893 2005 21.5 4.5 2.7 35 2 6 1957 2005 13.1 0.3 North America 124000 221 15 1720 1885 2005 36.9 5.2 1.8 45 4 24 1953 2005 15.8 0.4 Arctic 275500 93 49 1840 1886 2005 52.4 30.5 0.3 34 2 20 1960 2005 12.6 0.1 Worldwide 684294 1803 690 1720 1815 2005 46.7 20.1 2.6 226 30 118 1946 2005 15.0 0.3 Notes: NoSer: number of series; NoSer21th: number of series with last survey after 1999; FirstRY: first reference year; FirstSY: first survey year; LastSY: last survey year; AvTR: average time range per series; AvNoObs: average number of observations per series; SerDens: number of series per 1 000 square kilometre; NoRefSer: number of ‘reference’ mass balance series with continuous measurements since 1976. The horizontal blue bars indicate the Source: WGMS (2008): Global Glacier Changes: facts and figures. size of the glacier cover of the eleven macroregions. Spatio-temporal overview of available data Photos: NSIDC/USGS from W.O. Field (1941), B.F. Molnia (2004). Muir Glacier, Alaska. The Glacier Photograph Collec- tion (GPC) contains 13,000 photographs from some 500 glaciers. Such overview pictures and repeat photographs back to the late 19th century constitute an important historical record and valuable meta-data to the other scientific datasets. Glacier photo collection Repeat inventories, Baffin Island, Canadian Arctic (Figure by F. Svoboda). The Global Land Ice Measure- ments from Space (GLIMS) initiative was launched to continue the inventorying task with space-borne sensors storing the glacier outlines and detailed tabular information. At present the database contains 100,000 glaciers. GLIMS database Glacier inventory in the Alps (Figure by M. Zemp). A first approach to compile a World Glacier Inventory (WGI), mainly based on aerial photo- graphs and maps, resulted in a dataset of coordinates and detailed tabular information for 100,000 glaciers worldwide with an overall area of 240,000 km2 and preliminary estimates for the remaining ice cover. WGI database Ice avalanche (Photo by J. Alean, www.SwissEduc.ch). Information on 200 glacier- related special events which may pose threats to human activities, such as glacier surges, outbursts of lakes, ice avalanches, drastic retreat or advance of tidal glaciers or eruptions of ice-clad volcanoes have been reported from 130 glaciers. Fluctuations of Glaciers (FoG) special events Ablation stake, snow pit measurement (Photos by D. Vonder Mühll, M. Hoelzle). Mass balance measurements on entire glaciers have been carried out since the late 1940s. Annu- ally, mass balance data are reported from about 110 glaciers worldwide. There are 37 mass balance programmes with continuous observation series since 1976 or earlier. Fluctuations of Glaciers (FoG) mass balance Length change observation (Photo by S. Kappeler). Regular observations of horizon- tal changes in the position of the glacier terminus have been reported and published since the end of the 19th century. Today, more than 36,000 length change observations from 1,800 glaciers are available throughout the world. Fluctuations of Glaciers (FoG) front variations Changes in glaciers and ice caps provide some of the clearest evidence of climate change and have impacts on global sea level fluctuations, regional hydrological cycles and local natural hazard situa- tions. Internationally coordinated collection and distribution of standardized information about glaciers and ice caps was initiated in 1894 and is today coordinated within the Global Terrestrial Net- work for Glaciers (GTN-G). A recently established GTN-G Steering Committee coordinates, supports and advices the operational bodies responsible for the international glacier moni- toring, which are the World Glacier Monitoring Ser- vice (WGMS), the US National Snow and Ice Data Center (NSIDC), and the Global Land Ice Measure- ments from Space (GLIMS) initiative. Consistency and interoperability of the different glacier databases (FoG, WGI, GLIMS, GPC) is elaborated by joint efforts within the project presented here. Thereby, the lack of a complete worldwide, detailed glacier inventory as well as different historical developments and methodologi- cal contexts of the datasets are major challenges for linking individual glaciers throughout the databases. About WORLDWIDE GLACIER MONITORING AS PART OF POLICY-RELATED CLIMATE OBSERVATION: DEVELOPMENT AND STRATEGY OF THE GLOBAL TERRESTRIAL NETWORK FOR GLACIERS (GTN-G) W. Haeberli (1), M. Zemp (1), I. Gärtner-Roer (1), R. Armstrong (2), F. Fetterer (2), M. Hoelzle (3), A. Kääb (4), J. Kargel (5), S.U. Nussbaumer (1), F. Paul (1), and B.H. Raup (2) (1) World Glacier Monitoring Service, University of Zurich, Zurich, Switzerland (2) National Snow and Ice Data Center, University of Colorado, Boulder, U.S.A. (3) World Glacier Monitoring Service, University of Fribourg, Fribourg, Switzerland (4) Global Land Ice Measurements from Space, University of Oslo, Oslo, Norway (5) Global Land Ice Measurements from Space, University of Arizona, Tucson, U.S.A. Contact: wilfried.haeberli@geo.uzh.ch Fluctuations of the Mer de Glace, France. (Nussbaumer et al., 2007). Reconstructions of glacier front variations based on well-dated historical evidence extend the observational record as far back as the 16th century. So far, fluctuation series are available for 26 glaciers. Fluctuations of Glaciers (FoG) reconstruction series Geodetic thickness or volume changes, as derived from terres- trial or remote sensing methods, are available from 430 glaciers worldwide. Fluctuation of Glaciers (FoG) geodetic changes Thickness change of Storglaciären, Sweden. (Koblet et al. 2011).