Large mass movements related to deglaciation effects in Southern Peru
•
0 likes•864 views

Recommended

Recommended
More Related Content
Similar to Large mass movements related to deglaciation effects in Southern Peru
Similar to Large mass movements related to deglaciation effects in Southern Peru (20)
More from InfoAndina CONDESAN
More from InfoAndina CONDESAN (20)
Large mass movements related to deglaciation effects in Southern Peru
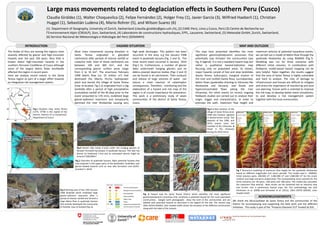
- 1. The Andes of Peru are among the regions most severely affected by glacier and high-mountain hazards over the past 100 years. Very little is known about high-mountain hazards in the southern Peruvian Cordilleras of Cusco although some of the largest debris flows worldwide affected this region in recent years. Here we analyze recent events in the Santa Teresa region as part of a larger effort towards an integrative risk management system. Claudia Giráldez (1), Walter Choquevilca (2), Felipe Fernández (2), Holger Frey (1), Javier García (3), Wilfried Haeberli (1), Christian Huggel (1), Sebastián Ludena (4), Mario Rohrer (5), and Wilson Suarez (6) Large mass movements related to deglaciation effects in Southern Peru (Cusco) (1) Department of Geography, University of Zurich, Switzerland (claudia.giraldez@geo.uzh.ch), (2) CARE-Perú, Lima y Cusco, Perú (3) Centre de Recherche sur l’Environnement Alpin (CREALP), Sion, Switzerland, (4) Laboratoire de constructions hydrauliques, EPFL, Lausanne, Switzerland, (5) Meteodat GmbH, Zurich, Switzerland, (6) Servicio Nacional de Meteorología e Hidrología del Perú (SENAMHI) INTRODUCTION Most mass movements causing disasters in Santa Teresa originated in glaciated catchments after periods of intense rainfall or snow/ice melt. Sizes of these catchments are between 100 and 300 km2, and the corresponding glacier surface areas range from 6 to 16 km2. The enormous February 1998 debris flow (ca. 25 million m3) that destroyed the Machu Picchu hydropower plant and buried the village of Santa Teresa (now re-located, Fig.5 a) originated from a big landslide after a period of high precipitation (cumulative rainfall of the 40 days prior to the event amounted to 170 mm), mobilized large glacial-sediment reservoirs and temporarily dammed the river Ahobamba causing very high peak discharges. This pattern has been recurrent in the area, e.g the January 1998 event in quebrada Sacsara (Fig. 2 and 3). The most recent event occurred in January 2010 (Fig.5 b). Furthermore, a number of glacier lakes underneath hanging glaciers and on debris-covered dead-ice bodies (Figs 2 and 4) can be found in all catchments. Their outburst and release of large volumes of water can induce a chain reaction of catastrophic consequences. Therefore, monitoring and the elaboration of a hazard and risk map of the region is of crucial importance for prevention. This work is a preliminary study of seven communities of the district of Santa Teresa, Cusco. HAZARD SITUATION MAP AND OUTLOOK The map here presented identifies the most significant geomorphodynamic processes that potentially may threaten the communities (see Fig. 6 legend). It is not a standard hazard map but rather a qualitative hazard-indication map focusing only on populated areas. As shown, major hazards consist of fast and slow landslides (Santa Teresa, Sullucuyoc), marginal erosion of the river and rockfall (Santa Rosa, Lucmabamba), debris flows (quebradas draining to Vilcanota like Ahobamba and Sacsara), and floods and hyperconcentrated flows (along the river Vilcanota). For other events on record, ongoing fieldwork studies are carried out to analyze their origin, trigger and characteristics. In order to estimate the path, maximum flow height and maximum velocity of potential hazardous events, we carried out a model of debris flow through the quebrada Ahobamba by using RAMMS (Fig.7). Modeling was run for three scenarios with different initial volumes. In combination with fieldwork, model-based hazard mapping can be very helpful. Taken together, the results suggest that the area of Santa Teresa is highly vulnerable and hard to analyze. The risks of damage to infrastructure and houses are difficult to mitigate and stress the importance of monitoring and land use planning. Future work is oriented to improve the risk map, to develop better event simulations, to and develop a risk management system together with the local communities. ACKNOWLEDGEMENTS Fig. 6 Hazard map for Santa Teresa District which identifies the most significant geomorphodynamic processes that constitute a potential hazard for the most populated communities. Google Earth photographs show the limit of the communities and are labeled with potential hazards as described in the legend on the left. The central map (30m ASTER GDEM2, color shaded relief) shows the situation of the different communities along with the label of the hazards Fig 7 Numerical modeling of maximum flow height for the quebrada Ahobamba based on different magnitudes and return periods. The model used is RAMMS. Initial volumes were, 200.000 m³, 1.000.000 m³ and 5.000.000 m³ for the small, medium and large scenarios respectively. The corresponding return periods for the three scenarios are ̴30 years, ̴100 years and ̴300 years. This model also calculates the maximum flow velocity . Both results can be combined into an intensity map and further into a preliminary hazard map. For this methodology see also Hürlimann et al. (2008) and Schneider et al. (2012). (30m ASTER GDEM2, color shaded relief) We thank the Municipalidad de Santa Teresa and the communities of the District for accompanying and supporting the field work and the different initiatives. This study is part of the “Proyecto Glaciares 513” funded by SDC. Fig.1 Situation map. Santa Teresa (13⁰S; 72⁰W) is the capital of the District, Povince of La Convención, Department of Cusco. Fig.4 Glacier lake Hanpi K´ocha under the hanging glaciers of Nevado Pumasillo-Sacsarayoc in quebrada Sacsara. This lake has almost no freeboard ( ̴5m) and its estimated volume might be around 4.300.000m³. Fig.2 Overview of quebrada Sacsara. Main potential hazards that may originate in the upper parts of the quebradas: landslides, and glacier-related hazards such as new lake formation and GLOFs. (Landsat 5, 2010) Fig.3 Starting zone of the 13th January 1998 landslide which mobilized large glacier-sediment reservoirs after a period of intense rainfall and formed a large debris flow in quebrada Sacsara that entirely destroyed the community of Yanatile, now re-located (Fig. 6). Fig.5 a New location of the village of Santa Teresa since 1998 (old location signaled in dotted brown circle). The deposits of the 1998, and 2010, events cover the riverbed of Río Vilcanota. b Flood in Río Vilcanota during the 2010 event. Photo by C. Giráldez Photo by C. Giráldez Photo by C. Giráldez Photo by CARE a b