http://www.indianotes.com/Financial-Results/Paushak-Q4FY15-Recommends-a-dividend-of-30-Maintain-buy/194784/16610021.00/C
•
0 likes•144 views

Paushak Ltd earns INR38m in net on net sales of INR212.4m in Q4FY15; 'Buy'

Recommended
More Related Content
Viewers also liked
More from IndiaNotes.com
More from IndiaNotes.com (20)
Recently uploaded
Recently uploaded (20)
http://www.indianotes.com/Financial-Results/Paushak-Q4FY15-Recommends-a-dividend-of-30-Maintain-buy/194784/16610021.00/C
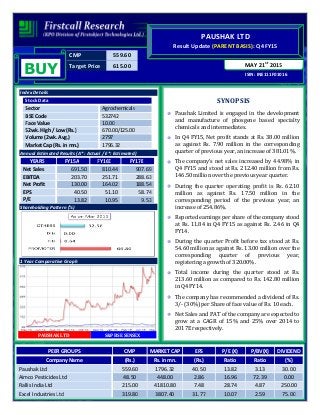
- 1. CMP 559.60 Target Price 615.00 ISIN: INE111F01016 MAY 21st 2015 PAUSHAK LTD Result Update (PARENT BASIS): Q4 FY15 BUY Index Details Stock Data Sector Agrochemicals BSE Code 532742 Face Value 10.00 52wk. High / Low (Rs.) 670.00/125.00 Volume (2wk. Avg.) 2797 Market Cap (Rs. in mn.) 1796.32 Annual Estimated Results (A*: Actual / E*: Estimated) YEARS FY15A FY16E FY17E Net Sales 691.50 810.44 907.69 EBITDA 203.70 251.71 288.63 Net Profit 130.00 164.02 188.54 EPS 40.50 51.10 58.74 P/E 13.82 10.95 9.53 Shareholding Pattern (%) 1 Year Comparative Graph PAUSHAK LTD S&P BSE SENSEX SYNOPSIS Paushak Limited is engaged in the development and manufacture of phosgene based specialty chemicals and intermediates. In Q4 FY15, Net profit stands at Rs. 38.00 million as against Rs. 7.90 million in the corresponding quarter of previous year, an increase of 381.01%. The company’s net sales increased by 44.98% in Q4 FY15 and stood at Rs. 212.40 million from Rs. 146.50 million over the previous year quarter. During the quarter operating profit is Rs. 62.10 million as against Rs. 17.50 million in the corresponding period of the previous year, an increase of 254.86%. Reported earnings per share of the company stood at Rs. 11.84 in Q4 FY15 as against Rs. 2.46 in Q4 FY14. During the quarter Profit before tax stood at Rs. 54.60 million as against Rs. 13.00 million over the corresponding quarter of previous year, registering a growth of 320.00%. Total income during the quarter stood at Rs. 213.60 million as compared to Rs. 142.80 million in Q4 FY14. The company has recommended a dividend of Rs. 3/- (30%) per Share of face value of Rs. 10 each. Net Sales and PAT of the company are expected to grow at a CAGR of 15% and 25% over 2014 to 2017E respectively. PEER GROUPS CMP MARKET CAP EPS P/E (X) P/BV(X) DIVIDEND Company Name (Rs.) Rs. in mn. (Rs.) Ratio Ratio (%) Paushak Ltd 559.60 1796.32 40.50 13.82 3.13 30.00 Aimco Pesticides Ltd 48.50 448.00 2.86 16.96 72.39 0.00 Rallis India Ltd 215.00 41810.80 7.48 28.74 4.87 250.00 Excel Industries Ltd 319.80 3807.40 31.77 10.07 2.59 75.00
- 2. QUARTERLY HIGHLIGHTS (PARENT BASIS) Results Updates- Q4 FY15 Paushak Limited is engaged in the development and manufacture of phosgene based specialty chemicals and intermediates, reported its financial results for the quarter ended 31st Mar, 2015. The company’s net profit increased by 381.01% and stood at Rs. 38.00 million against Rs. 7.90 million in the corresponding quarter ending of previous year. Revenue for the quarter increased by 44.98% to Rs. 212.40 million from Rs. 146.50 million, when compared with the prior year period. Reported earnings per share of the company stood at Rs. 11.84 a share during the quarter as against Rs. 2.46 over previous year period. Profit before interest, depreciation and tax is Rs. 62.10 million as against Rs. 17.50 million in the corresponding period of the previous year. Break up of Expenditure Months Mar-15 Mar-14 % Change Net Sales 212.40 146.50 44.98 PAT 38.00 7.90 381.01 EPS 11.84 2.46 381.01 EBITDA 62.10 17.50 254.86 Break up of Expenditure (Rs in millions) Q4 FY15 Q4 FY14 % CHNG Consumption of Raw Materials 68.40 39.10 75% Employees Cost 19.20 15.40 25% Depreciation 5.30 4.40 20% Research & Development Expenses 3.50 2.10 67% Manufacturing Expenses 23.90 11.70 104% Other Expenses 26.70 32.20 -17%
- 3. COMPANY PROFILE Paushak Limited is engaged in the development and manufacture of phosgene based specialty chemicals and intermediates in India. Paushak is part of the Alembic group of companies. Alembic Ltd is the oldest pharmaceutical company in India founded in 1907. Its products include isocyanates, cholroformates, carbamoyl chlorides, and others. The company also exports its products. Paushak's core competencies are in the development and manufacturing of phosgene based speciality chemicals and intermediates. The company uses innovative process engineering to achieve a low cost and yet achieve global quality and regulatory standards The company offers unique capabilities in development and commercialization of phosgene based products. It accepts challenging product development requests on a routine basis. Laboratory facilities are specifically designed and equipped for safely conducting the Phosgenation and related reactions. Products • Isocyanates • Cholroformates • Carbamoyl chlorides • Other Products
- 4. FINANCIAL HIGHLIGHT (PARENT BASIS) (A*- Actual, E* -Estimations & Rs. In Millions) Balance Sheet as at March 31, 2014 -2017E FY14A FY15A FY16E FY17E SOURCES OF FUNDS Shareholder's Funds Share Capital 32.10 32.10 32.10 32.10 Reserves and Surplus 424.66 541.90 674.67 823.09 1. Sub Total - Net worth 456.76 574.00 706.77 855.19 Non Current Liabilities Deferred Tax Liabilities 7.36 12.70 18.42 23.02 Other Long term Liabilities 2.50 2.50 2.60 2.68 Long term Provisions 1.54 2.40 3.17 3.77 2. Sub Total - Non Current Liabilities 11.40 17.60 24.18 29.47 Current Liabilities Short term Borrowings 0.14 2.50 3.50 4.55 Trade Payables 46.46 69.10 90.52 110.44 Other Current Liabilities 6.13 6.90 7.66 8.35 Short Term Provisions 17.37 15.30 13.77 12.67 3. Sub Total - Current Liabilities 70.10 93.80 115.45 136.00 Total Liabilities (1+2+3) 538.26 685.40 846.40 1020.66 APPLICATION OF FUNDS Non-Current Assets Fixed Assets Tangible assets 92.17 178.40 246.19 322.51 Capital Work in Progress 35.43 10.70 6.63 5.17 a) Sub Total - Fixed Assets 127.60 189.10 252.83 327.69 b) Non-current investments 91.77 113.80 134.28 155.77 1. Sub Total - Non Current Assets 219.37 302.90 387.11 483.46 Current Assets Current Investment 86.00 80.70 76.67 73.60 Inventories 76.13 70.50 66.27 62.96 Trade receivables 142.59 215.20 298.49 381.24 Cash and Bank Balances 2.40 3.20 3.94 4.64 Short-terms loans & advances 11.77 12.90 13.93 14.77 2. Sub Total - Current Assets 318.89 382.50 459.29 537.21 Total Assets (1+2) 538.26 685.40 846.40 1020.66
- 5. Annual Profit & Loss Statement for the period of 2014 to 2017E Value(Rs.in.mn) FY14A FY15A FY16E FY17E Description 12m 12m 12m 12m Net Sales 567.40 691.50 810.44 907.69 Other Income 12.70 25.20 27.22 29.94 Total Income 580.10 716.70 837.65 937.63 Expenditure -434.90 -513.00 -585.95 -649.00 Operating Profit 145.20 203.70 251.71 288.63 Interest -1.20 -0.40 -0.46 -0.27 Gross profit 144.00 203.30 251.24 288.36 Depreciation -17.80 -21.40 -23.75 -26.13 Exceptional items 0.00 -2.00 0.00 0.00 Profit Before Tax 126.20 179.90 227.49 262.23 Tax -38.00 -49.90 -63.47 -73.69 Net Profit 88.20 130.00 164.02 188.54 Equity capital 32.10 32.10 32.10 32.10 Reserves 424.70 541.90 674.67 823.09 Face value 10.00 10.00 10.00 10.00 EPS 27.48 40.50 51.10 58.74 Quarterly Profit & Loss Statement for the period of 30th Sep, 2014 to 30th Jun, 2015E Value(Rs.in.mn) 30-Sep-14 31-Dec-14 31-Mar-15 30-Jun-15E Description 3m 3m 3m 3m Net sales 162.10 178.40 212.40 216.65 Other income 22.40 1.10 1.20 0.26 Total Income 184.50 179.50 213.60 216.91 Expenditure -119.00 -132.10 -151.50 -152.09 Operating profit 65.50 47.40 62.10 64.82 Interest -0.20 0.00 -0.20 -0.15 Gross profit 65.30 47.40 61.90 64.67 Depreciation -4.80 -6.70 -5.30 -5.07 Exceptional Items 0.00 0.00 -2.00 0.00 Profit Before Tax 60.50 40.70 54.60 59.60 Tax -15.40 -10.30 -16.60 -17.40 Net Profit 45.10 30.40 38.00 42.20 Equity capital 32.10 32.10 32.10 32.10 Face value 10.00 10.00 10.00 10.00 EPS 14.05 9.47 11.84 13.15
- 6. Ratio Analysis Particulars FY14A FY15A FY16E FY17E EPS (Rs.) 27.48 40.50 51.10 58.74 EBITDA Margin (%) 25.59 29.46 31.06 31.80 PBT Margin (%) 22.24 26.02 28.07 28.89 PAT Margin (%) 15.54 18.80 20.24 20.77 P/E Ratio (x) 20.37 13.82 10.95 9.53 ROE (%) 19.31 22.65 23.21 22.05 ROCE (%) 35.67 39.05 38.78 36.61 Debt Equity Ratio 0.00 0.00 0.00 0.01 EV/EBITDA (x) 11.76 8.42 6.83 5.97 Book Value (Rs.) 142.31 178.82 220.18 266.41 P/BV 3.93 3.13 2.54 2.10 Charts
- 7. OUTLOOK AND CONCLUSION At the current market price of Rs. 559.60, the stock P/E ratio is at 10.95 x FY16E and 9.53 x FY17E respectively. Earnings per share (EPS) of the company for the earnings for FY16E and FY17E are seen at Rs. 51.10 and Rs. 58.74 respectively. Net Sales and PAT of the company are expected to grow at a CAGR of 15% and 25% over 2014 to 2017E respectively. On the basis of EV/EBITDA, the stock trades at 6.83 x for FY16E and 5.97 x for FY17E. Price to Book Value of the stock is expected to be at 2.54 x and 2.10 x respectively for FY16E and FY17E. We recommend ‘BUY’ in this particular scrip with a target price of Rs. 615.00 for Medium to Long term investment. INDUSTRY OVERVIEW Chemical industry is one of India’s oldest industries, contributing significantly towards the industrial and economic growth of the nation. The Indian Chemical Industry forms the backbone of the industrial and agricultural development of India and provides building blocks for several downstream industries. Basic chemicals and their related products form a very significant part of the Indian economy and account for about 3 per cent of India's GDP. Among the most diversified industrial sectors, it covers an array of more than 70,000 commercial products. The total investment in the Indian chemical industry is approximately US$ 60 bn and total employment generated was about 1 mn. In terms of volume, it is 12th largest in the world and 3rd largest in Asia. Exports of chemicals from India have increased significantly and account for about 14% of total exports and 9% of total imports of the country. The Indian chemical industry comprises both small and large-scale units. Fiscal concessions granted to the small sector in the mid-eighties led to the establishment of a large number of units in the Small Scale Industries (SSI) sector. The major sub segments of this industry include alkali, organic chemicals, inorganic chemicals, pesticides, dyes & dyestuffs and specialty chemicals. The Indian chemical industry deals in products like fertilizers, bromine compounds, catalyst, sodium and sodium compounds, dye intermediates, inks and resins, phosphorous, paint chemicals, coatings, isobutyl, zinc sulphate, zinc chloride, water treatment chemicals, organic surfactants, pigment dispersions, industrial aerosols and many more. The commodity chemicals are the largest segment in the chemical market. Some of the major markets for chemicals are North America, Western Europe, Japan and emerging economies in Asia and Latin America. The
- 8. Indian chemical industry is matured and is in the midst of a major restructuring and consolidation phase. Globalization has opened the doors for this sector to capture a major part of the global market pie. The sector has experienced many reforms in India and is expected to grow at 15% p.a. in the near future. The investment in R&D will also play a vital role in this sector. In a nutshell, the Indian chemical industry has a large potential to grow in domestic as well as in export markets. In the current market conditions, with an appreciating rupee, pricing will be a crucial factor while competing with other exporting countries. Disclaimer: This document is prepared by our research analysts and it does not constitute an offer or solicitation for the purchase or sale of any financial instrument or as an official confirmation of any transaction. The information contained herein is from publicly available data or other sources believed to be reliable but we do not represent that it is accurate or complete and it should not be relied on as such. Firstcall Research or any of its affiliates shall not be in any way responsible for any loss or damage that may arise to any person from any inadvertent error in the information contained in this report. Firstcall Research and/ or its affiliates and/or employees will not be liable for the recipients’ investment decision based on this document.
- 9. Firstcall India Equity Research: Email – info@firstobjectindia.com C.V.S.L.Kameswari Pharma & Diversified U. Janaki Rao Capital Goods B. Anil Kumar Auto, IT & FMCG M. Vinayak Rao Diversified G. Amarender Diversified Firstcall Research Provides Industry Research on all the Sectors and Equity Research on Major Companies forming part of Listed and Unlisted Segments For Further Details Contact: Tel.: 022-2527 2510/2527 6077 / 25276089 Telefax: 022-25276089 040-20000235 /20000233 E-mail: info@firstobjectindia.com www.firstcallresearch.com