Firstcall recommend Essel Propack, Q4FY15 net profit up 66.09% y/y to INR454.10m
•
0 likes•183 views


Recommended
Recommended
More Related Content
What's hot
What's hot (20)
Similar to Firstcall recommend Essel Propack, Q4FY15 net profit up 66.09% y/y to INR454.10m
Similar to Firstcall recommend Essel Propack, Q4FY15 net profit up 66.09% y/y to INR454.10m (20)
More from IndiaNotes.com
More from IndiaNotes.com (20)
Recently uploaded
Recently uploaded (20)
Firstcall recommend Essel Propack, Q4FY15 net profit up 66.09% y/y to INR454.10m
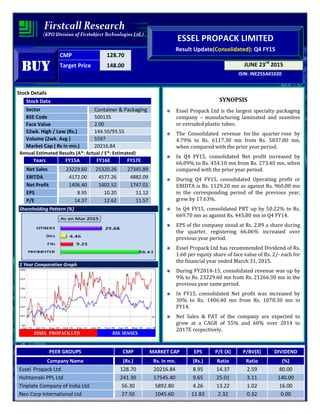
- 1. CMP 128.70 Target Price 148.00 ISIN: INE255A01020 JUNE 23rd 2015 ESSEL PROPACK LIMITED Result Update(Consolidated): Q4 FY15 BUYBUYBUYBUY Stock Details Stock Data Sector Container & Packaging BSE Code 500135 Face Value 2.00 52wk. High / Low (Rs.) 144.50/93.55 Volume (2wk. Avg ) 5597 Market Cap ( Rs in mn.) 20216.84 Annual Estimated Results (A*: Actual / E*: Estimated) Years FY15A FY16E FY17E Net Sales 23229.60 25320.26 27345.89 EBITDA 4172.00 4577.26 4882.09 Net Profit 1406.40 1602.52 1747.01 EPS 8.95 10.20 11.12 P/E 14.37 12.62 11.57 Shareholding Pattern (%) 1 Year Comparative Graph ESSEL PROPACK LTD BSE SENSEX SYNOPSIS Essel Propack Ltd is the largest specialty packaging company – manufacturing laminated and seamless or extruded plastic tubes. The Consolidated revenue for the quarter rose by 4.79% to Rs. 6117.30 mn from Rs. 5837.80 mn, when compared with the prior year period. In Q4 FY15, consolidated Net profit increased by 66.09% to Rs. 454.10 mn from Rs. 273.40 mn, when compared with the prior year period. During Q4 FY15, consolidated Operating profit or EBIDTA is Rs. 1129.20 mn as against Rs. 960.00 mn in the corresponding period of the previous year, grew by 17.63%. In Q4 FY15, consolidated PBT up by 50.22% to Rs. 669.70 mn as against Rs. 445.80 mn in Q4 FY14. EPS of the company stood at Rs. 2.89 a share during the quarter, registering 66.06% increased over previous year period. Essel Propack Ltd has recommended Dividend of Rs. 1.60 per equity share of face value of Rs. 2/- each for the financial year ended March 31, 2015. During FY2014-15, consolidated revenue was up by 9% to Rs. 23229.60 mn from Rs. 21266.30 mn in the previous year same period. In FY15, consolidated Net profit was increased by 30% to Rs. 1406.40 mn from Rs. 1078.30 mn in FY14. Net Sales & PAT of the company are expected to grow at a CAGR of 55% and 60% over 2014 to 2017E respectively. PEER GROUPS CMP MARKET CAP EPS P/E (X) P/BV(X) DIVIDEND Company Name (Rs.) Rs. in mn. (Rs.) Ratio Ratio (%) Essel Propack Ltd 128.70 20216.84 8.95 14.37 2.59 80.00 Huhtamaki PPL Ltd 241.30 17545.40 9.65 25.01 3.11 140.00 Tinplate Company of India Ltd 56.30 5892.80 4.26 13.22 1.02 16.00 Neo Corp International Ltd 27.50 1045.60 11.83 2.32 0.32 0.00
- 2. QUARTERLY HIGHLIGHTS (Consolidated) Results updates- Q4 FY15, Months Mar-15 Mar-14 % Change Net Sales 6117.30 5837.80 4.79 Net Profit 454.10 273.40 66.09 EPS 2.89 1.74 66.06 EBITDA 1129.20 960.00 17.63 The Consolidated revenue for the quarter rose by 4.79% to Rs. 6117.30 million from Rs. 5837.80 million, when compared with the prior year period. Net profit increased by 66.09% to Rs. 454.10 million from Rs. 273.40 million, when compared with the prior year period. Reported earnings per share of the company stood at Rs. 2.89 a share during the quarter, registering 66.06% increased over previous year period. Profit before interest, depreciation and tax is Rs. 1129.20 millions as against Rs. 960.00 millions in the corresponding period of the previous year. Break up of Expenditure Particulars Rs. Million Q4 FY15 Q4 FY14 % Change Cost of Material Consumed 3170.20 3673.00 -14% Employee Benefit Expenses 885.40 843.80 5% Depreciation & Amortization 306.00 316.40 -3% Other Expenditure 1084.80 1135.90 -4%
- 3. Segment Revenue Latest updates • Essel Propack Ltd has recommended Dividend of Rs. 1.60 per equity share of face value of Rs. 2/- each for the financial year ended March 31, 2015. Company Profile Essel Propack Ltd, part of the Essel Group, with turnover of over USD 360 million, is the largest specialty packaging global company, manufacturing laminated plastic tubes catering to the FMCG and Pharma space. Employing over 2800 people representing 25 different nationalities, Essel Propack functions through 24 state of the art facilities in 11 countries, selling more than 6.5 billion tubes and continuing to grow every year. Holding Oral Care market share of 33% in volume terms globally, Essel Propack is the world’s largest manufacturer with units operating across countries such as USA, Mexico, Colombia, Poland, Germany, Egypt, Russia, China, Philippines, Indonesia and India. These facilities cater to diverse FMCG and Pharma brands that include cosmetics, personal care, pharmaceutical, food and oral care, offering customized solutions through continuously pioneering first-in-class innovations in materials, technology and processes. The Essel Group has business interests in technology, interactive, media, entertainment, social services and packaging sectors. The Group owns brands like Dish TV, Zee Entertainment Enterprise, DNA and Asian Sky Shop.
- 4. Financial Highlight (Consolidated) (A*- Actual, E* -Estimations & Rs. In Million) Balance Sheet as at March 31, 2014 -2017E FY14A FY15A FY16E FY17E EQUITY AND LIABILITIES: Shareholders’ Funds: Share Capital 314.13 314.17 314.17 314.17 Reserves and Surplus 6744.38 7515.50 8627.53 9749.11 A. Sub Total - Net worth 7058.51 7829.67 8941.70 10063.28 B. Minority Interest 75.51 80.75 84.79 89.87 Non-Current Liabilities: a) Long-term borrowings 6449.03 6434.27 6112.56 5868.05 b) Deferred Tax Liabilities [Net] 325.17 313.08 303.69 291.54 c) Other Long Term Liabilities 1.40 11.72 12.42 12.92 d) Long Term Provisions 113.33 132.71 151.29 166.42 C. Sub Total - Non-Current Liabilities 6888.93 6891.78 6579.95 6338.93 Current Liabilities: a) Short-term borrowings 1678.51 1414.14 1244.44 1120.00 b) Trade Payables 1829.92 1611.21 1836.78 1983.72 c) Other Current Liabilities 3312.46 2946.18 3093.48 3217.22 d) Short Term Provisions 363.16 501.50 591.77 674.62 D. Sub Total-Current Liabilities 7184.05 6473.03 6766.48 6995.56 Total Liabilities (A+B+C+D) 21207.00 21275.22 22372.92 23487.65 Non-Current Assets Fixed Assets i. Tangible assets 8801.40 8703.84 8941.56 9272.71 ii. Intangible Assets 180.10 168.49 175.23 183.99 iii. Capital work-in-progress 330.53 843.44 995.26 1144.55 iv. Intangible Asset under Development 24.73 44.20 53.92 62.55 a) Sub Total-Fixed Assets 9336.75 9759.96 10165.97 10663.80 b) Deferred tax assets 280.72 175.76 133.58 118.88 c) Non Current Investments 454.39 457.52 480.40 499.61 d) Long Term Loans and Advances 595.65 565.94 599.90 629.89 e) Other non-current assets 89.23 85.50 92.34 96.96 E. Sub Total - Non-Current Assets 10756.74 11044.68 11472.18 12009.14 Current Assets: a) Inventories 2248.96 2317.57 2502.98 2653.15 b) Trade Receivables 3675.07 3757.55 3983.00 4182.15 c) Cash and Bank Balances 1416.00 1164.14 1257.27 1345.28 d) Short Term Loans and Advances 2760.50 2782.85 2921.99 3038.87 e) Other Current Assets 349.73 208.43 235.50 259.05 F. Sub Total-Current Assets 10450.26 10230.54 10900.74 11478.51 Total Assets (E+F) 21207.00 21275.22 22372.92 23487.65
- 5. Annual Profit & Loss Statement for the period of 2014 to 2017E Value(Rs.in.mn) FY14A FY15A FY16E FY17E Description 12m 12m 12m 12m Net Sales 21266.30 23229.60 25320.26 27345.89 Other Income 223.80 209.60 222.18 233.28 Total Income 21490.10 23439.20 25542.44 27579.17 Expenditure -17721.20 -19267.20 -20965.18 -22697.08 Operating Profit 3768.90 4172.00 4577.26 4882.09 Interest -817.60 -848.40 -890.82 -926.45 Gross profit 2951.30 3323.60 3686.44 3955.63 Depreciation -1257.60 -1317.90 -1396.97 -1466.82 Exceptional Items -7.70 55.20 0.00 0.00 Profit Before Tax 1686.00 2060.90 2289.47 2488.81 Tax -569.10 -610.50 -637.62 -696.87 Profit After Tax 1116.90 1450.40 1651.85 1791.94 Minority Interest -38.60 -47.20 -42.48 -37.81 Share of P&L of Asso 0.00 3.20 -6.85 -7.12 Net Profit 1078.30 1406.40 1602.52 1747.01 Equity capital 314.13 314.17 314.17 314.17 Reserves 6730.70 7502.20 8627.53 9749.11 Face value 2.00 2.00 2.00 2.00 EPS 6.87 8.95 10.20 11.12 Quarterly Profit & Loss Statement for the period of 30th Sep, 2014 to 30th June, 2015E Value(Rs.in.mn) 30-Sep-14 31-Dec-14 31-Mar-15 30-Jun-15E Description 3m 3m 3m 3m Net Sales 5951.50 5673.90 6117.30 5994.95 Other income 45.00 45.20 67.10 60.39 Total Income 5996.50 5719.10 6184.40 6055.34 Expenditure -4882.70 -4753.90 -5055.20 -4963.82 Operating profit 1113.80 965.20 1129.20 1091.52 Interest -212.40 -223.30 -208.70 -200.35 Gross profit 901.40 741.90 920.50 891.17 Depreciation -342.40 -339.30 -306.00 -318.24 Exceptional Items 0.00 0.00 55.20 0.00 Profit Before Tax 559.00 402.60 669.70 572.93 Tax -170.90 -90.40 -194.80 -163.29 Profit After Tax 388.10 312.20 474.90 409.65 Minority Interest -10.20 -11.30 -15.40 -14.01 Share of P& L of Asso 6.70 3.10 -5.40 -4.86 Net Profit 384.60 304.00 454.10 390.77 Equity capital 314.13 314.13 314.17 314.17 Face value 2.00 2.00 2.00 2.00 EPS 2.45 1.94 2.89 2.49
- 6. Ratio Analysis Particulars FY14A FY15A FY16E FY17E EPS (Rs.) 6.87 8.95 10.20 11.12 EBITDA Margin (%) 17.72% 17.96% 18.08% 17.85% PBT Margin (%) 7.93% 8.87% 9.04% 9.10% PAT Margin (%) 5.25% 6.24% 6.52% 6.55% P/E Ratio (x) 18.74 14.37 12.62 11.57 ROE (%) 15.85% 18.56% 18.47% 17.81% ROCE (%) 33.13% 35.05% 36.65% 37.23% Debt Equity Ratio 1.15 1.00 0.82 0.69 EV/EBITDA (x) 7.14 6.45 5.75 5.30 Book Value (Rs.) 44.86 49.76 56.92 64.06 P/BV 2.87 2.59 2.26 2.01 Charts
- 7. Outlook and Conclusion At the current market price of Rs.128.70, the stock P/E ratio is at 12.62 x FY16E and 11.57 x FY17E respectively. Earning per share (EPS) of the company for the earnings for FY16E and FY17E is seen at Rs. 10.20 and Rs. 11.12 respectively. Net Sales and PAT of the company are expected to grow at a CAGR of 55% and 60% over 2014 to 2017E respectively. On the basis of EV/EBITDA, the stock trades at 5.75 x for FY16E and 5.30 x for FY17E. Price to Book Value of the stock is expected to be at 2.26 x and 2.01 x for FY16E and FY17E respectively. We recommend ‘BUY’ in this particular scrip with a target price of Rs.148.00 for Medium to Long term investment.
- 8. Industry Overview Essel Propack Ltd is a global leader in laminated tubes. Tubes are eminently suited for packing viscous products such as pastes, gels and creams. Like any packaging material, they protect the product from elements and preserve freshness, flavor and fragrance. As a packaging form they additionally offer superior value proposition in terms of ease of dispensing the product, hygienic storage in a multiple usage situation and excellent brand visibility on the retail shelf. Essel Propack pioneered laminated tubes in India. Over the last 33 years, the Company has transformed into a leading global player in laminated tubes, selling over 6.5 billion tubes and having manufacturing presence in eleven countries through subsidiaries, Joint Venture and Associate. Its supplies reach many more countries through export of tubes, either directly by the Company or by the customers after filling in their product. In this sense, Company’s tubes touch the lives of billions of consumers in countries across the world. One in every three of the laminated tubes supplied across the world today for oral care application is manufactured by Essel Propack Ltd. The world market for tubes is huge, about 36 billion in the markets the Company operates. Of this, oral care tubes account for 14 billion, Beauty & Cosmetics account for 12 billion and Pharma, Health & others account for 10 billion. Tubes for Beauty & Cosmetics applications are pre-dominantly extruded Plastic tubes, and those for Pharma are pre-dominantly Aluminium tubes. Beauty & Cosmetics as a category is largest in Europe, USA and Japan. This category is witnessing introduction of several new products such as Anti-ageing creams, Beauty Balms, Complexion creams, Hair Colorants etc. Even the existing product range is getting re-launched with more efficacious formulations. The industry is looking for packaging which can resonate the product’s functionality in terms of look and feel, can provide barrier for long term efficacy and freshness, and reduce carbon footprint. In the case of pharmaceuticals, use of aluminium tubes for packaging is going out of favour for reasons of concerns on product safety. Essel Propack over the years has perfected laminate structures that are efficacious for various pharma actives. Coupled with innovation in tamper evidence, anti counterfeit and dispensing technologies, the Company is now able to offer comprehensive packaging solution to Pharma, both OTC and prescription drugs. This is seeing traction in emerging markets like India and Egypt. India is growing as a large pharma tube manufacturing hub for both local and multinational brands. This experience is capable of replicating at other Units. The use of tubes is now seen to extend to other categories such as Foods and Home care, for a range of products such as condensed milk, Wasabi sauce, cheese spread, glue / adhesives etc. Besides, a number of products
- 9. hitherto packed in other packaging forms such as bottles and jars find tubes more attractive and value enhancing for their brands. Essel Propack therefore sees a huge market in the non oralcare category where it can deploy its new generation laminated tubes and continue to grow in the years to come. Disclaimer: This document is prepared by our research analysts and it does not constitute an offer or solicitation for the purchase or sale of any financial instrument or as an official confirmation of any transaction. The information contained herein is from publicly available data or other sources believed to be reliable but we do not represent that it is accurate or complete and it should not be relied on as such. Firstcall Research or any of its affiliates shall not be in any way responsible for any loss or damage that may arise to any person from any inadvertent error in the information contained in this report. Firstcall Research and/ or its affiliates and/or employees will not be liable for the recipients’ investment decision based on this document.
- 10. Firstcall India Equity Research: Email – info@firstobjectindia.com C.V.S.L.Kameswari Pharma & Diversified U. Janaki Rao Capital Goods B. Anil Kumar Auto, IT & FMCG M. Vinayak Rao Diversified G. Amarender Diversified Firstcall Research Provides Industry Research on all the Sectors and Equity Research on Major Companies forming part of Listed and Unlisted Segments For Further Details Contact: Tel.: 022-2527 2510/2527 6077 / 25276089 Telefax: 022-25276089 040-20000235 /20000233 E-mail: info@firstobjectindia.com www.firstcallresearch.com