ACC Q1FY15: Earnings mildly below expectation; outlook remains strong
•
1 like•222 views

ACC reported earnings for Q2CY14 that were below expectations due to higher-than-expected costs. Volumes grew nearly 4% year-over-year but costs increased more than expected, leading to an 11% decline in EBITDA per tonne. However, the analyst maintains a "BUY" rating based on strong demand outlook for ACC's key regions in southern and western India and potential for improved operations from recent plant modernizations. The stock trades at a lower valuation than peers and is seen as benefiting from rising Indian cement demand.

Recommended
More Related Content
What's hot
What's hot (18)
Viewers also liked
Similar to ACC Q1FY15: Earnings mildly below expectation; outlook remains strong
Similar to ACC Q1FY15: Earnings mildly below expectation; outlook remains strong (20)
More from IndiaNotes.com
More from IndiaNotes.com (20)
Recently uploaded
Recently uploaded (20)
ACC Q1FY15: Earnings mildly below expectation; outlook remains strong
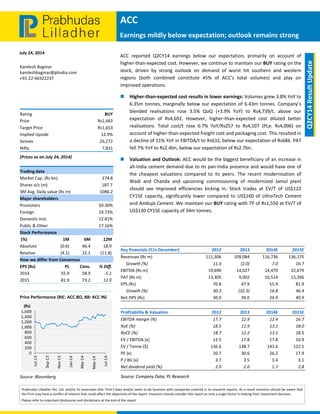
- 1. ACC Earnings mildly below expectation; outlook remains strong July 24, 2014 Prabhudas Lilladher Pvt. Ltd. and/or its associates (the 'Firm') does and/or seeks to do business with companies covered in its research reports. As a result investors should be aware that the Firm may have a conflict of interest that could affect the objectivity of the report. Investors should consider this report as only a single factor in making their investment decision. Please refer to important disclosures and disclaimers at the end of the report Q2CY14 Result Update Kamlesh Bagmar kamleshbagmar@plindia.com +91‐22‐66322237 Rating BUY Price Rs1,463 Target Price Rs1,653 Implied Upside 12.9% Sensex 26,272 Nifty 7,831 (Prices as on July 24, 2014) Trading data Market Cap. (Rs bn) 274.8 Shares o/s (m) 187.7 3M Avg. Daily value (Rs m) 1086.2 Major shareholders Promoters 50.30% Foreign 19.73% Domestic Inst. 12.81% Public & Other 17.16% Stock Performance (%) 1M 6M 12M Absolute (0.6) 46.4 18.9 Relative (4.1) 22.1 (11.8) How we differ from Consensus EPS (Rs) PL Cons. % Diff. 2014 55.9 58.9 ‐5.1 2015 81.9 73.2 12.0 Price Performance (RIC: ACC.BO, BB: ACC IN) Source: Bloomberg 0 200 400 600 800 1,000 1,200 1,400 1,600 Jul‐13 Sep‐13 Nov‐13 Jan‐14 Mar‐14 May‐14 Jul‐14 (Rs) ACC reported Q2CY14 earnings below our expectation, primarily on account of higher‐than‐expected cost. However, we continue to maintain our BUY rating on the stock, driven by strong outlook on demand of worst hit southern and western regions (both combined constitute 45% of ACC’s total volumes) and play on improved operations. Higher‐than‐expected cost results in lower earnings: Volumes grew 3.8% YoY to 6.35m tonnes, marginally below our expectation of 6.43m tonnes. Company’s blended realisations rose 3.5% QoQ (+3.9% YoY) to Rs4,739/t, above our expectation of Rs4,692. However, higher‐than‐expected cost diluted better realisations. Total cost/t rose 6.7% YoY/Rs257 to Rs4,107 (PLe: Rs4,006) on account of higher‐than‐expected freight cost and packaging cost. This resulted in a decline of 11% YoY in EBITDA/t to Rs632, below our expectation of Rs686. PAT fell 7% YoY to Rs2.4bn, below our expectation of Rs2.7bn. Valuation and Outlook: ACC would be the biggest beneficiary of an increase in all‐India cement demand due to its pan‐India presence and would have one of the cheapest valuations compared to its peers. The recent modernisation of Wadi and Chanda and upcoming commissioning of modernized Jamul plant should see improved efficiencies kicking in. Stock trades at EV/T of US$122 CY15E capacity, significantly lower compared to US$160 of UltraTech Cement and Ambuja Cement. We maintain our BUY rating with TP of Rs1,550 at EV/T of US$130 CY15E capacity of 34m tonnes. Key financials (Y/e December) 2012 2013 2014E 2015E Revenues (Rs m) 111,306 109,084 116,736 136,175 Growth (%) 11.3 (2.0) 7.0 16.7 EBITDA (Rs m) 19,690 14,027 14,470 22,679 PAT (Rs m) 13,305 9,002 10,514 15,396 EPS (Rs) 70.8 47.9 55.9 81.9 Growth (%) 30.3 (32.3) 16.8 46.4 Net DPS (Rs) 30.0 30.0 24.9 40.9 Profitability & Valuation 2012 2013 2014E 2015E EBITDA margin (%) 17.7 12.9 12.4 16.7 RoE (%) 18.5 11.9 13.1 18.0 RoCE (%) 18.7 12.2 13.5 18.5 EV / EBITDA (x) 12.5 17.8 17.8 10.9 EV / Tonne ($) 136.6 138.7 142.6 122.5 PE (x) 20.7 30.6 26.2 17.9 P / BV (x) 3.7 3.5 3.4 3.1 Net dividend yield (%) 2.0 2.0 1.7 2.8 Source: Company Data; PL Research Key financials (Y/e December) 2012 2013 2014E 2015E Revenues (Rs m) 111,306 109,084 116,736 136,175 Growth (%) 11.3 (2.0) 7.0 16.7 EBITDA (Rs m) 19,690 14,027 14,470 22,679 PAT (Rs m) 13,305 9,002 10,514 15,396 EPS (Rs) 70.8 47.9 55.9 81.9 Growth (%) 30.3 (32.3) 16.8 46.4 Net DPS (Rs) 30.0 30.0 24.9 40.9 Profitability & Valuation 2012 2013 2014E 2015E EBITDA margin (%) 17.7 12.9 12.4 16.7 RoE (%) 18.5 11.9 13.1 18.0 RoCE (%) 18.7 12.2 13.5 18.5 EV / EBITDA (x) 12.5 17.8 17.8 10.9 EV / Tonne ($) 136.6 138.7 142.6 122.5 PE (x) 20.7 30.6 26.2 17.9 P / BV (x) 3.7 3.5 3.4 3.1 Net dividend yield (%) 2.0 2.0 1.7 2.8 Source: Company Data; PL Research
- 2. July 24, 2014 2 ACC Exhibit 1: Q2CY14 Result Overview (Rs m) Y/e Dec Q2CY14 Q2CY13 YoY gr. (%) Q1CY14 H1CY14 H1CY13 YoY gr. (%) Net Sales 30,090 27,904 7.8 29,671 59,761 56,964 4.9 Raw Material 5,033 4,479 12.4 5,391 10,424 8,555 21.8 % of Net Sales 16.7 16.1 18.2 17.4 15.0 Staff Costs 1,940 1,724 12.5 1,694 3,635 3,341 8.8 % of Net Sales 6.4 6.2 5.7 6.1 5.9 Power & Fuel 6,212 5,901 5.3 6,098 12,310 12,384 (0.6) % of Net Sales 20.6 21.1 20.6 20.6 21.7 Freight 6,702 5,715 17.3 6,627 13,329 11,823 12.7 % of Net Sales 22.3 20.5 22.3 22.3 20.8 Other Expenses 6,191 5,742 7.8 6,209 12,399 12,052 2.9 % of Net Sales 20.6 20.6 20.9 20.7 21.2 Total Expenditure 26,077 23,561 10.7 26,018 52,096 48,155 8.2 EBITDA 4,013 4,343 (7.6) 3,653 7,666 8,809 (13.0) Margin (%) 13.3 15.6 12.3 12.8 15.5 Depreciation 1,401 1,411 (0.7) 1,390 2,791 2,818 (0.9) Other income 884 913 (3.1) 1,117 2,001 1,983 0.9 EBIT 3,496 3,844 (9.1) 3,380 6,876 7,974 (13.8) Interest 111 179 (37.8) 108 219 287 (23.5) PBT 3,385 3,666 (7.7) 3,272 6,656 7,687 (13.4) Extraordinary income/(expense) ‐ ‐ 560 560 399 PBT (After EO) 3,385 3,666 (7.7) 3,832 7,216 8,086 (10.8) Tax 984 1,090 (9.7) (136) 848 1,165 (27.2) % PBT 29.1 29.7 NA 11.8 14.4 Reported PAT 2,400 2,576 (6.8) 3,968 6,368 6,921 (8.0) Minority interest (1) (1) (1) (1) (1) Share of profit/(loss) in associates 32 43 (24.9) 32 64 80 (20.9) Net profit attributable to shareholders 2,432 2,618 (7.1) 3,999 6,430 7,001 (8.1) Adjusted profit attributable to shareholders 2,432 2,618 (7.1) 2,501 4,933 5,329 (7.4) Source: Company Data, PL Research Exhibit 2: Operating Metrics Y/e December Q2CY14 Q2CY13 YoY gr. (%) Q1CY14 H1CY14 H1CY13 YoY gr. (%) Volume (m te) 6.35 6.12 3.8 6.48 12.83 12.54 2.3 Cement realisations (Rs/t) 4,492 4,337 3.6 4,350 4,421 4,328 2.1 Blended realisations/t (Cement + RMC) 4,739 4,559 3.9 4,579 4,658 4,543 2.5 EBITDA/t (Rs/t) 632 710 (10.9) 564 597 702 (14.9) Source: Company Data, PL Research
- 3. July 24, 2014 3 ACC Income Statement (Rs m) Y/e December 2012 2013 2014E 2015E Net Revenue 111,306 109,084 116,736 136,175 Raw Material Expenses 17,303 18,609 19,794 21,879 Gross Profit 94,003 90,475 96,942 114,296 Employee Cost 6,179 6,630 7,212 7,861 Other Expenses 68,134 69,819 75,260 83,755 EBITDA 19,690 14,027 14,470 22,679 Depr. & Amortization 5,689 5,838 5,939 5,988 Net Interest 1,147 517 488 545 Other Income 1,555 4,464 4,796 5,019 Profit before Tax 14,410 12,136 12,840 21,166 Total Tax 3,911 1,319 3,595 5,927 Profit after Tax 10,499 10,817 9,245 15,240 Ex‐Od items / Min. Int. (2,112) (2,258) 1,273 160 Adj. PAT 13,305 9,002 10,514 15,396 Avg. Shares O/S (m) 188.0 188.0 188.0 188.0 EPS (Rs.) 70.8 47.9 55.9 81.9 Cash Flow Abstract (Rs m) Y/e December 2012 2013 2014E 2015E C/F from Operations 15,769 10,686 15,662 20,530 C/F from Investing (3,079) (7,283) (14,786) (5,807) C/F from Financing (10,660) (8,609) (8,284) (5,993) Inc. / Dec. in Cash 2,029 (5,206) (7,408) 8,729 Opening Cash 29,526 31,555 25,229 21,320 Closing Cash 31,555 25,229 21,320 30,049 FCFF 12,865 8,192 12,887 (9,213) FCFE 9,388 6,911 12,537 (9,213) Key Financial Metrics Y/e December 2012 2013 2014E 2015E Growth Revenue (%) 11.3 (2.0) 7.0 16.7 EBITDA (%) 16.8 (28.8) 3.2 56.7 PAT (%) 30.3 (32.3) 16.8 46.4 EPS (%) 30.3 (32.3) 16.8 46.4 Profitability EBITDA Margin (%) 17.7 12.9 12.4 16.7 PAT Margin (%) 12.0 8.3 9.0 11.3 RoCE (%) 18.7 12.2 13.5 18.5 RoE (%) 18.5 11.9 13.1 18.0 Balance Sheet Net Debt : Equity (0.4) (0.3) (0.2) (0.3) Net Wrkng Cap. (days) (275) (270) (268) (258) Valuation PER (x) 20.7 30.6 26.2 17.9 P / B (x) 3.7 3.5 3.4 3.1 EV / EBITDA (x) 12.5 17.8 17.8 10.9 EV / Sales (x) 2.2 2.3 2.2 1.8 Earnings Quality Eff. Tax Rate 27.1 10.9 28.0 28.0 Other Inc / PBT 27.6 38.5 37.4 23.7 Eff. Depr. Rate (%) 5.5 5.5 5.4 4.2 FCFE / PAT 70.6 76.8 119.2 (59.8) Source: Company Data, PL Research. Balance Sheet Abstract (Rs m) Y/e December 2012 2013 2014E 2015E Shareholder's Funds 73,724 78,134 82,072 88,531 Total Debt 1,631 350 — — Other Liabilities 5,251 5,155 5,671 6,731 Total Liabilities 80,606 83,640 87,743 95,262 Net Fixed Assets 64,397 67,936 78,847 80,773 Goodwill — — — — Investments 1,014 867 1,011 1,169 Net Current Assets 15,195 14,837 7,885 13,320 Cash & Equivalents 30,579 25,446 18,038 26,767 Other Current Assets 23,291 26,762 27,929 30,527 Current Liabilities 38,676 37,371 38,082 43,974 Other Assets — — — — Total Assets 80,606 83,640 87,743 95,262 Quarterly Financials (Rs m) Y/e December Q3CY13 Q4CY13 Q1CY14 Q2CY14 Net Revenue 25,087 26,873 29,671 30,090 EBITDA 2,254 2,627 3,653 4,013 % of revenue 9.0 9.8 12.3 13.3 Depr. & Amortization 1,470 1,550 1,390 1,401 Net Interest (894) (1,296) (1,009) (773) Other Income 1,004 1,416 1,117 884 Profit before Tax 1,678 2,372 3,832 3,385 Total Tax 512 (359) (136) 984 Profit after Tax 1,189 2,757 3,999 2,432 Adj. PAT 1,189 1,998 2,501 2,432 Key Operating Metrics Y/e December 2012 2013 2014E 2015E Volume (mn te) 24.1 23.9 24.7 26.8 Net Realisation (Rs/te) 4,376.5 4,321.8 4,432.4 4,787.0 EBITDA (Rs/ te) 816.7 586.2 586.0 846.0 RM cost (Rs/ te) 717.4 779.9 801.7 816.2 Power, Oil & Fuel (Rs/ te) 988.5 999.4 1,012.7 1,036.6 Freight Charges (Rs/ te) 921.3 967.9 1,035.6 1,087.4 Source: Company Data, PL Research.
- 4. July 24, 2014 4 ACC Prabhudas Lilladher Pvt. Ltd. 3rd Floor, Sadhana House, 570, P. B. Marg, Worli, Mumbai‐400 018, India Tel: (91 22) 6632 2222 Fax: (91 22) 6632 2209 Rating Distribution of Research Coverage 29.4% 50.5% 20.2% 0.0% 0% 10% 20% 30% 40% 50% 60% BUY Accumulate Reduce Sell % of Total Coverage PL’s Recommendation Nomenclature BUY : Over 15% Outperformance to Sensex over 12‐months Accumulate : Outperformance to Sensex over 12‐months Reduce : Underperformance to Sensex over 12‐months Sell : Over 15% underperformance to Sensex over 12‐months Trading Buy : Over 10% absolute upside in 1‐month Trading Sell : Over 10% absolute decline in 1‐month Not Rated (NR) : No specific call on the stock Under Review (UR) : Rating likely to change shortly This document has been prepared by the Research Division of Prabhudas Lilladher Pvt. Ltd. Mumbai, India (PL) and is meant for use by the recipient only as information and is not for circulation. This document is not to be reported or copied or made available to others without prior permission of PL. It should not be considered or taken as an offer to sell or a solicitation to buy or sell any security. The information contained in this report has been obtained from sources that are considered to be reliable. However, PL has not independently verified the accuracy or completeness of the same. Neither PL nor any of its affiliates, its directors or its employees accept any responsibility of whatsoever nature for the information, statements and opinion given, made available or expressed herein or for any omission therein. Recipients of this report should be aware that past performance is not necessarily a guide to future performance and value of investments can go down as well. The suitability or otherwise of any investments will depend upon the recipient's particular circumstances and, in case of doubt, advice should be sought from an independent expert/advisor. Either PL or its affiliates or its directors or its employees or its representatives or its clients or their relatives may have position(s), make market, act as principal or engage in transactions of securities of companies referred to in this report and they may have used the research material prior to publication. We may from time to time solicit or perform investment banking or other services for any company mentioned in this document.