Impact of Immigration on NYC

Our fourth Impact Forum was held on January 27, 2016 at Soho House in NYC on the topic of Immigration & Borders. Our brief aims to inform the Impact community on key questions on the subject from a political & social impact perspective: What makes a sensible immigration policy? How should borders define citizenship, residency, and rights? 26% of the U.S. population is either a first- or second-generation immigrant. It is estimated that 30% of New York residents are born outside of the United States. The Impact community joined a panel of top experts on immigration-related policy and social justice for a dialogue on the future of the US immigration system, hosted at the Soho House. Learn more about Impact Borders here: https://impactborders.splashthat.com

Empfohlen
Weitere ähnliche Inhalte
Was ist angesagt?
Was ist angesagt? (19)
Andere mochten auch
Andere mochten auch (19)
Ähnlich wie Impact of Immigration on NYC
Ähnlich wie Impact of Immigration on NYC (20)
Kürzlich hochgeladen
Kürzlich hochgeladen (20)
Impact of Immigration on NYC
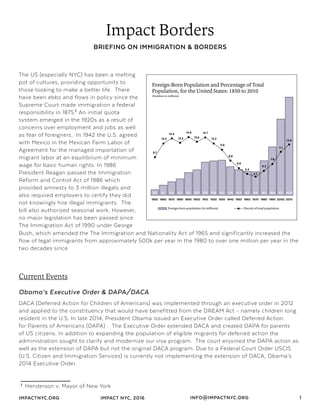
- 1. IMPACTNYC.ORG 1IMPACT NYC, 2016 INFO@IMPACTNYC.ORG Impact Borders BRIEFING ON IMMIGRATION & BORDERS The US (especially NYC) has been a melting pot of cultures, providing opportunity to those looking to make a better life. There have been ebbs and flows in policy since the Supreme Court made immigration a federal responsibility in 1875. An initial quota system emerged in the 1920s as a result of concerns over employment and jobs as well as fear of foreigners. In 1942 the U.S. agreed with Mexico in the Mexican Farm Labor of Agreement for the managed importation of migrant labor at an equilibrium of minimum wage for basic human rights. In 1986 President Reagan passed the Immigration Reform and Control Act of 1986 which provided amnesty to 3 million illegals and also required employers to certify they did not knowingly hire illegal immigrants. The bill also authorized seasonal work. However, no major legislation has been passed since The Immigration Act of 1990 under George 2.2 1850 1860 4.1 1870 5.6 1880 6.7 1890 9.2 1900 10.3 1910 13.5 1920 13.9 1930 14.2 1940 11.6 1950 10.3 1960 9.7 1970 9.6 1980 14.1 1990 19.8 2000 31.1 2010 40.0 Foreign-Born Population and Percentage of Total Population, for the United States: 1850 to 2010 (Numbers in millions) 9.7 Percent of total populationForeign-born population (in millions) 13.2 14.4 13.3 14.8 13.6 14.7 13.2 11.6 8.8 6.9 5.4 4.7 6.2 7.9 11.1 12.9 Bush, which amended the The Immigration and Nationality Act of 1965 and significantly increased the flow of legal immigrants from approximately 500k per year in the 1980 to over one million per year in the two decades since. Obama’s Executive Order & DAPA/DACA DACA (Deferred Action for Children of Americans) was implemented through an executive order in 2012 and applied to the constituency that would have benefitted from the DREAM Act - namely children long resident in the U.S. In late 2014, President Obama issued an Executive Order called Deferred Action for Parents of Americans (DAPA) . The Executive Order extended DACA and created DAPA for parents of US citizens. In addition to expanding the population of eligible migrants for deferred action the administration sought to clarify and modernize our visa program. The court enjoined the DAPA action as well as the extension of DAPA but not the original DACA program. Due to a Federal Court Order USCIS (U.S. Citizen and Immigration Services) is currently not implementing the extension of DACA, Obama’s 2014 Executive Order. Current Events Henderson v. Mayor of New York1 1
- 2. IMPACTNYC.ORG 2IMPACT NYC, 2016 INFO@IMPACTNYC.ORG Deportation and Building the Wall Some Presidential candidates, Donald Trump being the loudest, have threatened to deport the 11-12 million illegal immigrants and build a wall along the Mexican border. Enforcement techniques would include: 1) tripling the number of ICE (Immigrations and Customs Enforcement) officers, 2) enforcing the use of the e-verify program on a national scale, 3) enhance penalties for overstaying a visa, 4) defund sanctuary cities, and 5) end birthright citizenship. Syrian Refugees The Syrian Refugee crisis related to the Arab Spring, beginning in 2011. Since then a steady diaspora has ensued with as many as 6.5 million Syrians estimated by UN considered dislocated or resettled or in need of resettlement. The United States has annual caps on refugee admittance and typically approves 10-30,000 applications for asylum despite no cap. The chart at right shows the admitted refugees in thousands by origin since 2001 (Migration Policy Institute). The President most recently proposed a cap of 85,000 for 2016. Initially, the United 80 70 60 50 40 30 20 10 0 2001 2002 2003 2004 2005 2006 2007 2008 2009 2010 North America Europe Aisa Africa States accepted 1,500 Syrians up from 90 in 2013. In 2015 Obama said that the U.S. would expand its acceptance of Syrian Refugees to 10,000, and John Kerry said the United States would seek to place the total refugee cap at 100,000 in 2017. After a laissez-faire approach to immigration during the 18th and 19th centuries, the Supreme Court declared the regulation of immigration as a federal responsibility (after certain states had passed laws post the Civil War). The Office of Superintendent of Immigration was created within the Treasury Department under the Immigration Act of 1891 to inspect, admit, reject and process all immigrants. This law expanded the list of excludable classes from entering the country (including Chinese, polygamists, convicted felons, disease-bearing, etc). Lastly it created immigration stations—Ellis Island became the largest station within the department. Over the next 50 years, Congress passed numerous acts to set policies around naturalization. Between 1900 and 1920, 14.5 million entered the US. Post WWI, Eugine Debs and Booker T Washington and others supported reductions in immigration as a result of concern for jobs and employment as well as concern for foreigners. This led to immigration acts (1921 and 1924) that established quotas for each nationality, officially limiting immigrants for the first time in US history. This inevitably led to illegal immigration, and Congress created the US Border Patrol in 1924. Immigration dropped during the Great Depression and WWII due to these numerical limitations. However, the Bracero Program was formally created in 1951 (initially an executive order since 1942) between the US and Mexico that matched seasonal agricultural workers with approved American employers. History of US and NYC Immigration
- 3. IMPACTNYC.ORG 3IMPACT NYC, 2016 INFO@IMPACTNYC.ORG program was not properly enforced and led to a flood of unauthorized workers. This ultimately led to Operation Wetback, a cooperation between the INS and the Mexican government to stem the flow of illegal entry and deport unauthorized immigrants. After implementation, Operation Wetback gave rise to arrests and deportations by the U.S. Border Patrol that included physical abuse and civil rights violations, and even deportations of hundreds of U.S. citizens unable to convince border agents of their status. These policies were eventually changed; for the past 50+ years, US immigration has been shaped by the Immigration Nationality Act of 1952 and respective Amendments of 1965. This replaced the national origins quotas of the 1920s (favored Europeans) with a visa-based system (open to all nationalities). The Act (further amended in 1976 and 1978) focused on family reunification, encouraged those with occupational skills required in the US, and set policy around admission of refugees and asylees. As a result of these policies, immigration dramatically increased from Latin America and Asia. Not all immigration was legal. In 1986, the Immigration Reform and Control Act was passed which increased border and employment controls but also provided amnesty to the unauthorized in good legal standing that arrived prior to 1982. Nearly 3 million came forward and were awarded permanent living status. By 1990, Congress passed The 1990 Immigration Act which placed a greater importance on skills. It expanded the number of permanent work visas for high-skills to 130,000 from 27,000 and decreased those for less-skilled to 10,000 from 27,000. It also created a pool of visas that would be awarded via a blind lottery to focus on diversity and help those immigrant groups hurt by the 1965 amendments. New York City immigrants prior to 1990 had been heavily reliant on family preference visas. This shifted to be based on immediate familial relationships and employment preferences given the policy shifts at the federal level. Asian and Hispanics made up the largest demographics that emigrated to NYC. In addition, the city became the US epicenter for Chinese refugees. Despite these changes in flows, New York continues to be a net exporter of immigrants to the rest of the country, similar to that seen in the late 19th/early 20th century during the peak years of Ellis Island. While, the foreign-born population has grown in the city, it has grown even more quickly in the neighboring counties. Between 1990 and 2011, NYC and neighboring counties saw population increases from 2.1M/1.6M to 3.1M/2.9M, respectively. Immigration is a policy managed predominantly at the federal level. Key topics include US citizenship, family-based immigration, employment-based immigration (temporary visas and permanent immigration), refugees and “asylees” as well as other diversity visa and humanitarian relief programs. There are approximately 876,000 visas available each year for the majority of US bound immigrants. Key Laws The 1990 Immigration Act is the body of law governing current immigration policy with a worldwide limit of 675,000 permanent immigrants (green cards). This is broken into (a) 480,000 for family-based visas; (b) 140,000 for permanent employment visas; and (c) 55,000 for the diversity visa program. In addition, there are approximately 131,000 visa The 1990 Immigration Act is the body of law governing current immigration policy with a worldwide limit of 675,000 permanent immigrants (green cards). This is broken into (a) 480,000 for family-based visas; (b) 140,000 for permanent employment visas; and (c) 55,000 for the diversity visa program. In addition, there are approximately 131,000 visas for temporary workers under Immigration 101
- 4. IMPACTNYC.ORG 4IMPACT NYC, 2016 INFO@IMPACTNYC.ORG the H-1/2B programs. There are 70,000 visas (2015) set aside for refugees (managed by the President) and no limit for asylees. Despite these efforts, visas are oversubscribed, and it is estimated that there are approximately 11- 12 million illegal immigrants in the United States. According to the Pew Research Center, of the 11.3M illegal immigrants residing in the US in 2014, (1) Mexicans made up 49% (declining from a peak of 57% in 2007) and (2) only six states house 60% of the total (including New York). In addition, Pew claims that unauthorized immigrants make up 5.1% of the labor force, and approximately 7% of K-12 students had at least one unauthorized immigrant parent in 2012. s for temporary workers under the H-1/2B programs. There are 70,000 visas (2015) set aside for refugees (managed by the President) and no limit for asylees. Despite these efforts, visas are oversubscribed, and it is estimated that there are approximately 11- 12 million illegal immigrants in the United States. According to the Pew Research Center, of the 11.3M illegal immigrants residing in the US in 2014, (1) Mexicans made up 49% (declining from a peak of 57% in 2007) and (2) only six states house 60% of the total (including New York). In addition, Pew claims that unauthorized immigrants make up 5.1% of the labor force, and approximately 7% of K-12 students had at least one unauthorized immigrant parent in 2012. Immigration in New York As it relates to New York City, approximately 37% (or 3.1 million) of the 8.2 million inhabitants (as of 2011) are foreign-born, and 52% or 1.6 million have acquired citizenship. The city still serves as the largest metropolitan area for legal immigration in the country. Dominicans (12.4%), Chinese (11.4%) and Mexicans (6.1%) make up the three largest pools of foreigners for a total of 29.9% of the foreign-born. Nearly 2/3 of foreign-born reside in Brooklyn and Queens, with the majority of the remaining third evenly split between Bronx and Manhattan. Staten Island makes up a small remainder. Foreign-born households average 1.4 workers per household (vs 1.1 for native-born); 20% live in poverty (vs 21% for native-born); and 4.0% receive public assistance (vs 4.5% for native-born). It is estimated by NYC Department of City Planning that there were approximately 499,000 unauthorized immigrants in NYC as of 2010 (73% of the undocumented in NY state). This has declined ~12% since the 2004 peak. In 2009, it was estimated that 31,400 persons exited this status—33% by leaving the US, 37% by becoming permanent residents, 23% via deportation and 7% due to death. Since 2003 immigration issues are overseen by the Department of Homeland Security (executive branch) at the federal level. Similarly, the Mayor’s Office of Immigration Affairs is meant to help promote policies and programs that facilitate successful integration into New York City life. Mayor Bloomberg was the last mayor to enact major executive orders and pass local laws that empowered immigrants to access vital city, health and human services.
- 5. IMPACTNYC.ORG 5IMPACT NYC, 2016 INFO@IMPACTNYC.ORG Links from our Speakers Roy Beck: Immigration and World Poverty www.youtube.com/watch?v=LPjzfGChGlE Current Event Topics and Articles Obama’s DAPA goes to the Supreme Court: www.newrepublic.com/article/127504/next- supremecourt-obamas-immigration-policy Washington Times – Immigration Reform: http://www.washingtontimes.com/specials/ immigration-reform/ Finds topics such as Syrian refugees, Raids on illegal immigrants, H-1B Visas, DAPA and DACA, as well as Presidential candidates’ views. Pew Research Illegal Immigration: http://www.pewresearch.org/fact- tank/2015/11/19/5-facts-about-illegal- immigration-in-the-u-s/ Migration Policy Institute Ten Facts about Refugee Resettlement: http://www.migrationpolicy.org/research/ten- facts-about-us-refugee-resettlement Giving the Facts a Fighting Chance: Addressing Common Questions on Immigration: http://www.immigrationpolicy.org/special-reports/ addressing-common-questions-on-immigration Learning from our Past: The Refugee Experience in the United States: http://www.immigrationpolicy.org/perspectives/ refugee-experience-united-states Opportunity and Exclusion: A Brief History of US Immigration Policy: http://www.immigrationpolicy.org/sites/default/ files/docs/opportunity_exclusion_011312.pdf Why Don’t They Just Get In Line: http://www.immigrationpolicy.org/just-facts/why- don%E2%80%99t-they-just-get-line Center For Immigration Studies US Immigration Population Hits Records: http://cis.org/us-immigrant-pop-hit-record-42- million-2014#frontpage http://cis.org/Immigrant-Population-Hits-Record- Second-Quarter-2015 E-Verify Fact Sheet: http://cis.org/Immigration-Policy-Fact-Sheets/E- Verify A Brief Analysis of H.R. 158, “The Visa Waiver Program Improvement Act of 2015”: http://cis.org/Brief-Analysis-HR-158-Visa-Waiver- Program-Improvement-Act-2015 CATO Institute The Best Argument against Immigration: http://www.cato.org/publications/commentary/ best-argument-against-immigration Employers Ignore E-Verify: www.cato.org/blog/employers-ignore-e-verify NYC Office of Immigrant Affairs Constituent Facts & Maps: www.nyc.gov/html/imm/html/news/stats.shtml