Alan Donnelly
•
1 gefällt mir•345 views

Low intensity physical activity behaviours and body composition in older adults: Findings from the Mitchelstown Cohort Rescreen Study

Empfohlen
Empfohlen
Weitere ähnliche Inhalte
Was ist angesagt?
Was ist angesagt? (20)
Ähnlich wie Alan Donnelly
Ähnlich wie Alan Donnelly (20)
Mehr von Institute of Public Health in Ireland
Mehr von Institute of Public Health in Ireland (20)
Kürzlich hochgeladen
Kürzlich hochgeladen (20)
Alan Donnelly
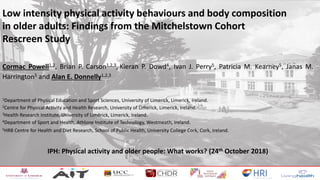
- 1. Low intensity physical activity behaviours and body composition in older adults: Findings from the Mitchelstown Cohort Rescreen Study Cormac Powell1,2, Brian P. Carson1,2,3, Kieran P. Dowd4, Ivan J. Perry5, Patricia M. Kearney5, Janas M. Harrington5 and Alan E. Donnelly1,2,3 1Department of Physical Education and Sport Sciences, University of Limerick, Limerick, Ireland. 2Centre for Physical Activity and Health Research, University of Limerick, Limerick, Ireland. 3Health Research Institute, University of Limerick, Limerick, Ireland. 4Department of Sport and Health, Athlone Institute of Technology, Westmeath, Ireland. 5HRB Centre for Health and Diet Research, School of Public Health, University College Cork, Cork, Ireland. IPH: Physical activity and older people: What works? (24th October 2018)
- 2. Physical activity in older adults Specific physical activity (PA) guidelines for older adults Include 30 minutes of moderate-to-vigorous PA (MVPA) daily Meeting the guidelines = improved health Older adults’ adherence to the guidelines are poor 33% of older Irish adults meet the guidelines – TILDA (Barrett et al., 2011) Sedentary behaviour (an independent risk factor for health) increases as people age (Van Dyck et al., 2016) Physical Activity (MVPA) Sedentary Behaviour Ageing
- 3. Physical activity in older adults Aims 1. Examine the association between low intensity physical behaviours and body composition 2. Model replacing sedentary time with standing time and LIPA Physical activity continuum (Tremblay et al., 2010) Light-intensity physical activity (LIPA) (Howard et al., 2015; Loprinzi et al., 2015 Loprinzi et al., 2013; Healy et al., 2007). Standing time (van der Berg et al., 2017; Duvivier et al., 2017; Buckley et al., 2015; Duvivier et al., 2013)
- 4. Methods Study participants • Participants recruited from the Mitchelstown Cohort Rescreen (MCR) Study (follow up to the Cork and Kerry Diabetes Study (Kearney et al., 2013) Body composition measures 1,378 participants included in the MCR Study 399 participants in the physical activity sub-sample 1,881 participants eligible for the MCR Study Body composition measure Body mass (kg) BMI (kg.m-2) Body fat (%) Fat mass (kg) Fat-free mass (kg) *Ethics granted by the Clinical Research Ethics Committee of University College Cork
- 5. Methods Habitual physical activity • Affixed to the mid section of the anterior right thigh – worn for 24 hours a day for 7 consecutive days Analyses • Two analysis methods: 1. Multiple linear regression analysis: examine the associations between low intensity behaviours and body composition. 2. Isotemporal substitution analysis: examine the effect of reallocating time between behaviours. Note: 1) Values presented as unstandardized betas (B) and 99% confidence intervals (CI). 2) Adjusted for: • Age and sex • Medication use • Disease status • Lifestyle factors (Powell et al., 2017) Inclusion criteria ≥4 days ≥10 hours/day ≥1 x week day ≥1 x weekend day
- 6. Results: Descriptives N=368 N=200 N=168 Age 64.64 (5.32) years Sleep/Bed time 36% Sedentary time 32% Standing time 22% LIPA 7% Total [CATEGORY NAME] [PERCENTAGE] THE MCR ACTIVITY PIE Sleep/Bed time Sedentary time Standing time LIPA Total MVPA 8.57 hours 7.79 hours 5.29 hours 1.67 hours 0.65 hours Average daily wear time = 23.9/day MVPA bouts ≥10 minutes: 0.15 hours (9.33 minutes)
- 7. Results: Associations Sedentary Time (hours) Body mass (kg) 1.42 (0.15, 2.70) BMI (kg.m-2) 0.33 (-0.13, 0.79) Body fat (%) 0.66 (0.08, 1.23) Fat mass (kg) 0.95 (0.15, 1.75) Fat-free mass (kg) 0.47 (-0.09, 1.04) Standing Time (hours) Body mass (kg) -0.48 (-1.93, 0.98) BMI (kg.m-2) 0.09 (-0.43, 0.61) Body fat (%) -0.17, -0.84, 0.50) Fat mass (kg) -0.28 (-1.21, 0.66) Fat-free mass (kg) -0.35 (-0.99, 0.30) LIPA (hours) Body mass (kg) -4.76 (-8.23, -1.29) BMI (kg.m-2) -1.49 (-2.73, -0.25) Body fat (%) -3.39 (-4.94, -1.85) Fat mass (kg) -4.31 (-6.48, -2.14) Fat-free mass (kg) -1.17 (-2.74, 0.41)
- 8. Results: Associations Sedentary Time (hours) Body mass (kg) 1.42 (0.15, 2.70) BMI (kg.m-2) 0.33 (-0.13, 0.79) Body fat (%) 0.66 (0.08, 1.23) Fat mass (kg) 0.95 (0.15, 1.75) Fat-free mass (kg) 0.47 (-0.09, 1.04) Standing Time (hours) Body mass (kg) -0.48 (-1.93, 0.98) BMI (kg.m-2) 0.09 (-0.43, 0.61) Body fat (%) -0.17, -0.84, 0.50) Fat mass (kg) -0.28 (-1.21, 0.66) Fat-free mass (kg) -0.35 (-0.99, 0.30) LIPA (hours) Body mass (kg) -4.76 (-8.23, -1.29) BMI (kg.m-2) -1.49 (-2.73, -0.25) Body fat (%) -3.39 (-4.94, -1.85) Fat mass (kg) -4.31 (-6.48, -2.14) Fat-free mass (kg) -1.17 (-2.74, 0.41)
- 9. Results: Associations Sedentary Time (hours) Body mass (kg) 1.42 (0.15, 2.70) BMI (kg.m-2) 0.33 (-0.13, 0.79) Body fat (%) 0.66 (0.08, 1.23) Fat mass (kg) 0.95 (0.15, 1.75) Fat-free mass (kg) 0.47 (-0.09, 1.04) Standing Time (hours) Body mass (kg) -0.48 (-1.93, 0.98) BMI (kg.m-2) 0.09 (-0.43, 0.61) Body fat (%) -0.17, -0.84, 0.50) Fat mass (kg) -0.28 (-1.21, 0.66) Fat-free mass (kg) -0.35 (-0.99, 0.30) LIPA (hours) Body mass (kg) -4.76 (-8.23, -1.29) BMI (kg.m-2) -1.49 (-2.73, -0.25) Body fat (%) -3.39 (-4.94, -1.85) Fat mass (kg) -4.31 (-6.48, -2.14) Fat-free mass (kg) -1.17 (-2.74, 0.41) NO ASSOCIATIONS
- 10. Results: Associations Sedentary Time (hours) Body mass (kg) 1.42 (0.15, 2.70) BMI (kg.m-2) 0.33 (-0.13, 0.79) Body fat (%) 0.66 (0.08, 1.23) Fat mass (kg) 0.95 (0.15, 1.75) Fat-free mass (kg) 0.47 (-0.09, 1.04) Standing Time (hours) Body mass (kg) -0.48 (-1.93, 0.98) BMI (kg.m-2) 0.09 (-0.43, 0.61) Body fat (%) -0.17, -0.84, 0.50) Fat mass (kg) -0.28 (-1.21, 0.66) Fat-free mass (kg) -0.35 (-0.99, 0.30) LIPA (hours) Body mass (kg) -4.76 (-8.23, -1.29) BMI (kg.m-2) -1.49 (-2.73, -0.25) Body fat (%) -3.39 (-4.94, -1.85) Fat mass (kg) -4.31 (-6.48, -2.14) Fat-free mass (kg) -1.17 (-2.74, 0.41)
- 11. Results: Associations Sedentary Time (hours) Body mass (kg) 1.42 (0.15, 2.70) BMI (kg.m-2) 0.33 (-0.13, 0.79) Body fat (%) 0.66 (0.08, 1.23) Fat mass (kg) 0.95 (0.15, 1.75) Fat-free mass (kg) 0.47 (-0.09, 1.04) Standing Time (hours) Body mass (kg) -0.48 (-1.93, 0.98) BMI (kg.m-2) 0.09 (-0.43, 0.61) Body fat (%) -0.17, -0.84, 0.50) Fat mass (kg) -0.28 (-1.21, 0.66) Fat-free mass (kg) -0.35 (-0.99, 0.30) LIPA (hours) Body mass (kg) -4.76 (-8.23, -1.29) BMI (kg.m-2) -1.49 (-2.73, -0.25) Body fat (%) -3.39 (-4.94, -1.85) Fat mass (kg) -4.31 (-6.48, -2.14) Fat-free mass (kg) -1.17 (-2.74, 0.41) Measure Standing time LIPA Body mass (kg) 0.02 (-0.23, 0.27) -0.80 (-1.41, -0.19) BMI (kg.m-2) 0.05 (-0.04, 0.14) -0.28 (-0.50, -0.06) Body fat (%) 0.04 (-0.07, 0.15) -0.60 (-0.87, -0.32) Fat mass (kg) 0.04 (-0.11, 0.20) -0.75 (-1.13, -0.36) Fat-free mass (kg) -0.04 (-0.15, 0.07) -0.17 (-0.44, 0.11) Reallocating 10 minutes from sedentary time to LIPA: 0.80kg ↓ in body mass 0.28kg.m-2 ↓ in BMI 0.60% ↓ in body fat 0.75kg ↓ in fat mass No effect observed for reallocation to standing Reallocations
- 12. Conclusions 1. MVPA is still the recommended intensity; however, adherence to the guidelines is poor. 2. No beneficial associations observed for standing time. 3. ↓ sedentary behaviour + ↑ LIPA = effective strategy for this age group……even as little as 10 minutes!
- 13. Dr. Cormac Powell @mackers89 cormac.powell@ul.ieresearchgate/cormacpowell Thank you for listening - all questions are welcome Funding • Health Research Board Centre for Health and Diet Research (HRB 2007/2013) • University of Limerick Department of Physical Education and Sport Sciences Postgraduate Scholarship Programme (2013-2017)
- 14. References 1. Barrett A, Savva G, Timonen V, Kenny RA. Fifty Plus in Ireland 2011 First results from the Irish Longitudinal Study on Ageing (TILDA). Dublin: The Irish Longitudinal Study on Ageing. 2011 2. Buckley JP, Hedge A, Yates T, Copeland RJ, Loosemore M, Hamer M, et al. The sedentary office: an expert statement on the growing case for change towards better health and productivity. British journal of sports medicine. 2015;49(21):1357-62. 3. Duvivier B, Schaper NC, Koster A, van Kan L, Peters HPF, Adam JJ, et al. Benefits of Substituting Sitting with Standing and Walking in Free-Living Conditions for Cardiometabolic Risk Markers, Cognition and Mood in Overweight Adults. Front Physiol. 2017;8:353. 4. Duvivier BM, Schaper NC, Bremers MA, van Crombrugge G, Menheere PP, Kars M, et al. Minimal intensity physical activity (standing and walking) of longer duration improves insulin action and plasma lipids more than shorter periods of moderate to vigorous exercise (cycling) in sedentary subjects when energy expenditure is comparable. PLoS One. 2013;8(2):e55542. 5. Healy GN, Dunstan DW, Shaw JE, Zimmet PZ, Owen N. Objectively measured sedentary time and light-intensity physical activity are independently associated with components of the metabolic syndrome: the AusDiab study. Diabetologia. 2007;50:S67-S8. 6. Howard B, Winkler EA, Sethi P, Carson V, Ridgers ND, Salmon JO, et al. Associations of Low- and High-Intensity Light Activity with Cardiometabolic Biomarkers. Medicine and science in sports and exercise. 2015;47(10):2093-101. 7. Loprinzi PD, Lee H, Cardinal BJ. Dose Response Association between Physical Activity and Biological, Demographic, and Perceptions of Health Variables. Obesity Facts. 2013;6(4):380-92. 8. Loprinzi PD, Lee H, Cardinal BJ. Evidence to support including lifestyle light-intensity recommendations in physical activity guidelines for older adults. Am J Health Promot. 2015;29(5):277-84. 9. Powell C, Carson BP, Dowd KP, Donnelly AE. Simultaneous validation of five activity monitors for use in adult populations. Scand J Med Sci Sports. 2017;27(12):1881-92. 10. Tremblay MS, Colley RC, Saunders TJ, Healy GN, Owen N. Physiological and health implications of a sedentary lifestyle. Appl Physiol Nutr Metab. 2010;35(6):725- 40. 11. Van Der Berg JD, Van Der Velde JHPM, Waard EAC, Bosma H, Savelberg HHCM, Schaper NC, et al. Replacement Effects of Sedentary Time on Metabolic Outcomes: The Maastricht Study. Medicine and science in sports and exercise. 2017;49(7):1351-8. 12. Van Dyck D, Cardon G, De Bourdeaudhuij I. Longitudinal changes in physical activity and sedentary time in adults around retirement age: what is the moderating role of retirement status, gender and educational level? BMC public health. 2016;16(1):1125.