Quantification of annual soil greenhouse gas emissions under different land use system in southern Kenya
•
0 gefällt mir•228 views

Prepared by Sheila Wachiye , Lutz Merbold, Timo Vesala, Janne Rinne, Matti Räsänen and Petri Pellikka for the General Assembly 2019 of the European Geosciences Union (EGU), Vienna, Austria, 7–12 April 2019.
Empfohlen

Empfohlen
Weitere ähnliche Inhalte
Was ist angesagt?
Was ist angesagt? (20)
Ähnlich wie Quantification of annual soil greenhouse gas emissions under different land use system in southern Kenya
Ähnlich wie Quantification of annual soil greenhouse gas emissions under different land use system in southern Kenya (20)
Mehr von ILRI
Mehr von ILRI (20)
Kürzlich hochgeladen
Kürzlich hochgeladen (20)
Quantification of annual soil greenhouse gas emissions under different land use system in southern Kenya
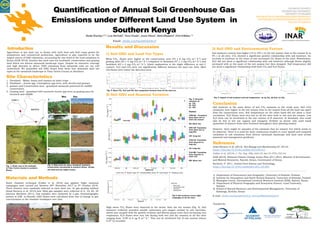
- 1. AFRICA KENYA Quantification of Annual Soil Greenhouse Gas Emissions under Different Land Use System in Southern Kenya Sheila Wachiye1,2,5, Lutz Merbold3, Timo Vesala2, Janne Rinne4, Matti Räsänen2, Petri Pellikka 1,2 HELSINGINYLIOPISTO HELSINGFORSUNIVERSITET UNIVERSITYOFHELSINKI MATEMAATTIS-LUONNONTIETEELLINENTIEDEKUNTA MATEMATISK-NATURVETENSKAPLIGAFAKULTETEN FACULTYOFSCIENCE Introduction Agriculture is key land use in Kenya with both food and feed crops grown for subsistence and commercial production. Agriculture is also reported to be the largest source of GHG emissions, accounting for one-third of the total emissions in Kenya (GOK 2010). Another key land uses are bushland, conservation and grazing land which are diverse savannah landscape types. Despite its extensive coverage and high diversity in Africa, GHG emissions from savannah soils are not well understood. We quantified soil GHG fluxes from these four dominant land use types in the savannah landscape in Taita Taveta County in Southern. Site Characteristics 1. Farmland - Maize, beans and cassava as main crops 2. Bushland – Acacia spp, Commiphora spp trees, with shrubs and grasses 3. grasses and Conservation area - grassland savannah protected for wildlife conservation. 4. Grazing land - grassland with scattered Acacia spp trees as grazing area for livestock and wildlife Fig. 2: Main land use types, farmland, bushland, conservation and grazing in southern Kenya during wet (left) and dry (right) season. Materials and Methods Static chamber technique (Collier et al. 2014) was applied. Eight seasonal campaigns were carried out between 29th November 2017 to 5th October 2018. Three clusters were randomly selected in each land use. In gas pooling method (Arias-Navarro et al. 2013) four 20ml gas samples were collected at 0, 10, 20, 30 minutes (Rochette 2011). Gas samples were analysed by a gas chromatography system at ILRI in Nairobi. GHG fluxes were calculated from rate of change in gas concentration in the chamber headspace over time. Results and Discussion 1) Soil GHG and Land Use Types Mean CO2, fluxes were higher in the conservation area (75 ± 6 mg CO2 m-2 h-1) and grazing land (50 ± 5 mg CO2 m-2 h-1) compared to farmland (47 ± 3 mg CO2 m-2 h-1) and bushland (45 ± 4 mg CO2 m-2 h-1). Likely explanation is the slight difference in soil C content. N2O and CH4 were not significantly different between the land use sites. Most CH4 fluxes were below the detection level. Fig. 3: Mean CO2, N2O and CH4 flux comparison between from all the land use 2) Soil GHG and Seasonal Variation Fig. 4: Seasonal variation of (a) CO2 (b) N2O (c) CH4 Seasons TSW-SD: Transition from short wet to short dry season SD: Short dry TSD-LW: Transition from short dry to long Wet LW: Long wet TLW-LD: Transition from long wet to long dry LD: Long dry TLD-SW: Transition from long dry to short wet SW: Short wet High mean CO2 fluxes were observed in the wetter than the dry season (Fig. 4). Soil moisture evidently provided soluble substrates and oxygen needed by soil microbes, which was coupled with the growth of dense and fibrous grass roots thus increasing root respiration. N2O fluxes were very low during both wet and dry seasons in all the sites ranging from -0.09 to 6 µg N m-2 h-1. This can be attributed low N soil content (about 0.07 %) recorded. 3) Soil GHG and Environmental Factors Soil moisture content was higher (14 to 25% ) in the wet season than in dry season (6 to 9% ) in all sites. CO2 showed a significant positive relationship with soil moisture. An increase in moisture at the onset of rain increased CO2 fluxes in the sites. Nonetheless, N2O did not show a significant relationship with soil moisture although fluxes slightly increased with at the onset of the wet season but then dropped. Soil temperature did not show a significant relationship with both CO2 and N2O fluxes. Fig. 5: Impact of soil moisture and soil temperature on (a) CO2, (b) N2O, (c) CH4. Conclusion Soil moisture is the main driver of soil CO2 emission in the study area. Soil CO2 emissions were higher in the wet season than in dry season from all the land use apart from the conservation area. Soil temperature on the other hand did not show a clear correlation. N2O fluxes were very low in all the sites both in wet and dry season. Low N2O from can be attributed to the low content of N observed. In farmland, this could also be due to low use organic and inorganic fertilizer as farmer only used small quantities of manure from their livestock throughout their planting season. However, there might be episodes of the emission that we missed, but which needs to be observed. There is a need for more continuous studies to cover spatial and temporal variations in soil emissions from diverse savannah landscape and land uses across seasonal and management gradients. References Arias-Navarro et al. (2013). Soil Biology and Biochemistry 67: 20–23. https://doi.org/10.1016/j.soilbio.2013.08.011. Collier et al. (2014). J. Vis. Exp. (90), e52110, doi:10.3791/52110. GOK (2010). National Climate Change Action Plan 2011-2012. Ministry of Environment and Mineral Resources, Nairobi, Kenya, Government of Kenya. Rochette, P. 2011. Animal Feed Science and Technology. https://doi.org/10.1016/j.anifeedsci.2011.04.063. Set up Gas pooling Samples Gas chromatography 1) Department of Geosciences and Geography, University of Helsinki, Finland 2) Institute for Atmosphere and Earth System Research, University of Helsinki, Finland 3) Mazingira Centre, International Livestock Research Institute (ILRI), Nairobi, Kenya 4) Department of Physical Geography and Ecosystem Science, Lund University, Sweden 5) School of Natural Resource and Environmental Management, University of Kabianga, Kericho, Kenya Funded by: E-mail: sheila.wachiye@helsinki.fi, petri.pellikka@helsinki.fi Email: sheila.wachiye@helsinki.fi Fig. 1: Study area in the lowlands of Taita Taveta County in southern Kenya. 1 2 3 4 Wet Dry Fig 5: Soil moisture across eight campaigns in all the sites. a b c