1_Introduction + EAM Vocabulary + how to navigate in EAM.pdf
87202001
1. International Journal of Research in Advent Technology, Vol.8, No.7, July 2020
E-ISSN: 2321-9637
Available online at www.ijrat.org
1
doi: 10.32622/ijrat.87202001
Abstract—Many students strive to attain excellence in
sport. However, talent identification and development
programs need uniformly accepted theoretical framework to
guide current practices. Find the talent in pre-adolescents,
more specific with students of social welfare schools. These
norms can be used to grade the students based on physical
fitness parameters. The constructed physical fitness norms
for “Social Welfare schools in Andhra Pradesh” for sports
talent identification and fitness development programmes.
Researcher has conducted a battery tests for 339 students
from 6th class to 10th class girl students of Social welfare
Schools of Andhra Pradesh who attended the summer camp
representing schools from urban and semi urban areas of
Andhra Pradesh. Selected physical fitness variables i.e.
Speed, strength, agility, flexibility. Test items were taken
from AAPHER youth fitness battery. Mean, standard
deviation and percentile were computed by using, “R-
Program”. The data indicates that the mean value 50mts run
of the 9th class students was best i.e. 9.12 seconds. The result
of the Bend & reach test indicates that the mean flexibility of
10th class students was recorded as highest followed by 8th
class. Medicine ball put indicates that the improvement of
performance among the classes was gradually progressive
from lower class to higher class. Standing broad jump results
indicate that there was positive increase in performance from
lower class to higher class except the students of 10th
standard. In the 6x10mts shuttle run, the data indicates that
there was a gradual improvement of performance from 6th to
9th class. The performance of 10 students was less than the
9th students. The vertical jump results indicated that there
was only a small improvement in the performance from 6th
and 7th class students and the increment was gradually
positive from 7th to 9th class and there was a decrease in
performance in case of 10th class students. The percentiles
were computed to provide a 10 point scale for each of the
variable for each of the class i.e. 6th, 7th, 8th, 9th and 10th
classes.
Index Terms—physical fitness norms, social welfare,
talent identification, medicine ball put.
Manuscript revised July 30, 2020 and published on August 10, 2020
S. Dileep Kumar, University College of Physical Education and Sports
Sciences, Acharya Nagarjuna University, Guntur, Andhra Pradesh, India.
Prof. Y. Kishore, University College of Physical Education and Sports
Sciences, Acharya Nagarjuna University, Guntur, Andhra Pradesh, India.
Dr. K. Sivananda, Sri Krishnadevaraya University, Ananthapuramu,
Andhra Pradesh, India.
I. INTRODUCTION
Talent is “an individual’s potential for success in a
domain”. Talent identification and development processes
are important components of many sports and games. Talent
is difficult to define and its identification may rely on
intuitive judgments. Many students strive to attain excellence
in sport. However, talent identification and development
programs need uniformly accepted theoretical framework to
guide current practices. Further, there is a need to develop
programs to grade the students on the basis of their physical
fitness.
This study helps to find the talent in pre-adolescents, more
specific with students of social welfare schools. Further,
these norms can be used to grade the students based on
physical fitness parameters.
II. STATEMENT OF THE PROBLEM
The purpose of the study was to construct physical fitness
norms for “Social Welfare schools in Andhra Pradesh” for
sports talent identification and fitness development
programmes.
A. Delimitations
The study was delimited in the following aspects.
➢ Only the girl students of classes 6th to 10th
were taken
as subjects.
➢ The study was conducted only for the students of
social welfare schools in Andhra Pradesh.
➢ The study was confined to develop physical fitness
norms.
B. Limitations
The study was limited in the following aspects.
➢ The parental back ground and socio-economic status
of the subjects were not considered for this study.
➢ The factors like food habits, weather conditions, diet,
life style and family back ground were beyond the
control of the investigator.
C. Objective of the study
The objective of the study was Construction of physical
fitness norms for girl students of social welfare schools in
Andhra Pradesh.
D. Significance of the study
This study helps the physical education teachers of social
welfare schools to assess the physical fitness level of the
students. Further, it helps the physical education teacher to
encourage the physically fit students to participate in
Construction of Physical Fitness Norms for Girl Students
of Social Welfare Schools in Andhra Pradesh- A Pilot
Study
Dileep Kumar Songa, Prof Y. Kishore and DrK. Sivananda
2. International Journal of Research in Advent Technology, Vol.8, No.7, July 2020
E-ISSN: 2321-9637
Available online at www.ijrat.org
2
doi: 10.32622/ijrat.87202001
competitive sports. Talented students can be identified
through these norms. Conduct of tests based on these
batteries gives opportunity for the students to know their
fitness levels and motivate them to improve their fitness
levels.
III. METHODOLOGY
Researcher has conducted a battery tests for 339 students.
Testers and the students were oriented before the conduct of
tests.
A. Selection of subjects:
In the present study, the researcher has chosen 6th
class to
10th
class girl students of Social welfare Schools of Andhra
Pradesh who attended the summer camp representing schools
from urban and semi urban areas of Andhra Pradesh.
B. Selection of variables
The following test items were chosen to test the physical
fitness variables i.e. Speed, strength, agility, flexibility. Test
items were taken from AAPHER youth fitness battery.
S.No. Physical Fitness test Units
1 50mts run Time (sec)
2 Bend & Reach Centimeters (cm)
3 M Ball Throw Centimeters (cm)
4 Standing Broad Jump Centimeters (cm)
5 6x10 shuttle run Time (sec)
6 Vertical Jump Centimeters (cm)
C. Collection of Data
Researcher has conducted the tests with the assistance of
physical education teachers and coaches. Researcher had
given orientation to the testers to conduct the tests. Standard
equipment was used to conduct the tests. The necessary
formats to record the data were provided to the testers.
Tester’s reliability was established by conducting test re test
method.
D. Instrument reliability
The equipment used was Stopwatches, Steel tapes, 1 kg
medicine ball, marking cones and stool. All the equipment
used was standard equipment.
E. Statistical procedure:
The raw data was collected by conducting the following
tests i.e. 50mts run, bend and reach test, medicine ball put,
standing broad jump, 6x10 shuttle run and vertical jump. The
data was pooled separately for each class i.e.6th
, 7th
, 8th, 9th
and 10th
class.
Mean, standard deviation and percentile were computed by
using, “R- Program”.
IV. ANALYSIS OF THE DATA AND RESULT OF THE
STUDY
The following tables and graphs explain the data.
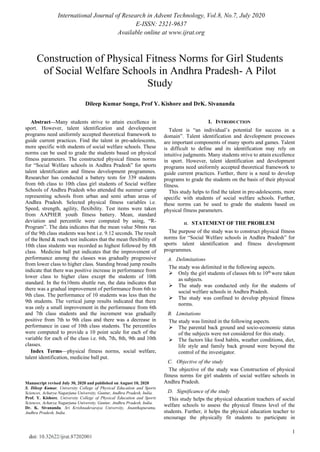
Table-1: Result Of 50mts Run
Class Variable n mean sd min max
6th 50mts (in sec) 71 9.89 0.79 8.04 11.97
7th 50mts (in sec) 78 9.83 9.73 8.05 12.75
8th 50mts (in sec) 82 9.42 9.32 8.01 11.88
9th 50mts (in sec) 91 9.12 9.02 7.05 11.29
10th 50mts (in sec) 17 9.33 9.22 8.01 11.68
Fig. 1. 50mts Run - Average of 6th
to 10th
class girl
students.
Table 2: Norms For 50mts Run Of All Classes
Mar
ks
6th Class 7th Class 8th class 9th class 10th class
Time in
sec
Time in
sec
Time in
sec
Time in
sec
Time in
sec
10 8.04 - 8.43 8.05 - 8.52 8.01 - 8.40 7.05 - 7.47 8.01 - 8.38
9 8.44 - 8.83 8.53 - 8.99 8.41 - 8.78 7.48 - 7.90 8.39 - 8.74
8 8.84 - 9.22 9.00 - 9.46 8.79 - 9.17 7.91 - 8.32 8.75 - 9.11
7 9.23 - 9.61 9.47 - 9.93 9.18 - 9.56 8.33 - 8.75 9.12 - 9.48
6
9.62 -
10.01
9.94 -
10.40
9.57 - 9.95 8.76 - 9.17 9.49 - 9.85
5
10.02 -
10.40
10.41 -
10.87
9.96 -
10.33
9.18 - 9.59
9.86 -
10.21
4
10.41 -
10.79
10.88 -
11.34
10.34 -
10.72
9.60 -
10.02
10.22 -
10.58
3
10.80 -
11.18
11.35 -
11.81
10.73 -
11.11
10.03 -
10.44
10.59 -
10.95
2
11.19 -
11.58
11.82 -
12.28
11.12 -
11.49
10.45 -
10.87
10.96 -
11.31
1
11.59 -
11.97
12.29 -
12.75
11.50 -
11.88
10.88 -
11.29
11.32 -
11.68
Table-3: Result of Bend & Reach
Class Variable n mean sd min max
6th Bend & Reach(cms) 71 4.775 3.59 0 14
7th Bend & Reach(cms) 78 5.35 3.82 0 14
8th Bend & Reach(cms) 82 7.549 4.48 0 18
9th Bend & Reach(cms) 91 7.286 4.15 0 18
10th Bend & Reach(cms) 17 8.059 3.85 1 16
3. International Journal of Research in Advent Technology, Vol.8, No.7, July 2020
E-ISSN: 2321-9637
Available online at www.ijrat.org
3
doi: 10.32622/ijrat.87202001
Fig. 2.Bend & Reach - Average of 6th
to 10th
class girl
students.
Table-4: Norms for Bend and Reach
Marks
6th Class 7th Class 8th class 9th class
10th
class
Distance
in cm
Distance
in cm
Distance
in cm
Distance
in cm
Distance
in cm
10 13-14 13-14 17-18 18 - 16.2 16 - 14.5
9 12 12 15-16
16.2 -
14.4
14.5 - 13
8 10-11 10-11 13-14
14.4 -
12.6
13 - 11.5
7 9 9 11-12
12.6 -
10.8
11.5 - 10
6 8 8 10 10.8 - 9 10 - 8.5
5 6-7 6-7 8-9 9 - 7.2 8.5 - 7
4 5 5 6-7 7.2 - 5.4 7 - 5.5
3 3-4 3-4 4-5 5.4 - 3.6 5.5 - 4
2 2 2 2-3 3.6 - 1.8 4 - 2.5
1 1 1 1 1.8 - 0 2.5 - 1
Table-5: Result of Medicine Ball Put
Class Variable n mean sd min max
6th Medicine Ball put(cms) 71 281.5 57.18 105 435
7th Medicine Ball put(cms) 78 337.1 72.43 210 575
8th Medicine Ball put(cms) 82 376.2 67.45 222 535
9th Medicine Ball put(cms) 91 403.5 68.26 226 564
10th Medicine Ball put(cms) 17 438.8 60.3 326 580
Fig. 3. Medicine ball put - Average of 6th
to 10th
class
girl students.
Table-6: Norms for Medicine Ball Put
Marks
6th Class 7th Class 8th class 9th class 10th class
Distance
in cm
Distance
in cm
Distance
in cm
Distance
in cm
Distance
in cm
10 402-435 539-575 504-535 530-564 555-580
9 369-401 502-538 472-503 497-531 530-554
8 336-368 466-502 441-471 463-496 504-529
7 303-335 429-465 410-440 429-462 478-503
6 270-302 393-428 379-409 395-428 453-477
5 237-269 356-392 347-378 361-395 428-452
4 204-236 320-355 316-346 327-360 402-427
3 171-203 283-319 285-315 294-326 377-401
2 138-170 247-282 253-284 260-293 351-376
1 105-137 210-246 222-252 226-259 326-350
Table-7: Result of Standing Broad Jump
Class Variable n mean sd min max
6th Standing Broad jump(cms) 71 141.4 19.78 105 185
7th Standing Broad jump(cms) 78 147.8 24.25 100 220
8th Standing Broad jump(cms) 82 154.8 20.98 100 200
9th Standing Broad jump(cms) 91 160.3 20.29 115 210
10th Standing Broad jump(cms) 17 157.4 24.27 100 195
Fig. 4. Standing Broad Jump - Average of 6th
to 10th
class girl students.
Table-8: Norms for Standing Broad Jump
Mar
ks
6th Class 7th Class 8th class 9th class 10th class
Distance
in cm
Distance
in cm
Distance
in cm
Distance
in cm
Distance
in cm
10 178-185 209-220 191-200 202-210 186-195
9 169-177 197-208 181-190 192-201 177-185
8 161-168 185-196 171-180 183-191 167-176
7 153-160 173-184 161-170 173-182 158-166
6 145-152 161-172 151-160 164-172 148-157
5 137-144 149-160 141-150 154-163 139-147
4 129-136 137-148 131-140 145-153 129-138
3 121-128 125-136 121-130 135-144 120-128
2 113-120 113-124 111-120 126-134 111-119
4. International Journal of Research in Advent Technology, Vol.8, No.7, July 2020
E-ISSN: 2321-9637
Available online at www.ijrat.org
4
doi: 10.32622/ijrat.87202001
1 105-112 100-112 100-110 115-125 100-110
Table-9: 6 X 10 Shuttle Run
Class Variable n mean sd min max
6th Shuttle run(in sec) 71 20.09 20.04 17.88 23.72
7th Shuttle run(in sec) 78 19.79 19.74 17.78 22.77
8th Shuttle run(in sec) 82 19.48 19.43 17.28 22.96
9th Shuttle run(in sec) 91 19.09 19.04 16.94 24.5
10th Shuttle run(in sec) 17 19.50 19.46 17.6 22.41
Fig. 5. Shuttle Run - Average of 6th
to 10th
class girls
students.
Fig. 6. Vertical Jump - Average of 6th
to 10th
class girls
students.
Table-10: Norms For 6x10mts Shuttle Run
Mar
ks
6th Class 7th Class 8th class 9th class 10th class
Time in
sec
Time in
sec
Time in
sec
Time in
sec
Time in
sec
10
17.88 -
18.46
17.78 -
18.28
17.28 -
17.85
16.94 -
17.70
17.6 -
18.08
9
18.47 -
19.05
18.29 -
18.78
17.86 -
18.42
17.71 -
18.45
18.09 -
18.56
8
19.06 -
19.63
18.79 -
19.28
18.43 -
18.98
18.46 -
19.21
18.57 -
19.04
7
19.64 -
20.22
19.29 -
19.78
18.99 -
19.55
19.22 -
19.96
19.05 -
19.52
6
20.23 -
20.80
19.79 -
20.27
19.56 -
20.12
19.97 -
20.72
19.53 -
20.01
5
20.81 -
21.38
20.28 -
20.77
20.13 -
20.69
20.73 -
21.48
20.02 -
20.49
4
21.39 -
21.97
20.78 -
21.27
20.70 -
21.26
21.49 -
22.23
20.50 -
20.97
3
21.98 -
22.55
21.28 -
21.77
21.27 -
21.82
22.24 -
22.99
20.98 -
21.45
2
22.56 -
23.14
21.78 -
22.27
21.83 -
22.39
23.00 -
23.74
21.46 -
21.93
1
23.15 -
23.72
22.28 -
22.77
22.40 -
22.96
23.75 -
24.5
21.94 -
22.41
Table-11: Result of Vertical Jump
Class Variable n Mean sd min max
6th Vertical jump(cms) 71 21.61 5.3 2 33
7th Vertical jump(cms) 78 21.78 5.12 11 35
8th Vertical jump(cms) 82 23.35 5.7 10 40
9th Vertical jump(cms) 91 25.02 4.76 13 41
10th Vertical jump(cms) 17 24.82 7.5 12 45
Table-12: Norms for Vertical Jump
Mar
ks
6th Class 7th Class 8th class 9th class 10th class
Distance
in cm
Distance
in cm
Distance
in cm
Distance
in cm
Distance
in cm
10 30- 33 32.7- 35 38-40 38.3 - 41.0 41.8 - 45.0
9 26.9 - 29.9 30.3 - 32.6 35-37 35.5 - 38.2 38.5 - 41.7
8 23.8 - 26.8 27.9 - 30.2 32-34 32.7 - 35.4 35.2 - 38.4
7 20.7 - 23.7 25.5 - 27.8 29-31 29.9 - 32.6 31.9 - 35.1
6 17.6 - 20.6 23.1 - 25.4 26-28 27.1 - 29.8 28.6 - 31.8
5 14.5 - 17.5 20.7 - 23 23-25 24.3 - 27.0 25.3 - 28.5
4 11.4 - 14.4 18.3 - 20.6 20-22 21.5 - 24.2 22.0 - 25.2
3 8.3 - 11.3 15.9 - 18.2 17-19 18.7 - 21.4 18.7- 21.9
2 5.2 - 8.2 13.5 - 15.8 14- 16 15.9 - 18.6 15.4 - 18.6
1 2 - 5.1 11 -13.4 10-13 13 - 15.8 12 - 15.3
V. DISCUSSION AND CONCLUSIONS
Literature indicates that the physical fitness level depends
on lifestyle, food habits, culture, heredity and geographical
conditions and other factors. Sports Authority of India has
developed physical fitness norms to identify the sports talent.
But when they are used for the normal students, very few
students are reaching the norms and the remaining students
are getting disappointed. For classification of general
students, these norms are not conducive. Hence an attempt
was made to conduct study on social welfare school students.
The data indicates that the mean value 50mts run of the 9th
class student’s was best i.e. 9.12 seconds. The result of the
Bend & reach test indicates that the mean flexibility of 10th
class students was recorded as highest followed by 8th
class.
The explosive strength of arms tested through medicine ball
put indicates that the improvement of performance among the
classes was gradually progressive from lower class to higher
class. Standing broad jump results indicate that there was
gradual variation with a positive increase in performance
from lower class to higher class except the students of 10th
standard.
In the 6x10mts shuttle run, the data indicates that there was
a gradual improvement of performance from 6th
to 9th
class.
The performance of 10 students was less than the 9th
students.
The explosive strength of legs was measured with vertical
jump and the result indicated that there was only a small
improvement in the performance from 6th
and 7th
class
students and the increment was gradually positive from 7th
to
5. International Journal of Research in Advent Technology, Vol.8, No.7, July 2020
E-ISSN: 2321-9637
Available online at www.ijrat.org
5
doi: 10.32622/ijrat.87202001
9th
class and there was a decrease in performance in case of
10th
class students.The percentiles were computed to provide
a 10 point scale for each of the variable for each of the class
i.e. 6th
, 7th
, 8th
, 9thand 10th
classes.
CONFLICT OF INTEREST
Yes, Researcher done study with interest only. Last three
years Andhra Pradesh government was conducted sports
school admission entrance test. Through physical fitness
selected students will join the sports schools. Sports
Authority of India constructed some norms for selection
purpose. Last three years no one can reach the norms. So I
interested to know the present physical fitness level of
Andhra Pradesh Children.
REFERENCES
[1]. Baljinder Singh Bal, Gagandeep Singh, Kamal Kishore, Surinder
Sing (2018). “Construction of physical fitness test items norms of
taekwondo players of guru nanakdev university, Amritsar,
India”. Volume 5 │ Issue 1 63-70.
[2]. Brown, L.E. & Weir, J.P. (2001). ASEP procedures
recommendations for the accurate assessment of muscular
strength and power. Online Journal of Exercise Physiology.
4(3):1- 21.
[3]. Jyothilakshmi K “Construction of physical fitness norms for
junior and senior high school boys and girls of Andhra Pradesh”
PhD.Thesis, Dept. Physical Education, Tamilnadu Physical
Education and Sports University, India, 2016.
[4]. Mahendrasinh K Mandora (2016) Associate Professor
Department of Physical Education. “Construction of Physical
Fitness Norms for College Students of Gujarat State”,
International Journal of Multidisciplinary Allied Research
Review and Practices, Volume 3, Issue 4, IJMARRP Page 532.
[5]. Ramesh, Physical Director, (May 2019), “Construction of
Physical fitness norms for 13-15 years high school boys”.
International Journal of innovative Science and Research
Technology, ISSN: 2456-2165 Volume 4, Issue 5
page-1009-1011.
[6]. Surinder Singh, Gurjit Singh, Baljinder Singh Bal (2018).
“Norm’s construction for Physical fitness test items of handball
payers”. IJPNPE 2018; 3(1): 2015-2018.
[7]. Yuvraj Singh Dasondhin and Dr. Ajay Karkare (2016), Strength
& Conditioning Coach, Vidarbha Cricket Association Academy,
VCA Stadium, Civil Lines, Nagpur, Maharashtra, India,
“Construction of Physical Fitness Test Norms for Under 16
Cricketers in Central Zone”, PARIPEX - INDIAN JOURNAL
OF RESEARCH, January, 138.
AUTHORS PROFILE
Dileep Kumar Songa received his M.P.Ed in
University College of Physical Education & Sports
sciences, Acharya Nagarjuna University& Master
of Sciences (Sports Technology and Health
Sciences) from Jawaharlal Nehru Technological
University, Kakinadaand he is presently pursuing
Ph.D in the College of Physical Education and
Sports Sciences. Has 4 years of experience in the
field of Physical Education and Sports Sciences.
Prof. Y. Kishore (Rtd.) received his M.P.Ed in
Bangalore University and he has awarded his
Ph.D. in Bangalore University, Later on appointed
has Asst. Prof., Associate Prof., Professor and
Dean Faculty of Physical Education, Yoga &
Sports Sciences, EC Member and Registrar of
Acharya Nagarjuna University.Has a 30 Years of
Experience in the field of Physical Education and
Sports Sciences.
Dr. K. Sivananda received M.P.Ed and Ph.D. in
Department of Physical Education and Sports
Sciences, Sri Krishnadevaraya
University.Working as Assistant Professor
University College of Education, Sri
Krishnadevaraya University.Has 5 years of
experience in the field of Physical Education.