
Empfohlen
Empfohlen
Weitere ähnliche Inhalte
Ähnlich wie Extra
Ähnlich wie Extra (20)
Mehr von IFSD14
Mehr von IFSD14 (20)
Kürzlich hochgeladen
Kürzlich hochgeladen (20)
Extra
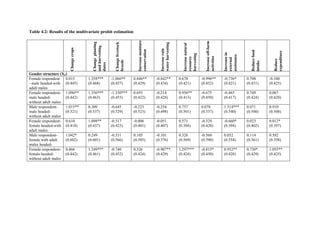
- 1. Table 4.2: Results of the multivariate probit estimation Changecrops Changeplanting andharvesting dates Changelivestock breeds Increasemoisture conservation Increaserain waterharvesting Increasenatural resource harvesting Increaseoff-farm activities Increasein external assistance Reducefood intake Reduce expenditure Gender structure (X1) Female respondent - male headed-with adult males 0.015 (0.445) 1.358*** (0.468) -1.066** (0.457) 0.846** (0.429) -0.842** (0.434) 0.670 (0.421) -0.996** (0.452) -0.736* (0.421) 0.708 (0.431) -0.340 (0.425) Female respondent- male headed- without adult males 1.096** (0.442) 1.356*** (0.463) -1.330*** (0.453) 0.693 (0.422) -0.214 (0.428) 0.956** (0.413) -0.675 (0.450) -0.465 (0.417) 0.749 (0.424) 0.067 (0.420) Male respondent- male headed- without adult males 1.015** (0.521) 0.309 (0.537) -0.645 (0.529) -0.223 (0.523) -0.254 (0.498) 0.757 (0.501) 0.078 (0.537) 1.514*** (0.540) 0.071 (0.500) 0.910 (0.508) Female respondent- female headed-with adult males 0.610 (0.418) 1.098** (0.437) -0.317 (0.423) -0.006 (0.401) -0.051 (0.407) 0.571 (0.384) -0.329 (0.428) -0.660* (0.394) 0.023 (0.402) 0.012* (0.397) Male respondent- female with adult males headed- 1.042* (0.602) 0.249 (0.601) -0.531 (0.566) 0.105 (0.585) -0.101 (0.576) 0.326 (0.569) -0.560 (0.590) 0.052 (0.554) 0.114 (0.561) 0.592 (0.558) Female respondent- female headed- without adult males 0.466 (0.442) 1.249*** (0.461) -0.740 (0.452) 0.326 (0.424) -0.907** (0.429) 1.297*** (0.424) -0.815* (0.450) 0.952** (0.428) 0.730* (0.429) 1.055** (0.425)
- 2. Table 4.2(continued) Changecrops Change plantingand harvesting dates Change livestock breeds Increase moisture conservation Increaserain water harvesting Increase natural resource harvesting Increaseoff- farm activities Increasein external assistance Reducefood intake Reduce expenditure Climate variables(X2) Moderate increase in dry- spells 0.536** (0.273) 0.363 (0.263) 0.891*** (0.271) 0.762*** (0.275) 0.883*** (0.276) 0.679** (0.290) -0.188 (0.269) 0.268 (0.274) 0.691*** (0.264) 0.267 (0.262) Extreme increase in dry- spells -0.340 (0.259) 0.232 (0.254) -0.535* (0.281) -0.273 (0.268) 0.246 (0.255) 0.146 (0.259) 0.281 (0.278) 0.945*** (0.271) 0.658*** (0.253) 0.492* (0.258) Mild increase in wet- spells 0.103 (0.262) 0.586** (0.268) -0.180 (0.278) -0.236 (0.262) 0.178 (0.261) 0.341 (0.287) -0.636** (0.265) 0.069 (0.281) 0.377 (0.257) -0.434 (0.264) Moderate increase in wet- spells 0.955** (0.279) 0.975*** (0.290) 1.312*** (0.294) -0.005 (0.271) 0.352 (0.270) -0.012 (0.281) -0.804*** (0.274) -0.147 (0.292) 0.551** (0.270) -0.351 (0.274) Extreme increase in wet- spells 0.366 (0.278) 0.200 (0.270) 0.436 (0.281) -0.329 (0.279) -0.420 (0.276) 0.394 (0.288) -0.934*** (0.278) -0.445 (0.311) 0.444 (0.271) 0.499* (0.274) High temperature -0.187 (0.222) -0.103 (0.219) -0.056 (0.234) 0.513** (0.229) 0.055 (0.220) -0.299 (0.228) 0.102 (0.230) -0.015 (0.230) 0.489** (0.216) -0.339 (0.220) Capital stocks(X3) Education 0.046** (0.022) 0.002 (0.022) -0.003 (0.022) 0.055** (0.021) -0.027 (0.022) 0.058** (0.023) -0.016 (0.021) 0.024 (0.023) -0.017 (0.021) 0.003 (0.021) Skillfulness 0.110 (0.170) -0.142 (0.171) -0.075 (0.176) 0.013 (0.172) -0.014 (0.168) -0.015 (0.180) 0.303* (0.170) -0.302* (0.181) 0.168 (0.167) -0.101 (0.170) Social capital -0.073 (0.091) 0.011 (0.090) 0.012 (0.093) 0.159* (0.090) 0.023 (0.091) 0.015 (0.097) 0.006 (0.090) -0.139 (0.097) 0.101 (0.090) 0.072 (0.090) Physical capital 0.525** (0.228) 0.498** (0.231) -0.343 (0.233) -0.145 (0.220) 0.582** (0.227) 0.273 (0.240) 0.150 (0.225) 0.373 (0.227) 0.145 (0.215) 0.231 (0.219) Table 4.2 (continued)
- 3. Changecrops Changeplanting andharvesting dates Changelivestock Increasemoisture conservation Increaserain waterharvesting Increasenatural resource harvesting Increaseoff-farm activities Increasein externalassistance Reducefood intake Reduce expenditure Natural capital 0.231*** (0.071) -0.066 (0.071) -0.051 (0.072) 0.214*** (0.071) 0.116* (0.068) 0.161** (0.076) -0.028 (0.070) -0.077 (0.072) -0.008 (0.068) -0.150** (0.068) Risk aversion (X4) Risk 0.002 (0.059) -0.090 (0.059) -0.025 (0.060) -0.048 (0.058) 0.044 (0.058) 0.037 (0.060) 0.042 (0.058) 0.068 (0.062) 0.056 (-0.620) 0.162*** (0.057) Health status(X5) Health status -0.210 (0.177) 0.330* (0.177) -0.122 (0.179) 0.126 (0.174) -0.226 (0.172) 0.378** (0.182) -0.355** (0.171) 0.339* (0.181) 0.171 (0.710) 0.247 (0.173) Demographics(X6) Number of female children -0.131 (0.145) -0.101 (0.143) 0.064 (0.148) 0.097 (0.144) -0.110 (0.142) 0.368** (0.161) 0.151 (0.142) -0.160 (0.151) 0.141 (-1.610) 0.025 (0.145) Number of male children 0.059 (0.114) -0.120 (0.113) -0.206 (0.114) -0.027* (0.111) -0.062 (0.110) 0.208* (0.123) 0.074 (0.109) -0.003 (0.112) 0.110 (-0.400) -0.139 (0.109) Household size 0.014 (0.042) 0.023 (0.043) 0.014 (0.044) 0.011 (0.042) 0.001 (0.042) -0.035 (0.045) 0.006 (0.043) 0.108** (0.045) 0.042 (1.190) 0.112** (0.043) Age 0.014** (0.007) 0.004 (0.007) -0.001 (0.007) 0.021*** (0.007) -0.001 (0.007) -0.001 (0.007) -0.007 (0.007) 0.010 (0.007) 0.006 (-0.330) 0.000 (0.007) Constant -1.575** (0.733) -0.687 (0.747) 0.317 (0.741) -2.150*** (0.730) 0.832 (0.725) -0.848 (0.737) 1.573** (0.747) -1.286 (0.759) 0.710 (-0.410) -0.907 (0.721) N 326 326 326 326 326 326 326 326 326 326 Note: Note. 1) Single asterisk (*) indicates significance at the 10% level, double asterisk (**) indicates significance at the 5% level and triple asterisk (***) indicates significance at the 1% level; 2) Standard errors are reported in parentheses; 3) Baseline model is specified as a probit model without random intercept and its interactions.
- 4. Appendix A: Construction of capital stock variables using Principle Component Analysis (PCA) Index variables for physical and social capital are derived using principal component analysis (PCA). The physical assets index is derived from 17 physical asset characteristics (see Table A1). The PCA generates factor scores for each asset characteristic. The factor scores are computed by assuming a regression method based on uncorrelated rotated factors. The 17 factors are standardized to zero mean and unit variance. Table A1 shows factor scores from factor 1, which is the factor that explained most of the variation in the asset characteristics. Factor 1 is used to generate the physical asset index. The physical asset index is generated by weighting the asset characteristics with the scoring coefficient and adding them up.
- 5. Table A1 Descriptive statistics and scoring coefficients for retained factors of the variables included in the PCA model for physical assets Physical Capital Factors N Mean Std. Dev Min Max Factor 1 Scores Do you have a kraal? 340 0.9 0.296 0 1 0.378 Do you have a car? 340 0.0559 0.23003 0 1 0.365 Do you own a bicycle? 340 0.0235 0.1518 0 1 -0.104 Do you own a cell? 340 0.8794 0.32613 0 1 0.514 Do you own a TV? 340 0.5059 0.5007 0 1 0.82 Do you own a radio? 340 0.5235 0.50018 0 1 0.397 Do you own a DVD? 340 0.3441 0.47578 0 1 0.697 Do you own a stove? 340 0.5912 0.49234 0 1 0.699 Do you own a fridge? 340 0.4676 0.49969 0 1 0.792 Do you own a plough? 340 0.1324 0.33937 0 1 -0.327 Do you own a cart? 340 0.0618 0.24108 0 1 -0.2 Do you own a bed? 340 0.9824 0.13186 0 1 0.007 Do you own a solar panel? 340 0.0647 0.24637 0 1 0.035 Do you own a sewing machine? 340 0.0676 0.62269 0 11 -0.101 Do you own a jojo tank? 340 0.2059 0.40494 0 1 -0.13 Do you own a wheelbarrow? 340 0.2941 0.45632 0 1 0.131 Do you own a generator? 340 0.2824 0.45081 0 1 0.561 The social capital index is generated using the same procedure as for the physical assets index. The social capital index is derived from 21 variables that measure social capital. Table A2 presents descriptive statistics for the scoring coefficients for retained factors of the variables included in the PCA model for social capital.
- 6. Table A2 Descriptive statistics and scoring coefficients for retained factors of the variables included in the PCA model for social capital Social Capital Factors N Mean Std. Dev. Min Max Factor 1 Scores How long have you been established in this village? 340 4.61 1.522 1 7 -0.129 Does anyone in this household take part in community decision making? 340 2.37 0.858 1 3 0.135 Is household involvement in community activities L/S/M compared to 10 yrs ago? 340 1.76 0.97 1 3 0.186 Do you have free access to human rights advice? 340 0.19 0.389 0 1 0.444 Do you have free access to legal advice? 340 0.18 0.384 0 1 0.311 Do you have free access to medical advice? 340 0.62 0.487 0 1 0.409 Do you have free access to veterinary advice? 340 0.2 0.403 0 1 0.542 Do you have free access to medical advice? 340 0.22 0.417 0 1 0.569 Do you have free access to building advice? 340 0.12 0.326 0 1 0.519 Do you have free access to schooling advice? 340 0.21 0.407 0 1 0.588 Do you have free access to moving/relocating advice? 340 0.04 0.192 0 1 0.448 Do you have free access to market/business advice? 340 0.1 0.296 0 1 0.592 Do you have free access to credit/financial advice? 340 0.17 0.374 0 1 0.494 People around here are willing to help their neighbors. 340 3.21 0.751 1 4 0.291 This is a close-knit or ‘tight’ neighborhood where people generally know one another? 340 3.19 0.914 1 4 0.389
- 7. Table A2 (Continued) Social Capital Factors N Mean Std. Dev. Min Max Factor 1 Scores If I had to borrow R50 in an emergency, I could borrow it from a neighbor 340 3.1 1.036 1 4 0.22 People in this neighborhood generally get along with each other 340 3.14 0.822 1 4 0.241 People in this neighborhood can be trusted 340 2.71 0.983 1 4 0.209 If I were sick I could count on my neighbors to shop for groceries for me 340 3.14 0.787 1 4 0.236 People in this neighborhood share the same beliefs, culture and values 340 2.94 1.143 -5 4 -0.202 A summary of the PCA scoring criteria used to generate the physical and social capital indices is presented in Table A3. As mentioned, the indices are based on component one scores, which explain the greatest amount of variation in factors.
- 8. Table A3 Components extracted from Principal Component Analysis and proportion of variation in factors explained by components. Physical capital Index Social capital Index Component Eigen value Proportion Cumulative % Eigen value Proportion Cumulative % 1 3.215 17.863 17.863 2.821 14.104 14.104 2 2.078 11.547 29.411 2.318 11.588 25.692 3 1.677 9.314 38.725 2.008 10.04 35.732 4 1.573 8.738 47.463 1.583 7.917 43.648 5 1.33 7.39 54.852 1.42 7.098 50.746 6 1.242 6.9 61.753 1.143 5.714 56.459
- 9. Appendix B: Risk aversion questions Suppose that your family income (cash and in-kind) that you get from your livelihood activities is guaranteed for every year for life. An extension agent comes and gives you an opportunity to adopt a new technology that would change your income. There is a 50-50 chance that this new technology will double your family income and a 50-50 chance that it will cut your family income by a third. Would you adopt this new technology, Yes or No? If the answer is ‘‘no,’’ please answer the following question (Gamble 2): Suppose the chances were 50-50 that the new technology would double your family income and 50-50 chances that it would cut it by 20 percent. Would you adopt this new technology, Yes or No? If the answer to the first question is ‘‘yes,’’ please answer the following question (Gamble 3): Suppose the chances were 50-50 that the new technology would double your family income and 50-50 that it would cut it by half. Would you adopt this new technology, Yes or No? These three questions allow categorization of respondents into four groups. Respondents who answered ‘‘no’’ to both questions: very strongly risk averse Respondents who answered ‘‘yes’’ to both questions: weakly risk averse Respondents who answered ‘‘no’’ to the first question but ‘‘yes’’ to the second: strongly risk averse Those who answered ‘‘yes’’ to the first question and ‘‘no’’ to the second: moderately risk averse