POSHAN District Nutrition Profile_Lucknow_Uttar Pradesh
•
0 likes•377 views

POSHAN District Nutrition Profiles (DNPs) draw on diverse sources of data to compile a set of indicators on the state of nutrition and its cross-sectoral determinants. The profiles are intended to be conversation-starters at the district level and to enable discussions about why undernutrition levels are high, and which factors, at multiple levels, might need to be addressed to improve nutrition. PLEASE NOTE that POSHAN is regularly tracking data sources as they are released and updating the profiles accordingly.

Recommended
Recommended
More Related Content
What's hot
What's hot (20)
Viewers also liked
Viewers also liked (14)
Similar to POSHAN District Nutrition Profile_Lucknow_Uttar Pradesh
Similar to POSHAN District Nutrition Profile_Lucknow_Uttar Pradesh (20)
More from POSHAN
More from POSHAN (20)
Recently uploaded
Recently uploaded (20)
POSHAN District Nutrition Profile_Lucknow_Uttar Pradesh
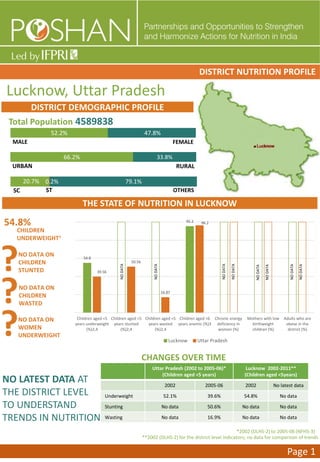
- 1. 54.8 95.2 39.56 50.56 16.87 96.2 Children aged <5 years underweight (%)2,4 Children aged <5 years stunted (%)2,4 Children aged <5 years wasted (%)2,4 Children aged <6 years anemic (%)3 Chronic energy deficiency in women (%) Mothers with low birthweight children (%) Adults who are obese in the district (%) Lucknow Uttar Pradesh Lucknow, Uttar Pradesh DISTRICT NUTRITION PROFILE Page 1 THE STATE OF NUTRITION IN LUCKNOW DISTRICT DEMOGRAPHIC PROFILE Total Population 4589838 MALE FEMALE RURALURBAN SC ST OTHERS CHANGES OVER TIME **2002 (DLHS-2) for the district level indicators; no data for comparison of trends *2002 (DLHS-2) to 2005-06 (NFHS-3) Uttar Pradesh (2002 to 2005-06)* (Children aged <5 years) Lucknow 2002-2011** (Children aged <5years) 2002 2005-06 2002 No latest data Underweight 52.1% 39.6% 54.8% No data Stunting No data 50.6% No data No data Wasting No data 16.9% No data No data NO DATA ON CHILDREN STUNTED NO DATA ON CHILDREN WASTED NO DATA ON WOMEN UNDERWEIGHT CHILDREN UNDERWEIGHT4 54.8% 52.2% 47.8% 20.7% 0.2% 79.1% 66.2% 33.8% NODATA NO LATEST DATA AT THE DISTRICT LEVEL TO UNDERSTAND TRENDS IN NUTRITION NODATA NODATA NODATA NODATA NODATA NODATA NODATA
- 2. 6.0% 9.9% 52.4% 42.5% 8.8% 60.5% 7.1% 46.9% 56.2% 11.2% 30.3% 11.5% 16.2% 17.4% 58.1% Early initiation of breastfeeding Exclusive breastfeeding Children between 6-8 mo who received any solid/semi solid food in the last 24 hours Children who achieve minimum diet diversity Full immunization coverage Children (12- 35mo) who got vitamin A supplementation Acute diarrhoea in children <2 years in previous 2 weeks Children <5 years with diarrhoea treated to ORS Women aware of danger signs of pneumonia 84.7% 96.7% 96.2% 64.4% 95.8% 97.8% Women with access to antenatal care coverage Anemia among pregnant women Anemia among adolescent girls Lucknow Uttarpradesh Page 2 Child undernutrition is caused by inadequacies in food, health and care for infants and young children, especially in the first two years of life (immediate causes). Inadequate food, health and care arise from food insecurity, unsanitary living conditions, low status of women, and poor health care (underlying causes). These are, in turn, caused by social inequity, economic challenges, poor political will and leadership to address these causes (basic causes). Interventions to address undernutrition must address these multiple causes of undernutrition and do so in an equitable manner. IMMEDIATE CAUSES OF UNDERNUTRITION Areas for immediate action: Data challenges: • Outdated data; poor availability of data on key immediate determinants of undernutrition • Where data are available, indicator definitions are non- standardized and often differ from World Health Organization recommendations • Poor state of infant and young child feeding (IYCF): low rates of exclusive breastfeeding and timely initiation of breastfeeding • Need to improve immunisation rates to cover complete target population • Alarming levels of anaemia among pregnant women and adolescent girls IMMEDIATE CAUSES Breastfeeding, nutrient rich foods, and eating routine Feeding and caregiving practices, parenting stimulation Low burden of infectious diseases Optimum fetal and chid nutrition and development WHAT FACTORS CAUSE UNDERNUTRITION? 7 UNDERLYING CAUSES Food security: availability, economic access and use of food Feeding and caregiving resources (maternal, household and community level) Access to and use of health services, a safe and hygienic environment BASIC CAUSES Knowledge and evidence Politics and governance Leadership, capacity and financial resources Social, economic, political, and environmental context (national and global) The most crucial period for child nutrition is from pre-pregnancy to the second year of life WHEN TO INTERVENE TO IMPROVE NUTRITION? NODATA ADOLESCENT & MATERNAL HEALTH3,6 DISEASE INCIDENCE5,6IMMUNISATION & SUPPLEMENTATION6 INFANT & YOUNG CHILD FEEDING2,5 0 20 40 60 80 100 Percentageofchildstunting(%) Age of child (in months) Too late Window of opportunity NODATA NODATA
- 3. 45.5% 22.8% 15.2% 3.1% 11.2% 49.1% 23.8% 19.5% 3.7% 29% Household share of expenditure on food Household share of food expenditure on cereals Household share of food expenditure on milk Household share of food expenditure on eggs/fish/meat Households in the district involved in agriculture Food Security8 Page 3 UNDERLYING CAUSES OF UNDERNUTRITION BASIC CAUSES OF UNDERNUTRITION Areas for immediate action: • Very poor availability of data on indicators of women’s status; low standard of living for women is related to poor health and nutrition outcomes of babies • Food insecurity, especially diet quality, is a challenge that can hold back improvements in nutrition Data challenges: • No district level data available on mothers’ schooling, land ownership or hygiene indicators. • Difficult to compare indicators of water, sanitation and hygiene over time as census data do not provide data on child stool disposal or on hand washing • District domestic product of Lucknow:10 17885.5 (in Rs. Crores) • Access to services can be improved but data on access are also poor1,6 (see figure on right) • Governance and political will to address nutrition No Data State domestic product of Uttar Pradesh : 423261.46 (in Rs. Crores) 30.0% 91.5% 31.1% 92.4% 72.0% 50.8% 83.3% 44.4% 100.0% 74.7% Births attended by skilled health personnel Household has access to Anganwadi Worker Household has access to a Sub Health Centre Household has access to Primary/Middle School Access to NREGA Households availing Bank services Lucknow Uttar Pradesh No data available NoData 18.2% 32.9% 8.6% 11.3% Girls married when <18years old Ever married women/mothers who completed primary school Women who completed secondary school Women's ownership of land Women's ownership of livestock Women's Status6 NoData NoData 94.0% 62.8% 32.2% 88.6% 31.4% 63.0% 22.97% Access to improved drinking-water sources Access to improved sanitation facilities Open defecation Child stool disposal in a sanitary manner Households who washed hands with soap before a meal Water Sanitation & Hygiene (WaSH)1,2 78.7% 70.8% 29.4% 64.9% 36.8% Below Poverty Line households Households ownership of agricultural land Households in a permanent house Access to electricity Poverty1,9 68.1% 57.3% Adult Literacy Rate (%) OtherIndicators1 NoData NoData NoData NoData NoData NoData NoData NoData NoData
- 4. This District Nutrition Profile was developed by Shruthi Cyriac for POSHAN. This version, dated July 25, 2014 is a draft intended for use in a district-level workshop in Lucknow, Uttar Pradesh, and will be revised following workshop discussions. WHAT WILL IT TAKE TO IMPROVE NUTRITION IN LUCKNOW? Source:UNICEFIndia/2010/GrahamCrouch Possible district-levels actions to support nutrition: Data sources 1. Census of India 2011, accessed on June 20, 2014, http://censusindia.gov.in/ 2. National Family Health Survey-3 dataset 3. District Level Health Survey-2 (2002-04) Nutrition Report, accessed on August 1, 2014, http://www.rchiips.org/PRCH- 2.html 4. District Level Health Survey-2 dataset 5. District Level Health Survey-2 (2002-04) State Report, accessed on August 1, 2014, http://www.rchiips.org/PRCH-2.html 6. District Level Health Survey-3 (2007-08), accessed on August 1, 2014, http://www.rchiips.org/PRCH-3.html 7. The politics of reducing malnutrition: building commitment and accelerating progress. S Gillespie, L Haddad, V Mannar, P Menon, N Nisbett. Lancet 382 (9891), 552-569 8. National Sample Survey 68th Round 9. Planning commission data, accessed on June 15, 2014, http://planningcommission.nic.in/news/pre_pov2307.pdf 10. Uttar Pradesh Directorate of Economic and Statistics, accessed on June 1, 2014, http://updes.up.nic.in/STATE%20ACC%20STATISTICS/NDDP%20&%20GDDP/statedomestic(b).htm 11. Annual Health Survey- 2012-13, accessed on May 22, 2014, http://www.censusindia.gov.in/Vital_Statistics/AHSBulletins/AHS_Bulletin_2012-13_Presentation.pdf