samsung biologics 207940 Algorithm Investment Report
•
1 like•216 views

samsung biologics 207940 Algorithm Investment Report
![[Price for scheduled purchasing]
Arbitrarily made
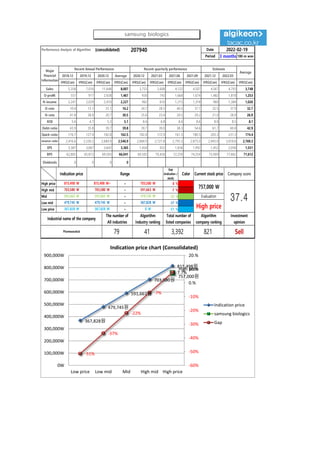
Algorithm stocks Trading Strategies (consolidated) 207940 Date
Period
Gap
(Indication /
stock)
Color
low price 367,828 W 367,828 W ~ 0 W -51 % 207,286 W 1
Low mid 479,745 W 479,745 W ~ 367,828 W -37 % 147,675 W 0
Mid 591,663 W 591,663 W ~ 479,745 W -22 % 88,064 W 0
High mid 703,580 W 703,580 W ~ 591,663 W -7 % 28,453 W 0
Suggested Purchase
Amount 403,204 W
Number of stocks
purchased 1
Indication price Range Buying / Selling Buying / Selling [Stocks]
High price 815,498 W 815,498 W~ ~ 703,580 W 8 % -31,158 W -0
2022-02-19
3 months
Current stock price Evaluation
Stock price rise
probability score
Investment opinion Prospective purchase amount
757,000 W High price 34.1 Sell 2,000,000 W
43.0 35.4 42.8 52.5 43.7 41.1
2021.09.23 2021.10.25 2021.11.22 2021.12.20 2022.01.18 2022.02.18
Stock price rise
probability score
A Sector 51.5 45.4 46.8 45.9 41.8 43.5
34.1
B Sector 34.6 25.4 38.8 45.9 45.6 38.8
Total average
2021.11.22 2021.12.20 2022.01.18 2022.02.18
Total of
increase rate
Total score
A Sector -14 % 3 % -2 % -10 % 4 %
-2 % 45.0
B Sector -36 % 34 % 16 % -1 % -18 %
Total average -22 % 17 % 18 % -20 % -6 %
2021.10.25
51
45 47 46
42 44
35
25
39
46 46
39
43
35
43
53
44 41
0
10
20
30
40
50
60
2021.09.23 2021.10.25 2021.11.22 2021.12.20 2022.01.18 2022.02.18
Stock price rise probability score
A sector
B sector
Total average
-14%
3%
-2%
-10%
4%
-36%
34%
16%
-1%
-18%
-22%
17% 18%
-20%
-6%
-40%
-30%
-20%
-10%
0%
10%
20%
30%
40%
2021.10.25 2021.11.22 2021.12.20 2022.01.18 2022.02.18
Increase rate of stock price rise
A sector
B sector
Total average
samsung biologics](data:image/gif;base64,R0lGODlhAQABAIAAAAAAAP///yH5BAEAAAAALAAAAAABAAEAAAIBRAA7)
Recommended
Recommended
More Related Content
What's hot
What's hot (20)
Similar to samsung biologics 207940 Algorithm Investment Report
Similar to samsung biologics 207940 Algorithm Investment Report (20)
More from 알고리즘 기업분석 컨설팅-알기컨,algikeon
More from 알고리즘 기업분석 컨설팅-알기컨,algikeon (20)
Recently uploaded
Recently uploaded (11)
samsung biologics 207940 Algorithm Investment Report
- 1. Performance Analysis of Algorithm (consolidated) 207940 Date Period 3 months 100-m won 2018.12 2019.12 2020.12 Average 2020.12 2021.03 2021.06 2021.09 2021.12 2022.03 IFRS(Con) IFRS(Con) IFRS(Con) IFRS(Con) IFRS(Con) IFRS(Con) IFRS(Con) IFRS(Con) IFRS(Con) IFRS(Con) IFRS(Con) Sales 5,358 7,016 11,648 8,007 3,753 2,608 4,122 4,507 4,567 4,793 3,748 O-profit 557 917 2,928 1,467 926 743 1,668 1,674 1,482 1,818 1,253 N-income 2,241 2,029 2,410 2,227 962 610 1,215 1,318 960 1,384 1,026 O-rate 10.4 13.1 25.1 16.2 24.7 28.5 40.5 37.1 32.5 37.9 32.7 N-rate 41.8 28.9 20.7 30.5 25.6 23.4 29.5 29.2 21.0 28.9 26.9 ROE 5.4 4.7 5.2 5.1 8.4 6.8 8.4 8.6 8.0 8.5 8.1 Debt-ratio 43.9 35.8 39.7 39.8 39.7 39.0 38.3 54.6 61.7 69.8 42.9 Quick-ratio 176.7 127.9 182.8 162.5 182.8 172.9 161.5 180.5 203.3 231.3 174.4 reserve-ratio 2,416.6 2,539.2 2,684.9 2,546.9 2,684.9 2,721.8 2,795.3 2,875.0 2,945.0 3,018.6 2,769.3 EPS 3,387 3,067 3,642 3,365 1,454 922 1,836 1,992 1,452 2,058 1,551 BPS 62,805 65,813 69,505 66,041 69,505 70,428 72,259 74,254 75,909 77,602 71,612 Dividends 0 0 0 0 Major Financial Information Recent Annual Performance Recent quarterly performance Estimate Average 2022-02-19 Gap (Indication / stock) Color High price ~ 8 % High mid ~ -7 % Mid ~ -22 % Low mid ~ -37 % Low price ~ -51 % Sell 367,828 W 367,828 W 0 W Industrial name of the company The number of All industries Algorithm Industry ranking Total number of listed companies Algorithm company ranking Investment opinion Pharmaceutical 79 41 3,392 821 703,580 W 703,580 W 591,663 W 591,663 W 591,663 W 479,745 W Evaluation 815,498 W 815,498 W~ 703,580 W 757,000 W 37.4 479,745 W 479,745 W 367,828 W High price Indication price Range Current stock price Company score 367,828원 479,745원 591,663원 703,580원 815,498원 High price 757,000원 -51% -37% -22% -7% 7.7% -60% -50% -40% -30% -20% -10% 0.% 10.% 20.% 0W 100,000W 200,000W 300,000W 400,000W 500,000W 600,000W 700,000W 800,000W 900,000W Low price Low mid Mid High mid High price Indication price chart (Consolidated) Indication price samsung biologics Gap samsung biologics
- 2. [Price for scheduled purchasing] Arbitrarily made Algorithm stocks Trading Strategies (consolidated) 207940 Date Period Gap (Indication / stock) Color low price 367,828 W 367,828 W ~ 0 W -51 % 207,286 W 1 Low mid 479,745 W 479,745 W ~ 367,828 W -37 % 147,675 W 0 Mid 591,663 W 591,663 W ~ 479,745 W -22 % 88,064 W 0 High mid 703,580 W 703,580 W ~ 591,663 W -7 % 28,453 W 0 Suggested Purchase Amount 403,204 W Number of stocks purchased 1 Indication price Range Buying / Selling Buying / Selling [Stocks] High price 815,498 W 815,498 W~ ~ 703,580 W 8 % -31,158 W -0 2022-02-19 3 months Current stock price Evaluation Stock price rise probability score Investment opinion Prospective purchase amount 757,000 W High price 34.1 Sell 2,000,000 W 43.0 35.4 42.8 52.5 43.7 41.1 2021.09.23 2021.10.25 2021.11.22 2021.12.20 2022.01.18 2022.02.18 Stock price rise probability score A Sector 51.5 45.4 46.8 45.9 41.8 43.5 34.1 B Sector 34.6 25.4 38.8 45.9 45.6 38.8 Total average 2021.11.22 2021.12.20 2022.01.18 2022.02.18 Total of increase rate Total score A Sector -14 % 3 % -2 % -10 % 4 % -2 % 45.0 B Sector -36 % 34 % 16 % -1 % -18 % Total average -22 % 17 % 18 % -20 % -6 % 2021.10.25 51 45 47 46 42 44 35 25 39 46 46 39 43 35 43 53 44 41 0 10 20 30 40 50 60 2021.09.23 2021.10.25 2021.11.22 2021.12.20 2022.01.18 2022.02.18 Stock price rise probability score A sector B sector Total average -14% 3% -2% -10% 4% -36% 34% 16% -1% -18% -22% 17% 18% -20% -6% -40% -30% -20% -10% 0% 10% 20% 30% 40% 2021.10.25 2021.11.22 2021.12.20 2022.01.18 2022.02.18 Increase rate of stock price rise A sector B sector Total average samsung biologics
- 3. 정보와 완전 정보 결 투자판단 있습니 위배 무단으 숙지하 Compliance notice ① The information provided by The Algorithm Company Analysis Consulting is obtained through reliable data and information and The Algorithm Company Analysis Program (TACAP), but its accuracy or completeness are not guaranteed. Furthermore, it may change over time.Therefore, we are not legally responsible for the results of the data provided by The Algorithm Company Analysis Consulting because of information errors or omissions. ② The Algorithm Company Analysis Consulting and all the information provided on it site are reference materials for investment decisions and the final responsibility of investment is up to users utilizing this information. ③ The Algorithm Company Analysis Consulting and its site do not do anything that violates the related laws such as discretionary transaction. ④ Users can not reallocate and recycle the information provided by The Algorithm Company Analysis Consulting firm let alone the information provided by its Site. ⑤ Be sure to know about application period of this algorithm analysis report in order to improve its accuracy. Tel : 070 - 4667 - 5009 Email : tacac@tacac.co.kr Homepage : tacac.co.kr Blog : tacac.blog.me SERVICES M&A, IPO, RECOVER, CORPORATE RESTRUCTURING, MANAGEMENT OF TECHNOLOGY, BUSINESS STRATEGY, FAMILY BUSINESS Request : http://tacac.co.kr/?page_id=1374 ① Consulting is o The Algorithm accuracy or com change over tim results of the d Consulting bec ② information pr investment dec up ③ do anything th transaction. ④ The Algorithm information pr ⑤ analysis report