lotte foods 002270 Algorithm Investment Report
•
0 gefällt mir•142 views

lotte foods 002270 Algorithm Investment Report
![[Price for scheduled purchasing]
Arbitrarily made
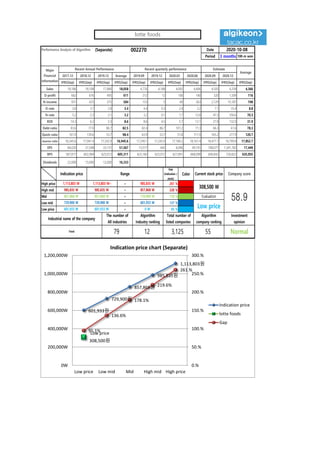
Algorithm stocks Trading Strategies (Separate) 002270 Date
Period
Gap
(Indication /
stock)
Color
2020-10-08
3 months
Current stock price Evaluation
Stock price rise
probability score
Investment opinion Prospective purchase amount
308,500 W Low price 53.2 Normal 10,000,000 W
Suggested Purchase
Amount 5,164,820 W
Number of stocks
purchased 17
Indication price Range Buying / Selling Buying / Selling [Stocks]
High price 1,113,803 W 1,113,803 W~ ~ 985,835 W 261 % -13,482,155 W All selling
High mid 985,835 W 985,835 W ~ 857,868 W 220 % -11,339,758 W All selling
Mid 857,868 W 857,868 W ~ 729,900 W 178 % -9,197,362 W All selling
Low mid 729,900 W 729,900 W ~ 601,933 W 137 % -7,054,965 W All selling
low price 601,933 W 601,933 W ~ 0 W 95 % -4,912,569 W -8
2020.05.14 2020.06.11 2020.07.09 2020.08.06 2020.09.04 2020.10.07
34.6 43.6 38.1
Stock price rise
probability score
A Sector 48.0 42.4 49.8 42.5 49.2 47.5
53.2B Sector 13.3 42.1 42.5 42.5 37.9 28.8
Total average 30.7 42.2 36.2
21 % -14 %
2020.06.11 2020.07.09 2020.08.06 2020.09.04 2020.10.07
Total of
increase rate
Total score
A Sector -13 % 15 % -17 % 14 % -4 %
2 % 47.7B Sector 68 % -87 % 47 % -12 % -32 %
Total average 27 % -17 % -5 %
-13%
15%
-17%
14%
-4%
68%
-87%
47%
-12%
-32%
27%
-17%
-5%
21%
-14%
-100%
-50%
0%
50%
100%
2020.06.11 2020.07.09 2020.08.06 2020.09.04 2020.10.07
Increase rate of stock price rise
A sector
B sector
Total average
lotte foods
48
42
50
43
49 47
13
42
23
43
38
2931
42
36 35
44
38
0
10
20
30
40
50
60
2020.05.14 2020.06.11 2020.07.09 2020.08.06 2020.09.04 2020.10.07
Stock price rise probability score
A sector
B sector
Total average](data:image/gif;base64,R0lGODlhAQABAIAAAAAAAP///yH5BAEAAAAALAAAAAABAAEAAAIBRAA7)
Empfohlen
Empfohlen
Weitere ähnliche Inhalte
Was ist angesagt?
Was ist angesagt? (20)
Ähnlich wie lotte foods 002270 Algorithm Investment Report
Ähnlich wie lotte foods 002270 Algorithm Investment Report (20)
Mehr von 알고리즘 기업분석 컨설팅-알기컨,algikeon
Mehr von 알고리즘 기업분석 컨설팅-알기컨,algikeon (20)
Kürzlich hochgeladen
Kürzlich hochgeladen (11)
lotte foods 002270 Algorithm Investment Report
- 1. Performance Analysis of Algorithm (Separate) 002270 Date Period 3 months 100-m won 2017.12 2018.12 2019.12 Average 2019.09 2019.12 2020.03 2020.06 2020.09 2020.12 IFRS(Sep) IFRS(Sep) IFRS(Sep) IFRS(Sep) IFRS(Sep) IFRS(Sep) IFRS(Sep) IFRS(Sep) IFRS(Sep) IFRS(Sep) IFRS(Sep) Sales 18,186 18,108 17,880 18,058 4,776 4,188 4,092 4,406 4,505 4,258 4,366 O-profit 662 676 495 611 212 12 100 140 320 1,509 116 N-income 951 425 375 584 153 5 69 563 2,129 15,187 198 O-rate 3.6 3.7 2.8 3.4 4.4 0.3 2.4 3.2 7.1 35.4 8.8 N-rate 5.2 2.3 2.1 3.2 3.2 0.1 1.7 12.8 47.3 356.6 70.3 ROE 14.3 6.2 5.3 8.6 8.6 4.5 5.7 12.1 27.8 132.9 31.9 Debt-ratio 83.6 77.0 86.7 82.5 82.4 86.7 101.2 71.3 66.3 61.6 78.3 Quick-ratio 101.9 139.6 53.7 98.4 63.9 53.7 51.8 111.9 165.2 277.9 120.7 reserve-ratio 16,545.6 17,047.4 17,243.9 16,945.6 17,249.1 17,243.9 17,184.2 18,161.4 18,477.7 18,799.8 17,852.7 EPS 84,020 37,548 33,131 51,567 13,517 442 6,096 49,741 188,071 1,341,782 17,449 BPS 587,877 602,984 625,072 605,311 625,160 625,072 621,891 668,098 696,842 726,822 635,055 Dividends 22,000 15,000 12,000 16,333 2020-10-08 Major Financial Information Recent Annual Performance Recent quarterly performance Estimate Average Gap (Indication / stock) Color High price ~ 261 % High mid ~ 220 % Mid ~ 178 % Low mid ~ 137 % Low price ~ 95 % Indication price Range Current stock price Company score 985,835 W 985,835 W 857,868 W 857,868 W 857,868 W 729,900 W Evaluation 1,113,803 W 1,113,803 W~ 985,835 W 308,500 W 58.9729,900 W 729,900 W 601,933 W Low price Normal 601,933 W 601,933 W 0 W Industrial name of the company The number of All industries Algorithm Industry ranking Total number of listed companies Algorithm company ranking Investment opinion Food 79 12 3,125 55 601,933원 729,900원 857,868원 985,835원 1,113,803원 Low price 308,500원 95.1% 136.6% 178.1% 219.6% 261.% 0.% 50.% 100.% 150.% 200.% 250.% 300.% 0W 200,000W 400,000W 600,000W 800,000W 1,000,000W 1,200,000W Low price Low mid Mid High mid High price Indication price chart (Separate) Indication price lotte foods Gap lotte foods
- 2. [Price for scheduled purchasing] Arbitrarily made Algorithm stocks Trading Strategies (Separate) 002270 Date Period Gap (Indication / stock) Color 2020-10-08 3 months Current stock price Evaluation Stock price rise probability score Investment opinion Prospective purchase amount 308,500 W Low price 53.2 Normal 10,000,000 W Suggested Purchase Amount 5,164,820 W Number of stocks purchased 17 Indication price Range Buying / Selling Buying / Selling [Stocks] High price 1,113,803 W 1,113,803 W~ ~ 985,835 W 261 % -13,482,155 W All selling High mid 985,835 W 985,835 W ~ 857,868 W 220 % -11,339,758 W All selling Mid 857,868 W 857,868 W ~ 729,900 W 178 % -9,197,362 W All selling Low mid 729,900 W 729,900 W ~ 601,933 W 137 % -7,054,965 W All selling low price 601,933 W 601,933 W ~ 0 W 95 % -4,912,569 W -8 2020.05.14 2020.06.11 2020.07.09 2020.08.06 2020.09.04 2020.10.07 34.6 43.6 38.1 Stock price rise probability score A Sector 48.0 42.4 49.8 42.5 49.2 47.5 53.2B Sector 13.3 42.1 42.5 42.5 37.9 28.8 Total average 30.7 42.2 36.2 21 % -14 % 2020.06.11 2020.07.09 2020.08.06 2020.09.04 2020.10.07 Total of increase rate Total score A Sector -13 % 15 % -17 % 14 % -4 % 2 % 47.7B Sector 68 % -87 % 47 % -12 % -32 % Total average 27 % -17 % -5 % -13% 15% -17% 14% -4% 68% -87% 47% -12% -32% 27% -17% -5% 21% -14% -100% -50% 0% 50% 100% 2020.06.11 2020.07.09 2020.08.06 2020.09.04 2020.10.07 Increase rate of stock price rise A sector B sector Total average lotte foods 48 42 50 43 49 47 13 42 23 43 38 2931 42 36 35 44 38 0 10 20 30 40 50 60 2020.05.14 2020.06.11 2020.07.09 2020.08.06 2020.09.04 2020.10.07 Stock price rise probability score A sector B sector Total average
- 3. may ded by Compliance notice ① The information provided by The Algorithm Company Analysis Consulting is obtained through reliable data and information and The Algorithm Company Analysis Program (TACAP), but its accuracy or completeness are not guaranteed. Furthermore, it may change over time.Therefore, we are not legally responsible for the results of the data provided by The Algorithm Company Analysis Consulting because of information errors or omissions. ② The Algorithm Company Analysis Consulting and all the information provided on it site are reference materials for investment decisions and the final responsibility of investment is up to users utilizing this information. ③ The Algorithm Company Analysis Consulting and its site do not do anything that violates the related laws such as discretionary transaction. ④ Users can not reallocate and recycle the information provided by The Algorithm Company Analysis Consulting firm let alone the information provided by its Site. ⑤ Be sure to know about application period of this algorithm analysis report in order to improve its accuracy. Tel : 070 - 4667 - 5009 Email : tacac@tacac.co.kr Homepage : tacac.co.kr Blog : tacac.blog.me SERVICES M&A, IPO, RECOVER, CORPORATE RESTRUCTURING, MANAGEMENT OF TECHNOLOGY, BUSINESS STRATEGY, FAMILY BUSINESS Request : http://tacac.co.kr/?page_id=1374