hanmi pharm 128940 Algorithm Investment Report
•
0 likes•119 views

hanmi pharm 128940 Algorithm Investment Report
![[Price for scheduled purchasing]
Arbitrarily made
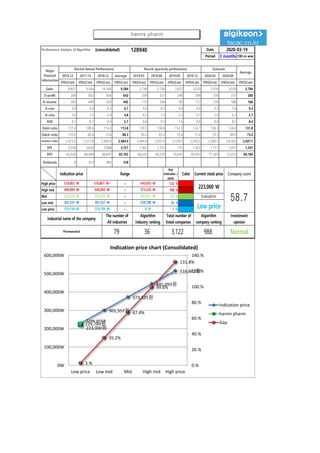
Algorithm stocks Trading Strategies (consolidated) 128940 Date
Period
Gap
(Indication /
stock)
Color
2020-03-19
3 months
Current stock price Evaluation
Stock price rise
probability score
Investment opinion Prospective purchase amount
223,000 W Low price 52.9 Normal 8,000,000 W
Suggested Purchase
Amount 3,653,678 W
Number of stocks
purchased 16
Indication price Range Buying / Selling Buying / Selling [Stocks]
High price 516,861 W 516,861 W~ ~ 445,093 W 132 % -4,814,681 W All selling
High mid 445,093 W 445,093 W ~ 373,325 W 100 % -3,638,820 W -8
Mid 373,325 W 373,325 W ~ 301,557 W 67 % -2,462,959 W -7
Low mid 301,557 W 301,557 W ~ 229,789 W 35 % -1,287,098 W -4
low price 229,789 W 229,789 W ~ 0 W 3 % -111,237 W -0
Stock price rise
probability score
A Sector 49.6 45.3 50.8 50.4 45.8 48.4
52.9B Sector 47.1 29.6 35.8 50.4 43.3 20.8
Total average
2019.10.23 2019.11.20 2019.12.18 2020.01.20 2020.02.19 2020.03.18
48.3 37.4 43.3 29.2 44.6 34.6
35 % -29 %
2019.11.20 2019.12.18 2020.01.20 2020.02.19 2020.03.18
Total of
increase rate
Total score
A Sector -9 % 11 % -1 % -10 % 5 %
-12 % 40.0B Sector -59 % 17 % 29 % -16 % -108 %
Total average -29 % 14 % -49 %
50
45
51 50
46 4847
30
36
50
43
21
48
37
43
29
45
35
0
10
20
30
40
50
60
2019.10.23 2019.11.20 2019.12.18 2020.01.20 2020.02.19 2020.03.18
Stock price rise probability score
A sector
B sector
Total average
-9%
11%
-1%
-10%
5%
-59%
17%
29%
-16%
-108%
-29%
14%
-49%
35%
-29%
-120%
-100%
-80%
-60%
-40%
-20%
0%
20%
40%
60%
2019.11.20 2019.12.18 2020.01.20 2020.02.19 2020.03.18
Increase rate of stock price rise
A sector
B sector
Total average
hanmi pharm](data:image/gif;base64,R0lGODlhAQABAIAAAAAAAP///yH5BAEAAAAALAAAAAABAAEAAAIBRAA7)
Recommended
Recommended
More Related Content
What's hot
What's hot (20)
Similar to hanmi pharm 128940 Algorithm Investment Report
Similar to hanmi pharm 128940 Algorithm Investment Report (18)
More from 알고리즘 기업분석 컨설팅-알기컨,algikeon
More from 알고리즘 기업분석 컨설팅-알기컨,algikeon (20)
Recently uploaded
Recently uploaded (20)
hanmi pharm 128940 Algorithm Investment Report
- 1. Performance Analysis of Algorithm (consolidated) 128940 Date Period 3 months 100-m won 2016.12 2017.12 2018.12 Average 2019.03 2019.06 2019.09 2019.12 2020.03 2020.06 IFRS(Con) IFRS(Con) IFRS(Con) IFRS(Con) IFRS(Con) IFRS(Con) IFRS(Con) IFRS(Con) IFRS(Con) IFRS(Con) IFRS(Con) Sales 8,827 9,166 10,160 9,384 2,746 2,704 2,657 3,029 2,976 3,038 2,784 O-profit 268 822 836 642 259 231 249 299 276 231 260 N-income 303 690 342 445 173 204 89 172 174 188 160 O-rate 3.0 9.0 8.2 6.7 9.4 8.5 9.4 9.9 9.3 7.6 9.3 N-rate 3.4 7.5 3.4 4.8 6.3 7.5 3.3 5.7 5.9 6.2 5.7 ROE 4.1 8.7 4.3 5.7 8.6 9.3 7.4 8.4 8.4 8.5 8.4 Debt-ratio 117.4 109.6 114.3 113.8 130.5 130.8 132.9 132.7 128.3 124.0 131.8 Quick-ratio 119.5 66.6 72.6 86.3 65.2 81.2 75.6 71.0 79.3 89.0 73.2 reserve-ratio 2,475.9 2,511.8 2,465.6 2,484.4 2,444.8 2,507.9 2,530.3 2,545.2 2,580.3 2,616.6 2,507.1 EPS 2,558 5,826 2,888 3,757 1,461 1,723 751 1,452 1,117 1,051 1,347 BPS 62,020 66,909 66,647 65,192 68,023 69,239 70,041 69,433 71,303 73,223 69,184 Dividends 0 472 481 318 2020-03-19 Major Financial Information Recent Annual Performance Recent quarterly performance Estimate Average Gap (Indication / stock) Color High price ~ 132 % High mid ~ 100 % Mid ~ 67 % Low mid ~ 35 % Low price ~ 3 % Indication price Range Current stock price Company score 445,093 W 445,093 W 373,325 W 373,325 W 373,325 W 301,557 W Evaluation 516,861 W 516,861 W~ 445,093 W 223,000 W 58.7301,557 W 301,557 W 229,789 W Low price Normal 229,789 W 229,789 W 0 W Industrial name of the company The number of All industries Algorithm Industry ranking Total number of listed companies Algorithm company ranking Investment opinion Pharmaceutical 79 36 3,122 988 229,789원 301,557원 373,325원 445,093원 516,861원 Low price 223,000원 3.% 35.2% 67.4% 99.6% 131.8% 0.% 20.% 40.% 60.% 80.% 100.% 120.% 140.% 0W 100,000W 200,000W 300,000W 400,000W 500,000W 600,000W Low price Low mid Mid High mid High price Indication price chart (Consolidated) Indication price hanmi pharm Gap hanmi pharm
- 2. [Price for scheduled purchasing] Arbitrarily made Algorithm stocks Trading Strategies (consolidated) 128940 Date Period Gap (Indication / stock) Color 2020-03-19 3 months Current stock price Evaluation Stock price rise probability score Investment opinion Prospective purchase amount 223,000 W Low price 52.9 Normal 8,000,000 W Suggested Purchase Amount 3,653,678 W Number of stocks purchased 16 Indication price Range Buying / Selling Buying / Selling [Stocks] High price 516,861 W 516,861 W~ ~ 445,093 W 132 % -4,814,681 W All selling High mid 445,093 W 445,093 W ~ 373,325 W 100 % -3,638,820 W -8 Mid 373,325 W 373,325 W ~ 301,557 W 67 % -2,462,959 W -7 Low mid 301,557 W 301,557 W ~ 229,789 W 35 % -1,287,098 W -4 low price 229,789 W 229,789 W ~ 0 W 3 % -111,237 W -0 Stock price rise probability score A Sector 49.6 45.3 50.8 50.4 45.8 48.4 52.9B Sector 47.1 29.6 35.8 50.4 43.3 20.8 Total average 2019.10.23 2019.11.20 2019.12.18 2020.01.20 2020.02.19 2020.03.18 48.3 37.4 43.3 29.2 44.6 34.6 35 % -29 % 2019.11.20 2019.12.18 2020.01.20 2020.02.19 2020.03.18 Total of increase rate Total score A Sector -9 % 11 % -1 % -10 % 5 % -12 % 40.0B Sector -59 % 17 % 29 % -16 % -108 % Total average -29 % 14 % -49 % 50 45 51 50 46 4847 30 36 50 43 21 48 37 43 29 45 35 0 10 20 30 40 50 60 2019.10.23 2019.11.20 2019.12.18 2020.01.20 2020.02.19 2020.03.18 Stock price rise probability score A sector B sector Total average -9% 11% -1% -10% 5% -59% 17% 29% -16% -108% -29% 14% -49% 35% -29% -120% -100% -80% -60% -40% -20% 0% 20% 40% 60% 2019.11.20 2019.12.18 2020.01.20 2020.02.19 2020.03.18 Increase rate of stock price rise A sector B sector Total average hanmi pharm
- 3. 정보와 완전 정보 결 투자판단 있습니 위배 무단으 숙지하 Compliance notice ① The information provided by The Algorithm Company Analysis Consulting is obtained through reliable data and information and The Algorithm Company Analysis Program (TACAP), but its accuracy or completeness are not guaranteed. Furthermore, it may change over time.Therefore, we are not legally responsible for the results of the data provided by The Algorithm Company Analysis Consulting because of information errors or omissions. ② The Algorithm Company Analysis Consulting and all the information provided on it site are reference materials for investment decisions and the final responsibility of investment is up to users utilizing this information. ③ The Algorithm Company Analysis Consulting and its site do not do anything that violates the related laws such as discretionary transaction. ④ Users can not reallocate and recycle the information provided by The Algorithm Company Analysis Consulting firm let alone the information provided by its Site. ⑤ Be sure to know about application period of this algorithm analysis report in order to improve its accuracy. Tel : 070 - 4667 - 5009 Email : tacac@tacac.co.kr Homepage : tacac.co.kr Blog : tacac.blog.me SERVICES M&A, IPO, RECOVER, CORPORATE RESTRUCTURING, MANAGEMENT OF TECHNOLOGY, BUSINESS STRATEGY, FAMILY BUSINESS Request : http://tacac.co.kr/?page_id=1374 ① Consulting is o The Algorithm accuracy or com change over tim results of the d Consulting bec ② information pr investment dec up ③ do anything th transaction. ④ The Algorithm information pr ⑤ analysis report