greencross holdings 005250 Algoritm Investment Report
•
0 likes•188 views

greencross holdings 005250 Algoritm Investment Report
![[Price for scheduled purchasing]
Arbitrarily made
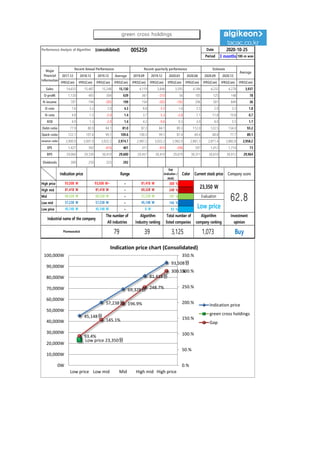
Algorithm stocks Trading Strategies (consolidated) 005250 Date
Period
Gap
(Indication /
stock)
Color
2020-10-25
3 months
Current stock price Evaluation
Stock price rise
probability score
Investment opinion Prospective purchase amount
23,350 W Low price 55.9 Buy 12,000,000 W
Suggested Purchase
Amount 6,375,956 W
Number of stocks
purchased 273
Indication price Range Buying / Selling Buying / Selling [Stocks]
High price 93,508 W 93,508 W~ ~ 81,418 W 300 % -19,157,352 W All selling
High mid 81,418 W 81,418 W ~ 69,328 W 249 % -15,856,054 W All selling
Mid 69,328 W 69,328 W ~ 57,238 W 197 % -12,554,756 W All selling
Low mid 57,238 W 57,238 W ~ 45,148 W 145 % -9,253,458 W All selling
low price 45,148 W 45,148 W ~ 0 W 93 % -5,952,160 W -132
Stock price rise
probability score
A Sector 46.8 44.1 47.4 46.3 48.2 41.0
55.9B Sector 34.2 33.8 23.8 46.3 39.6 30.0
Total average
2020.05.29 2020.06.26 2020.07.24 2020.08.24 2020.09.21 2020.10.23
40.5 38.9 35.6 44.2 43.9 35.5
-1 % -24 %
2020.06.26 2020.07.24 2020.08.24 2020.09.21 2020.10.23
Total of
increase rate
Total score
A Sector -6 % 7 % -2 % 4 % -18 %
-4 % 41.7B Sector -1 % -42 % 49 % -17 % -32 %
Total average -4 % -9 % 19 %
47
44
47 46 48
41
34 34
24
46
40
30
41 39
36
44 44
35
0
10
20
30
40
50
60
2020.05.29 2020.06.26 2020.07.24 2020.08.24 2020.09.21 2020.10.23
Stock price rise probability score
A sector
B sector
Total average
-6%
7%
-2%
4%
-18%
-1%
-42%
49%
-17%
-32%
-4%
-9%
19%
-1%
-24%
-60%
-40%
-20%
0%
20%
40%
60%
2020.06.26 2020.07.24 2020.08.24 2020.09.21 2020.10.23
Increase rate of stock price rise
A sector
B sector
Total average
green cross holdings](data:image/gif;base64,R0lGODlhAQABAIAAAAAAAP///yH5BAEAAAAALAAAAAABAAEAAAIBRAA7)
Recommended
Recommended
More Related Content
What's hot
What's hot (20)
Similar to greencross holdings 005250 Algoritm Investment Report
Similar to greencross holdings 005250 Algoritm Investment Report (20)
More from 알고리즘 기업분석 컨설팅-알기컨,algikeon
More from 알고리즘 기업분석 컨설팅-알기컨,algikeon (20)
Recently uploaded
Recently uploaded (20)
greencross holdings 005250 Algoritm Investment Report
- 1. Performance Analysis of Algorithm (consolidated) 005250 Date Period 3 months 100-m won 2017.12 2018.12 2019.12 Average 2019.09 2019.12 2020.03 2020.06 2020.09 2020.12 IFRS(Con) IFRS(Con) IFRS(Con) IFRS(Con) IFRS(Con) IFRS(Con) IFRS(Con) IFRS(Con) IFRS(Con) IFRS(Con) IFRS(Con) Sales 14,655 15,487 15,248 15,130 4,119 3,846 3,595 4,186 4,232 4,278 3,937 O-profit 1,120 493 304 639 361 -210 56 105 125 148 78 N-income 707 194 -305 199 154 -203 -102 296 501 849 36 O-rate 7.6 3.2 2.0 4.3 8.8 -5.5 1.6 2.5 2.9 3.5 1.8 N-rate 4.8 1.3 -2.0 1.4 3.7 -5.3 -2.8 7.1 11.8 19.8 0.7 ROE 4.9 1.3 -2.0 1.4 4.2 -0.6 0.3 3.0 4.0 5.5 1.7 Debt-ratio 77.9 80.9 84.1 81.0 87.3 84.1 89.3 112.0 122.5 134.0 93.2 Quick-ratio 122.1 107.6 99.1 109.6 100.5 99.1 87.4 69.4 68.8 77.7 89.1 reserve-ratio 2,900.0 3,001.9 3,022.2 2,974.7 2,987.2 3,022.2 2,962.0 2,861.3 2,871.4 2,882.8 2,958.2 EPS 1,427 392 -616 401 311 -410 -206 597 1,012 1,714 73 BPS 29,060 29,330 30,410 29,600 29,457 30,410 29,679 30,311 30,610 30,912 29,964 Dividends 300 250 325 292 2020-10-25 Major Financial Information Recent Annual Performance Recent quarterly performance Estimate Average Gap (Indication / stock) Color High price ~ 300 % High mid ~ 249 % Mid ~ 197 % Low mid ~ 145 % Low price ~ 93 % Indication price Range Current stock price Company score 81,418 W 81,418 W 69,328 W 69,328 W 69,328 W 57,238 W Evaluation 93,508 W 93,508 W~ 81,418 W 23,350 W 62.857,238 W 57,238 W 45,148 W Low price Buy 45,148 W 45,148 W 0 W Industrial name of the company The number of All industries Algorithm Industry ranking Total number of listed companies Algorithm company ranking Investment opinion Pharmaceutical 79 39 3,125 1,073 45,148원 57,238원 69,328원 81,418원 93,508원 Low price 23,350원 93.4% 145.1% 196.9% 248.7% 300.5% 0.% 50.% 100.% 150.% 200.% 250.% 300.% 350.% 0W 10,000W 20,000W 30,000W 40,000W 50,000W 60,000W 70,000W 80,000W 90,000W 100,000W Low price Low mid Mid High mid High price Indication price chart (Consolidated) Indication price green cross holdings Gap green cross holdings
- 2. [Price for scheduled purchasing] Arbitrarily made Algorithm stocks Trading Strategies (consolidated) 005250 Date Period Gap (Indication / stock) Color 2020-10-25 3 months Current stock price Evaluation Stock price rise probability score Investment opinion Prospective purchase amount 23,350 W Low price 55.9 Buy 12,000,000 W Suggested Purchase Amount 6,375,956 W Number of stocks purchased 273 Indication price Range Buying / Selling Buying / Selling [Stocks] High price 93,508 W 93,508 W~ ~ 81,418 W 300 % -19,157,352 W All selling High mid 81,418 W 81,418 W ~ 69,328 W 249 % -15,856,054 W All selling Mid 69,328 W 69,328 W ~ 57,238 W 197 % -12,554,756 W All selling Low mid 57,238 W 57,238 W ~ 45,148 W 145 % -9,253,458 W All selling low price 45,148 W 45,148 W ~ 0 W 93 % -5,952,160 W -132 Stock price rise probability score A Sector 46.8 44.1 47.4 46.3 48.2 41.0 55.9B Sector 34.2 33.8 23.8 46.3 39.6 30.0 Total average 2020.05.29 2020.06.26 2020.07.24 2020.08.24 2020.09.21 2020.10.23 40.5 38.9 35.6 44.2 43.9 35.5 -1 % -24 % 2020.06.26 2020.07.24 2020.08.24 2020.09.21 2020.10.23 Total of increase rate Total score A Sector -6 % 7 % -2 % 4 % -18 % -4 % 41.7B Sector -1 % -42 % 49 % -17 % -32 % Total average -4 % -9 % 19 % 47 44 47 46 48 41 34 34 24 46 40 30 41 39 36 44 44 35 0 10 20 30 40 50 60 2020.05.29 2020.06.26 2020.07.24 2020.08.24 2020.09.21 2020.10.23 Stock price rise probability score A sector B sector Total average -6% 7% -2% 4% -18% -1% -42% 49% -17% -32% -4% -9% 19% -1% -24% -60% -40% -20% 0% 20% 40% 60% 2020.06.26 2020.07.24 2020.08.24 2020.09.21 2020.10.23 Increase rate of stock price rise A sector B sector Total average green cross holdings
- 3. 정보와 완전 정보 결 투자판단 있습니 위배 무단으 숙지하 Compliance notice ① The information provided by The Algorithm Company Analysis Consulting is obtained through reliable data and information and The Algorithm Company Analysis Program (TACAP), but its accuracy or completeness are not guaranteed. Furthermore, it may change over time.Therefore, we are not legally responsible for the results of the data provided by The Algorithm Company Analysis Consulting because of information errors or omissions. ② The Algorithm Company Analysis Consulting and all the information provided on it site are reference materials for investment decisions and the final responsibility of investment is up to users utilizing this information. ③ The Algorithm Company Analysis Consulting and its site do not do anything that violates the related laws such as discretionary transaction. ④ Users can not reallocate and recycle the information provided by The Algorithm Company Analysis Consulting firm let alone the information provided by its Site. ⑤ Be sure to know about application period of this algorithm analysis report in order to improve its accuracy. Tel : 070 - 4667 - 5009 Email : tacac@tacac.co.kr Homepage : tacac.co.kr Blog : tacac.blog.me SERVICES M&A, IPO, RECOVER, CORPORATE RESTRUCTURING, MANAGEMENT OF TECHNOLOGY, BUSINESS STRATEGY, FAMILY BUSINESS Request : http://tacac.co.kr/?page_id=1374 ① Consulting is o The Algorithm accuracy or com change over tim results of the d Consulting bec ② information pr investment dec up ③ do anything th transaction. ④ The Algorithm information pr ⑤ analysis report