boditech med 206640 Algorithm Investment Report
•
0 likes•37 views

boditech med 206640 Algorithm Investment Report
![[Price for scheduled purchasing]
Arbitrarily made
Algorithm stocks Trading Strategies (consolidated) 206640 Date
Period
Gap
(Indication /
stock)
Color
2020-01-23
3 months
Current stock price Evaluation
Stock price rise
probability score
Investment opinion Prospective purchase amount
13,000 W Low mid 45.5 Normal 4,000,000 W
Suggested Purchase
Amount 1,380,110 W
Number of stocks
purchased 106
Indication price Range Buying / Selling Buying / Selling [Stocks]
High price 23,931 W 23,931 W~ ~ 20,502 W 84 % -1,160,461 W -48
High mid 20,502 W 20,502 W ~ 17,074 W 58 % -796,477 W -39
Mid 17,074 W 17,074 W ~ 13,645 W 31 % -432,492 W -25
Low mid 13,645 W 13,645 W ~ 10,217 W 5 % -68,508 W -5
low price 10,217 W 10,217 W ~ 0 W -21 % 295,476 W 29
Stock price rise
probability score
A Sector 39.9 46.1 52.5 46.0 50.9 48.8
45.5B Sector 31.3 44.2 12.1 46.0 25.8 28.3
Total average
2019.08.26 2019.09.25 2019.10.25 2019.11.22 2019.12.20 2020.01.22
35.6 45.1 32.3 50.0 38.4 38.6
-30 % 1 %
2019.09.25 2019.10.25 2019.11.22 2019.12.20 2020.01.22
Total of
increase rate
Total score
A Sector 13 % 12 % -14 % 10 % -4 %
-3 % 47.3B Sector 29 % -266 % 74 % -78 % 9 %
Total average 21 % -40 % 35 %
40
46
53
46
51 49
31
44
12
46
26 28
36
45
32
50
38 39
0
10
20
30
40
50
60
2019.08.26 2019.09.25 2019.10.25 2019.11.22 2019.12.20 2020.01.22
Stock price rise probability score
A sector
B sector
Total average
13% 12%
-14%
10% -4%
29%
-266%
74%
-78%
9%21%
-40%
35%
-30%
1%
-300%
-250%
-200%
-150%
-100%
-50%
0%
50%
100%
2019.09.25 2019.10.25 2019.11.22 2019.12.20 2020.01.22
Increase rate of stock price rise
A sector
B sector
Total average
boditech med](data:image/gif;base64,R0lGODlhAQABAIAAAAAAAP///yH5BAEAAAAALAAAAAABAAEAAAIBRAA7)
Recommended
Recommended
More Related Content
What's hot
What's hot (20)
Similar to boditech med 206640 Algorithm Investment Report
Similar to boditech med 206640 Algorithm Investment Report (20)
More from 알고리즘 기업분석 컨설팅-알기컨,algikeon
More from 알고리즘 기업분석 컨설팅-알기컨,algikeon (20)
Recently uploaded
Recently uploaded (20)
boditech med 206640 Algorithm Investment Report
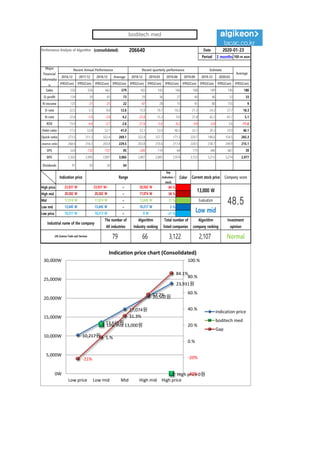
- 1. Performance Analysis of Algorithm (consolidated) 206640 Date Period 3 months 100-m won 2016.12 2017.12 2018.12 Average 2018.12 2019.03 2019.06 2019.09 2019.12 2020.03 IFRS(Con) IFRS(Con) IFRS(Con) IFRS(Con) IFRS(Con) IFRS(Con) IFRS(Con) IFRS(Con) IFRS(Con) IFRS(Con) IFRS(Con) Sales 550 526 662 579 182 183 166 188 189 190 180 O-profit 124 29 65 73 29 36 27 40 46 53 33 N-income 123 -31 -25 22 -47 28 15 41 80 155 9 O-rate 22.5 5.5 9.8 12.6 15.9 19.7 16.3 21.3 24.3 27.7 18.3 N-rate 22.4 -5.9 -3.8 4.2 -25.8 15.3 9.0 21.8 42.2 81.7 5.1 ROE 15.9 -4.4 -3.7 2.6 -27.6 -5.6 -8.2 -4.8 -0.8 5.6 -11.6 Debt-ratio 17.2 53.8 52.1 41.0 52.1 53.0 46.3 33.1 29.3 25.9 46.1 Quick-ratio 273.5 211.3 322.4 269.1 322.4 337.7 171.3 229.7 188.0 154.5 265.3 reserve-ratio 268.4 216.3 203.8 229.5 203.8 210.6 217.4 228.5 238.7 249.9 215.1 EPS 524 -132 -107 95 -200 119 64 175 340 661 39 BPS 3,302 2,995 2,897 3,065 2,897 2,885 2,974 3,153 3,213 3,274 2,977 Dividends 91 50 50 64 2020-01-23 Major Financial Informatio n Recent Annual Performance Recent quarterly performance Estimate Average Gap (Indication / stock) Color High price ~ 84 % High mid ~ 58 % Mid ~ 31 % Low mid ~ 5 % Low price ~ -21 % Indication price Range Current stock price Company score 20,502 W 20,502 W 17,074 W 17,074 W 17,074 W 13,645 W Evaluation 23,931 W 23,931 W~ 20,502 W 13,000 W 48.513,645 W 13,645 W 10,217 W Low mid Normal 10,217 W 10,217 W 0 W Industrial name of the company The number of All industries Algorithm Industry ranking Total number of listed companies Algorithm company ranking Investment opinion Life Science Tools and Services 79 66 3,122 2,107 10,217원 13,645원 17,074원 20,502원 23,931원 Low mid 13,000원 High price 0원 -21% 5.% 31.3% 57.7% 84.1% -40% -20% 0.% 20.% 40.% 60.% 80.% 100.% 0W 5,000W 10,000W 15,000W 20,000W 25,000W 30,000W Low price Low mid Mid High mid High price Indication price chart (Consolidated) Indication price boditech med Gap boditech med
- 2. [Price for scheduled purchasing] Arbitrarily made Algorithm stocks Trading Strategies (consolidated) 206640 Date Period Gap (Indication / stock) Color 2020-01-23 3 months Current stock price Evaluation Stock price rise probability score Investment opinion Prospective purchase amount 13,000 W Low mid 45.5 Normal 4,000,000 W Suggested Purchase Amount 1,380,110 W Number of stocks purchased 106 Indication price Range Buying / Selling Buying / Selling [Stocks] High price 23,931 W 23,931 W~ ~ 20,502 W 84 % -1,160,461 W -48 High mid 20,502 W 20,502 W ~ 17,074 W 58 % -796,477 W -39 Mid 17,074 W 17,074 W ~ 13,645 W 31 % -432,492 W -25 Low mid 13,645 W 13,645 W ~ 10,217 W 5 % -68,508 W -5 low price 10,217 W 10,217 W ~ 0 W -21 % 295,476 W 29 Stock price rise probability score A Sector 39.9 46.1 52.5 46.0 50.9 48.8 45.5B Sector 31.3 44.2 12.1 46.0 25.8 28.3 Total average 2019.08.26 2019.09.25 2019.10.25 2019.11.22 2019.12.20 2020.01.22 35.6 45.1 32.3 50.0 38.4 38.6 -30 % 1 % 2019.09.25 2019.10.25 2019.11.22 2019.12.20 2020.01.22 Total of increase rate Total score A Sector 13 % 12 % -14 % 10 % -4 % -3 % 47.3B Sector 29 % -266 % 74 % -78 % 9 % Total average 21 % -40 % 35 % 40 46 53 46 51 49 31 44 12 46 26 28 36 45 32 50 38 39 0 10 20 30 40 50 60 2019.08.26 2019.09.25 2019.10.25 2019.11.22 2019.12.20 2020.01.22 Stock price rise probability score A sector B sector Total average 13% 12% -14% 10% -4% 29% -266% 74% -78% 9%21% -40% 35% -30% 1% -300% -250% -200% -150% -100% -50% 0% 50% 100% 2019.09.25 2019.10.25 2019.11.22 2019.12.20 2020.01.22 Increase rate of stock price rise A sector B sector Total average boditech med
- 3. Compliance notice ① The information provided by The Algorithm Company Analysis Consulting is obtained through reliable data and information and The Algorithm Company Analysis Program (TACAP), but its accuracy or completeness are not guaranteed. Furthermore, it may change over time.Therefore, we are not legally responsible for the results of the data provided by The Algorithm Company Analysis Consulting because of information errors or omissions. ② The Algorithm Company Analysis Consulting and all the information provided on it site are reference materials for investment decisions and the final responsibility of investment is up to users utilizing this information. ③ The Algorithm Company Analysis Consulting and its site do not do anything that violates the related laws such as discretionary transaction. ④ Users can not reallocate and recycle the information provided by The Algorithm Company Analysis Consulting firm let alone the information provided by its Site. ⑤ Be sure to know about application period of this algorithm analysis report in order to improve its accuracy. Tel : 070 - 4667 - 5009 Email : tacac@tacac.co.kr Homepage : tacac.co.kr Blog : tacac.blog.me SERVICES M&A, IPO, RECOVER, CORPORATE RESTRUCTURING, MANAGEMENT OF TECHNOLOGY, BUSINESS STRATEGY, FAMILY BUSINESS Request : http://tacac.co.kr/?page_id=1374 ① Consulting is ob The Algorithm C accuracy or com may change ove for the results o Analysis Consul ② information prov investment decis up ③ do anything tha transaction. ④ by information prov ⑤ analysis report i