SlideShare a Scribd company logo
1 of 94
Download to read offline
Sale Pending
Property Under Review
15 Minute Drive Radius
Missouri City Ctr
HCC Taxable Area
HCC Service Area
gend
Acres
Homes
Brays
Oaks
TX Parkway
North Forest Voc-Tech
Stafford Campus
Spring Branch Campus
Health Science Ctr.
Northeast Campus
Eastside Campus
Pinemont Center
South Campus
Katy Campus
Gulfton Ctr
Central Campus
JP McGovern
Alief - Hayes Road
Alief - Bissonnet Ctr.
West Loop
Felix Fraga
ATTC/Northline Campus
CC Taxable Area
CC Service Area
te Drive Radius
mph avg speed)
rent Active - Not Changing
rent Active - Expanding
nd
fStafforrdff
SprrinCKaty CCampusCCCC
Alieiefef - Hefief
etet Ctr.nneet ref - Bissonnef - BissoAlieefAlieef - Bisf - Bisef - Bisef -efef ssosoonnononnsoooBissssss
CCC Taxable Area
CCC Service Area
tte Drive Radius
mph avg speed)
rrent Active - Not Changing
rrent Active - Expanding
nnd Study Documentation
Project No.
415084
Submittal Date
22 March 2016
Houston
Community College
Strategic Real
Estate Study
Houston, Texas
Houston Community College Strategic Real Estate Study2
“Build facilities near where
students live, work and
travel...and anticipate how
programmatic content affects
location”
Robert M. Stein, PhD
Lena Gohlman Fox Professor of Political Science, Rice University
Fellow in Urban Politics, Baker Institute for Public Policy
Page Southerland Page, Inc. 3
Key Questions Driving Study The Houston Community College System (HCC), in the course of delivering upon its educational
mission, owns numerous real estate properties. These properties serve as active educational
campuses, administrative operational bases, and placeholders for future educational or
administrative needs. Properties were acquired over time in support of intended service and
growth plans, or were gifted to the College. Periodic review and realignment of real estate
inventory is necessary to assure ongoing asset alignment with system plans and regional
realities. This strategic real estate study analyzes both system provided and publically available
data to outline an objective framework to inform key real estate decisions.
The key questions this study addresses are:
1. What is the optimum distance between educational campuses in a community college
network?
2. What is the optimum size of a single community college campus?
3. Are there any identifiable areas within the HCC service area where a campus does not
currently exist, but objective research suggests a campus should be located?
4. Are any of the existing HCC properties currently operating as (or targeted as future)
educational campuses in the wrong place, or poorly located based upon objective
considerations?
Two parallel approaches to addressing these questions are reflected in this report. In the first,
Robert M. Stein, PhD, in his role as Empirical Researcher and Demographic Analyst, conducted a
review of published literature and consensus best practices for community college system planning
to identify any established guidelines that might inform or direct the HCC real estate strategy. In
the second, PageSoutherlandPage, Inc. (Architects - hereinafter, Page) built from Stein’s research
to compile demographic and geographic data in a series of maps showing different characteristics
of the service area and real estate network. The convergence of these parallel approaches
establishes an objective basis for further exploration.
Executive Summary
Houston Community College Strategic Real Estate Study4
Review of Published
Literature
from “Locating Community College Facilities”
by Robert M. Stein, PhD
For the complete text of Stein’s review, please see
chapter 7 at the end of this document.
A review of scholarly published literature on the best practices for locating community college
facilities does not net a set of unambiguous metrics for making decisions on where to locate
community college facilities. Beyond building facilities near to where community college students
live, work and travel and anticipating how programmatic content effects location, there is little
more to be gleaned from published literature on community college facilities.
There is a clear consensus in the literature that the location of community college facilities
relates to the relationship between the instructional programs at the community college and the
composition of its students and users. This relationship defines not only where the college might
locate its facilities, it also identifies how college infrastructure/facilities should be configured and
equipped.
This study is charged with measurable, location-based analysis, and location-based instructional
evaluation will not be addressed in this report.
Study Context In June of 2011, HCC published the HCC System Facilities Master Plan: 2011-2033. This
comprehensive plan summarizes a full year of research and consultation with numerous HCC
leaders and stakeholders aimed to create a “clear vision for all future development of the physical
environment of Houston Community College Systemin support of its academic missions and
goals.” Recognizing that both HCC and the region served by the system will evolve, the plan
recommended regular updates. Five years later, this supplementary study builds directly on the
vision established in the 2011 master plan.
One of the four key methods employed in the master plan was, “identification of the main drivers
that impact basic decisions about facility location.” The main drivers identified are: demographics,
accessibility, and enrollment pipeline. A combination of the key questions, Stein’s research, and
these drivers serve to organize this real estate study.
Disclaimer - This study was completed over a period of months during which some
situational changes occurred. In particular, the planned sale of the Missouri City Sienna
Plantation campus was completed on 26 February 2016. There may be isolated references to
this campus which do not reflect that change in condition.
Page Southerland Page, Inc. 5
Demographic and
Geographic Analyses
Current Use Analysis Objective analysis logically builds from the explicit historical data available. Today, each of the
existing HCC academic campuses serve different numbers of students. When comparing the
relative student use by campus with the zip code of origin of HCC students, it appears that
students are in some cases traveling past a campus that is closer to their home in order to attend
classes. One possibilie explanation is that students are willing to travel further to attend a larger
location with more of a campus feel. This study does find a positive correlation between building
size and level of student usage, but without further analysis into other possible drivers like relative
course offerings and facility quality/amenities the role of campus size in student preference is
difficult to disaggregate. Further study is required to identify optimal campus size.
Another analysis of student location with respect to campuses shows that a substantial number
of HCC students are identified as coming from outside the taxing district (23% in Fall 2015). The
majority of these hail from Katy, Spring Branch and Fort Bend ISD, but students originate from all
the surrounding districts. This demand suggests growth opportunity is strong to the west.
Comparative maps are employed in this report to geographically illustrate the current population,
population density, and population by target (most common community college attending) age.
Additionally, proportion of population by ethnicity is mapped to highlight how the diversity of
HCC’s service area is distributed geographically. Following are a series of maps that look at
educational attainment of the resident population, showing both all the adults with less than an
associate’s degree as their highest attainment and those adults who are community college ready
(possess college readiness degrees or credentials).
To supplement these analyses of where potential students reside today, a series of maps looks at
forward indicators of potential students. First, a population growth map shows where the service
area is experiencing the fastest population growth. Second, the public high schools with the lowest
4-year graduation rates are mapped, with their attendance boundaries, to suggest where the GED
and college prep population needs are greatest. Finally, the major Houston area employment
centers are located to show job centers which support part-time and working students.
The final analysis explores where community college campuses currently exist, locating all of the
surrounding community college system campuses as well as analyzing the effective overlap of
existing HCC sites through evaluation of the 15 minute drive-time radius from each active and
planned campus.
Houston Community College Strategic Real Estate Study6
Conclusions The demographic and geographic analyses aggregate up into a zip-code level priority map that
highlights the geographic locations of greatest potential based upon an even weighting of seven
geographic prioritization measures (see box below). This priority map locates the ideal geographic
areas for community college campuses across the HCC service area, irrespective of the current
network of HCC facilities.
•Population at target age
(15-29 years)
•Representative ethnicity concentration
•Population density
•Educational attainment and ‘readiness’ for college coursework
•Population growth
•Low 4 yr graduation rate high school zones
•Employment center proximity
Geographic Prioritization Measures
Recommendations and conclusions for this real estate strategy are drawn from examination
of the existing network of HCC campuses and their overlapping ‘convenient access areas’ (as
measured by the drive-time radius analysis) against the priority map created. In every case, the
highest priority zip codes identified are being served by more than one HCC campus location.
This suggests that the established network of campuses effectively targets the priority students,
and there may be opportunities for consolidation as operational and financial considerations are
evaluated.
On the facing page, each of the property holdings which are ‘under review’ in the current
inventory, meaning that they are owned by HCC but no current plans exist to develop a campus
or administrative building on the site, is discussed in detail with respect to the priority population
that might be reached from that location and the overlap with existing or under development facility
resources. Additionally, several consolidation opportunities are identified with properties that
overlap heavily in their effective reach.
Page Southerland Page, Inc. 7
Recommendations Specific recommendations for the properties under review are:
• Westheimer - Divest property: location covers a high priority geography but has extensive overlap
with existing and planned HCC campuses
• Katy and Katy Mills - Divest property: Evaluate the potential to ultimately divest Katy Mills and
the current Katy campus in favor of a new campus better serving the western reaches of the
service area. The current placement of the Katy campus means roughly half of its 15 minute
drive radius is already served by the Spring Branch Campus. At the same time, the Katy Mills
property, which covers geography well to the west of and distinct from Spring Branch is too
small to support substantial development.
• 288/MacGregor - Divest property: location covers a high priority geography, but is very close to
numerous existing campuses which already serve that priority geography well
• E. Little York - Divest property: location is well located with respect to priority geography on the
north east side of the service area, but is very close to numerous existing campuses and would
not serve a new population from that location
• Midtown Purchase - Hold as parking and future expansion for Central campus: location is sufficiently
close to the existing central campus to realize efficiencies in operation and investment as
inexpensive overflow surface parking in the immediate, and future expansion space for the Central
Campus in the future.
• Delano Warehouse - Divest property.
Specific recommendations for consolidation of existing properties are:
• Gulfton - Divest property: location has heavy overlap with the West Loop campus and a small
student body, suggesting that consolidation with the West Loop location and the new center at
Brays Oaks will utilize resources more effectively.
• Pinemont (Leased) - When lease is up, look for opportunities to either consolidate operations with
Northline or shift the campus west to improve geographic coverage and reduce the overlap with
the ATTC/Northline campus facility..
Future property location opportunities may be evaluated against the established geographic priority
map and the overlapping existing campus drive-radius map to determine whether the real estate
represents an objective opportunity to serve the target HCC student population effectively.
Houston Community College Strategic Real Estate Study8
“...the relationship between the
instructional programs at the
community college and the
composition of its students and
users...defines not only where the
college might locate its facilities,
it also identifies how college
infrastructure/facilities should be
configured and equipped.”
Robert M. Stein, PhD
Lena Gohlman Fox Professor of Political Science, Rice University
Fellow in Urban Politics, Baker Institute for Public Policy
Page Southerland Page, Inc. 9
4.0 Student characteristics and local
demographics
39 Community College Student Characteris-
tics - National Trends
40 Houston Area Population Distribution
41 Houston Area Population Density
42 HCC Students - by Age
43 HCC Students - Saturation of Target Age
Group Across Service Area
44 HCC Students - by Ethnicity
45 HCC Service Area Population Distribution
by Ethnicity
46 Educational Attainment Across HCC
Service Area - Proportion at Less than
Associates’ Degree
47 Educational Attainment Across HCC
Service Area - Number at Less than Asso-
ciates’ Degree
48 Educational Attainment Across HCC
Service Area - Proportion with No Degree
That are College Ready
49 Educational Attainment Across HCC
Service Area - Number with No Degree
That are College Ready
5.0 Predictive indicators
51 Recent Population Growth
52 Target High School Zones
53 Employment Centers
1.0 Definitions, Funding, and Oversight
15 Definitions, Service and Taxing Areas
16 School Districts Within HCC Service Area
18 Administrative Organization and Breakdown
19 HCC Trustee District Boundaries
2.0 HCC Real Estate Property Summary
21 Introduction
22 HCC Existing Real Estate by Property Status
23 Complete Property Listing
24 Real Estate Building and Land Area by Loca-
tion
3.0 Academic Property Usage
30 Students By Primary Campus
31 Current HCC Students by Zip Code
32 Current HCC Students per Zip Code by
Campus
34 Campus Size Analysis
36 School Districts Surrounding HCC Service Area
37 Out of District HCC Students
Contents/
01
02
03
04
05
Houston Community College Strategic Real Estate Study10
6.0 Distribution, Area Coverage, and Competition
55 HCC Existing Locations Drive Time Radius Overlap
56 HCC Properties Under Development Drive Time Radius
57 HCC Properties Under Review Drive Time Radius
58 All Community Colleges Serving MSA
59 Surrounding System Campuses and HCC Drive Times
7.0 Analysis and conclusions
61 Approach Summary
62 Opportunity Prioritization Summary by Zip Code
63 Opportunity Map vs. Existing HCC Coverage
64 Westheimer Location
66 Katy Mills Location
68 E Little York Location
70 288/MacGregor Location
72 Midtown Purchase Location
74 Delano Warehouse Location
8.0 Appendix
77 Full Text : Locating Community College Facilities
79 Related Note: An overview of community college users
and programs-Nationally
80 Excerpt from Memo: Discussion Regarding Possible
Classification of Instructional Sites
81 Summary Property List
82 Complete Property List
07
08
06
Page Southerland Page, Inc. 11
System Leadership/ Board of Trustees
Dr. Adriana Tamez, Chair, District III
Robert Glaser, Vice Chair, District V
Dr. Carolyn Evans-Shabazz, Secretary, District IV
Zeph Capo, District I
David B. Wilson, District II
Dr. John P. Hansen, District VI
Neeta Sane, District VII
Eva L. Loredo, District VIII
Christopher W. Oliver, District IX
Executive Cabinet
Dr. Cesar Maldonado, Chancellor
Teri Zamora, Sr. Vice Chancellor, Finance & Administration
Dr. Kimberly Beatty, Vice Chancellor, Instructional Services, CAO
Dr. Butch Herod, Vice Chancellor, Innovation Planning & Institutional Analytics
E. Ashley Smith, General Counsel
Frederica Guthrie, Director, Communication Services
Dr. Melissa Gonzalez, Chief of Staff
Houston Community College Strategic Real Estate Study12
Acknowledgements/ This document represents the compilation of months of work organized and led by
PageSoutherlandPage, Inc. (Page) in consultation with key Administrators of Houston
Community College and under the direction of Charles D. Smith, PE, Chief Facilities Officer
Houston Community College.
Page gratefully extends its gratitude to all participants from HCC for sharing their time and
leadership.
Jeff Bricker is committed to improving the quality of life in Houston through his architectural practice. A
proud native Houstonian, he has managed many large, complex projects for educational, government,
and business clients in his hometown. Previously a principal of Bricker + Cannady Architects, he now
provides Page with technical and managerial direction on a number of important public projects for the
City of Houston and Harris County, as well as an array of other building types for private sector clients.
Bricker + Cannady was folded into Page when Jeff was invited to join the firm in 2004.
Jeff is equally passionate about his commitment to civic service efforts in Houston, often sharing
local developments and updates with staff and encouraging their interest and involvement in city
governance. A longtime community leader, he has been involved in the planning, strategy and
fundraising for numerous bond elections and local political campaigns. As he points out, “Our
responsibility doesn’t end when we complete projects that improve the way people live. We also have
a duty as citizens to ensure that quality of life continues through community involvement.”
Jeff has served on the boards of Southwest Houston 2000, The Park People, Leadership Houston, and
the American Red Cross. In addition, he has been active with the Greater Houston Partnership, having
served as the former chair of its Local Government Relations Committee and Federal Government
Relations Committee, a founding member of its Partnership’s Quality of Life Committee, and former
chair of a taskforce on sensible growth for its Business Issues Committee.
His projects include the Jones Plaza in Houston’s Theatre District, several buildings within the
Discovery Green downtown park, the Houston Area Women’s Shelter, the Student Services Center
for the University of Houston’s downtown campus, more than 80 municipal parks under the auspices
of the City of Houston’s Parks to Standard Program, development of the master plan for the Harris
County parks system, and the Maverick Activities Center at the University of Texas at Arlington.
Several recent projects for the University of Houston have helped to transform its main campus. Those
include the Student Recreation and Wellness Center, the West Dining Facility, and the 800-bed Cougar
Place student housing projects. The $120 million football stadium, initially accommodating 40,000
spectators but designed to be expanded in the future to add another 20,000 seats, further expands his
campus portfolio.
Jeff Bricker, AIA, Principal in Charge
Page Southerland Page, Inc. 13
Jamie Flatt, Principal, Strategic and Geographic Analyst
Also a proud native Houstonian, Jamie first brought her exceptional creativity and business
acumen to predesign projects at Page in 2005. She arrived at the profession of architecture via a
circuitous route: psychology major/pre-med student at Harvard, management consultant focused
on emergence of the internet and modernization of banking networks right out of school, then
internal strategist at a New York investment bank for two years, finally rounded out by a brief
stint as fulfillment manager at a media marketing firm before getting her MArch at Rice.
At Page, Jamie has led predesign projects across numerous market sectors including academic,
civic, government, corporate, and public safety. Notable projects include a needs assessment
for the Houston Police Department Headquarters consolidation (still the basis for the proposed
Houston Justice Complex), a service and facility master plan for the Houston Public Library, and
a master plan for ADNOC’s Petroleum Institute campus in Abu Dhabi.
Prior to joining Page, she served as an associate in the Corporate Strategy Group at Lehman
Brothers in New York developing firm-wide strategic planning and analysis. Jamie also served
as an analyst for a strategic consulting firm in Washington, D.C., where she conducted retail
network optimization analyses for a major retail bank across multiple markets.
Robert M. Stein, PhD, Empirical Researcher and Demographic Analyst
Robert M. Stein, Ph.D., is the fellow in urban politics at the Baker Institute and the Lena Grohlman
Fox Professor of Political Science at Rice University. He also is the faculty director of Rice’s Center
for Civic Engagement. Stein’s current research focuses on alternative modes of elections and voting
procedures in the United States; emergency preparedness, behavioral response to severe weather
events, and risk assessment; and home weatherization programs in low- and moderate-income
households. His work has been supported by the National Science Foundation, the City of Houston’s
Office of Public Safety and Homeland Security, the Environmental Defense Fund and Pew Charitable
Trusts, among others.
Stein is co-author of “Perpetuating the Pork Barrel: Policy Subsystems and American Democracy”
(Cambridge University Press, 1995) and author of “Urban Alternatives: Public and Private Markets
in the Provision of Local Services” (Pittsburgh Press, 1990). He has received the Outstanding
Reviewer Award from Political Research Quarterly and the Best Paper Award on Federalism and
Intergovernmental Relations (with Kenneth Bickers) from the American Political Science Association.
He teaches courses on public policy, urban politics and political behavior at Rice, where twice he has
been awarded the George R. Brown Award for Superior Teaching. Stein received his bachelor’s degree
from Ohio Wesleyan University. He earned his master’s and doctoral degree from the University of
Wisconsin–Milwaukee.
Aaron Jones, AIA, Associate Principal, Project Manager
Houston Community College Strategic Real Estate Study14
“The board of trustees of a
junior college district may
accept or acquire by purchase
or rent land and facilities in
the name of the junior college
district within the junior
college district’s service area.”
Texas Education Code
Title 3, Subchapter G
Section 130.086
Page Southerland Page, Inc. 15
1.0 Definitions, Funding, and Oversight
Definitions, Service and Taxing Areas
Like all junior college systems in Texas, HCC is regulated by the state education code. The
following text is from Title 3, Subchapter G, Section 130: Higher Education, Non-Baccalaureate
System, Junior College Districts. This code articulates the specific rules governing property
considerations for Junior Colleges.
Sec. 130.161. 2): “Service area” means:
(A) the territory within the boundaries of the taxing district of a junior college
district; and
(B) the territory outside the boundaries of the taxing district of a junior
college district in which the junior college district provides services.
Sec. 130.182 defines the service area of the Houston Community College
System District as including the territory within:
• the Houston, Alief, Katy, Spring Branch, and North Forest independent
school districts;
• the Stafford Municipal School District; and
• the part of the Fort Bend Independent School District that is located in
the municipalities of Houston, Missouri City, and Pearland.
See map on following page.
Houston Community College Strategic Real Estate Study16
Legend
HCC Taxable Area
HCC Service Area
HCC Property
Katy ISD
Spring Branch ISD
Alief ISD
Fort Bend ISD
Houston ISD
Stafford
ISD
School Districts Within HCC Service Area
Only that part of the Fort Bend Independent School
District that is located in the municipalities of Houston,
Missouri City, and Pearland is included in the HCC
Service Area.
Page Southerland Page, Inc. 17
The college has several funding options available to
fund the purchase or construction of campus
facilities:
General Obligation
Bonds
repayment funded by debt
portion of ad valorem
taxes*
Public Finance
Corporation (PFC)
Lease Revenue Bonds
repayment funded from
pledged PFC lease
revenues
Revenue Bonds repayment funded from
pledged operating
revenues
Public Private
Partnership (P3)
funded by operations
under partnership
agreement
Fund Balance funded from cash
accumulated from
previous years’ operations
and from disposition of
assets
Tuition and Fee
Revenues
tuition and fee rates set by
HCC Board of Trustees;
available for all valid
expenses of the college
Operation and
Maintenance Tax
ad valorem tax rates set
by HCC Board of Trustees;
available for all valid
expenses of the college
within the taxing district only
The two* primary options available to the college for
operation of campus facilities include:
* General Obligation Bonds require approval by an election of the voters
within the HCC taxing district, and may not be used to fund locations
outside of the taxing district.
* HCC’s other primary funding stream received from state appropriations
must be used exclusively to pay for instructional and administrative
salaries, and supplies and materials for instructional purposes.
The defined service area is larger in the case of HCC than the established
taxable area. Within the designated service area, Spring Branch and Katy
ISD residents have not yet voted to support HCC directly via property taxes.
As a result, students residing in the district, but outside of the taxable area
pay tuition at out-of-district rates.
Houston Community College Strategic Real Estate Study18
Administrative Organization and Breakdown
The Houston Community College System district is divided up into nine trustee districts for the
purpose of representation and oversight. The map on the facing page illustrates the trustee
district breakdown.
One benefit of the current study is that it highlights the reality that many community college
students attend classes closer to where they work, shop and travel each day than to where
they sleep. Professor Stein’s previous publications on the challenges of democratic governance
structures imply that continuing to provide the types of information assembled by the
Administration and reported herein regarding where the students living in each district actually
engage HCC will materially assist Trustees in making sound decisions and explaining them to the
electorate.1,2
1. Robert M. Stein and Kenneth N. Bickers.
1995. Perpetuating the Pork Barrel: Policy
Subsystems and American Democracy.
Cambridge University Press
2. Aggregated information on student
enrollment by campus can be provided to
trustees, preserving the confidentiality and
privacy of individuals students.
Page Southerland Page, Inc. 19
I
II
IIIIV
V
VI
VII
VIII
IX
Legend
HCC Taxable Area
HCC Service Area
HCC Teaching Site
HCC Trustee District Boundaries
Houston Community College Strategic Real Estate Study20
“...HCC currently serves a
622 square mile service area
via 3.7 million square feet of
academic buildings on 576
acres of property ...”
Aggregate of Master Property Data
Page Southerland Page, Inc. 21
2.0 HCC Real Estate Property Summary
The Houston Community College System (HCC), in the course of delivering upon its educational
mission, owns numerous real estate properties. These properties serve as active educational
campuses, administrative operational bases, and placeholders for future educational or
administrative needs. Properties were acquired over time in support of intended service and growth
plans, or were gifted to the College.
The entire inventory of properties held by HCC are included in this study. 187 separate parcels
are separately accounted for (either by name or appraisal district designation). A large number
of these parcels are contiguous or adjacent to one another and for the purpose of this analysis
have been aggregated into 26 distinct tracts. Re-platting these properties would simplify
asset management, ongoing analysis and public explanation of land holdings, however, such
re-platting efforts should be carefully considered as part of other work, as the standalone cost of
reducing 187 plats to 26 locations could easily exceed two million dollars.
Properties are grouped by current administrative entity or ‘College’ where applicable and then
designated as one of the following types, depending on the current plans for that location.
Introduction
• Existing - Developed property in current service not currently slated for
growth or disposition.
• Expanding - Developed property in current service being expanded as
part of the current construction program.
• Under Review - Current holding that is not in active service and which the
administration has asked Consultant to specifically comment upon.
• Under Development - Current property that is the site of new facility
under contract for construction.
• Sale Pending - Current property being divested by the College
Total Area of Land Parcels Analyzed, by Status
(square feet)
Total Building Area Grouped, by Property Status
(square feet)
1,414,571
2,909,393
61,803 120,134 45,000
Existing Expanding Under Review Under
Development
Sale Pending
8,097,500
11,970,004
1,932,551
2,877,493
195,253
Existing Expanding Under Review Under Development Sale Pending
Current Area
Houston Community College Strategic Real Estate Study22
0
1,000,000
2,000,000
3,000,000
4,000,000
4,627,881
Land Area Owned (sf)
Legend
HCC Taxable Area
HCC Service Area
Central
Coleman
Northeast
Northwest
Southeast
Southwest
District
College
Existing/In Use - No change planned
Expanding Campus
Under Development
Property Under Review
Sale Pending
Leased
Property Status
North Forest Voc-Tech Campus
Stafford Campus
Warehouse-9424 Fannin
Spring Branch Campus
Health Science Ctr.
Northeast Campus
Eastside Campus
Pinemont Center
Missouri City Ctr
South Campus
Katy Campus
Gulfton Ctr
Katy Mills
Central Campus
Westheimer
JP McGovern
System Admin
Alief - Hayes Road
Alief - Bissonnet Ctr.
Acres Homes
Brays Oaks
TX Parkway
West Loop
288/MacGregor
Midtown Purchase
Felix Fraga
Whse-Delano
ATTC/Northline Campus
E Little York
HCC Existing Real Estate by Property Status
Analysis and objective review of the existing facilities is complicated by the different property and
location names utilized for the various properties in inventory. Upon completion of the CIP, the System
will have at least 28 distinct operating locations, in addition to remote sites. These locations are
currently designated as “Building”, “Campus”, “Center”,“College”, and “Facility”; without apparent
regard to size, population or function. As HCC moves towards the ‘Centers of Excellence’ strategy a
more consistent naming approach would simplify communications and administration of the various
facilities (see facility director’s memo excerpt in appendix).
Page Southerland Page, Inc. 23
Complete Property Listing Administrative Unit Specific Location Land Area (sf) Current Status
District System Admin Building 163,085 Existing
Warehouse-9424 Fannin 593,726 Existing
Warehouse-Delano 31,260 Under Review
Central South Campus 4,527,626 Expanding
Central Campus 1,176,885 Expanding
288/MacGregor 396,706 Under Review
Midtown Purchase 178,605 Under Review
Coleman Health Science Ctr. 155,302 Expanding
John P. McGovern 10,800 Leased/Under Review
Northeast Northeast Campus 4,521,631 Existing
Auto Tech Training Ctr. 203,866 Existing
Pinemont Center 51,435 Leased/Existing
North Forest Voc-Tech 1,919,002 Expanding
Northline Campus 976,266 Expanding
Acres Homes 492,637 Under Development
Donation-E Little York 214,350 Under Review
Northwest Katy Campus 1,347,931 Existing
Spring Branch Campus 878,694 Existing
Alief - Bissonnet Center 229,613 Existing
Alief - Hayes Road 965,367 Expanding
West Houston Inst. 1,019,412 Under Review
Katy Mills 81,418 Under Review
Southeast Eastside Campus 683,107 Expanding
Felix Fraga Academic 466,014 Expanding
Southwest Gulfton Ctr 107,519 Existing
West Loop Ctr 771,032 Expanding
Stafford Campus 329,403 Expanding
Missouri City Ctr 195,253 Sale Pending
Brays Oaks 558,421 Under Development
TX Parkway 1,826,435 Under Development
*Note that the properties comprising
the Stafford Campus are not
currently contiguous, with several
plots a short distance away on
. Discussions are
underway with the local municipality
to swap land that is adjacent to the
HCC campus for these sites. Given
the increased functionality and
flexibility that contiguous properties
provide, it is recommended that the
land swap be pursued.
*
Houston Community College Strategic Real Estate Study24
Real Estate Building and Land Area by Location
Established/Planned
Total Land Area(square feet)
Building Area
(square feet)
292,000
269,451
237,252
140,000
0.08
0.15
0.26
0.43
0.33
0.38
0.84
0.23
0.05
0.03
1.00
2.44
FAR
NORTHWEST
SOUTHWEST
COLEMAN
108,503
132,856
60,220
411,048
35,500
294,451
275,497
27,189
45,000
67,825
10,800
378,242
1,347,931
878,694
229,613
965,367
107,519
771,032
329,403
195,253
558,421
1,826,435
10,800
155,302
Katy Campus
Spring Branch
Campus
Alief -
Bissonnet Center
Alief -
Hayes Road
Gulfton Center
West Loop Center
Stafford Campus
Sienna Plantation
Center
Brays Oaks
TX Parkway Center
John P. McGovern
Health Science Ctr.
Each property listed on the
preceding page is illustrated on the
charts to the right (and following
page). Properties are grouped by
administrative unit.
The length of the gray bars on the left
are sized to show the relative area
of HCC buildings on the land. The
darker gray represents the future, or
planned area, while the lighter gray
represents the current building area.
The bars extending to the right are
sized to show the relative size of the
land available at that location and
are color-coded by the status of the
property (existing, expanding, under
review, etc.).
Properties with larger gray bars
and smaller colored bars are more
constrained in their potential for
future growth than properties with
larger colored bars and smaller gray
bars.
This ratio of building to land area is
sometimes called the Floor to Area
Ratio or FAR.
The lower FAR properties have
substantially more opportunity for
growth (e.g. Texas Parkway Center)
than the properties with an FAR
greater than 1.0 (e.g. the Health
Science Ctr.)
Page Southerland Page, Inc. 25
Total Land Area(square feet)
Building Area
(square feet)
FAR
NORTHWEST
39,000
41,753
115,225
288,559
68,805
701,150
0.02
0.62
0.21
3.42
0.06
0.35
1.00
0.03
0.17
0.23
0.05
0.49
CENTRAL
DISTRICT
NORTHEAST
SOUTHEAST
103,959
124,245
558,450
271,370
72,059
51,368
107,653
166,731
25,120
333,007
105,237
731,348
4,527,626
1,176,885
593,726
163,085
4,521,631
203,886
51,435
1,919,002
976,266
492,637
683,107
466,014
South Campus
Central Campus
Warehouse-9424 Fannin
System Administration
Building
Northeast Campus
Auto Tech Training Ctr.
Pinemont Center
North Forest
Voc-Tech
Northline Campus
Acres Homes
Eastside Campus
Felix Fraga Academic
Floor Area Ratio (FAR) is the ratio of a building’s
total floor area (gross floor area in square feet) to
the size of the piece of land upon which it is built
(square feet of land). FAR is a measure of site
development density.
The color codes visually highlight the very dense
sites (towards red on the spectrum) vs. the much
less dense sites (towards green on the spectrum).
Legend
Building Area (sf)
Floor to Area Ratio
(FAR)
Land Area (sf)
Existing/In Use
No change planned
Expanding Campus
Under Development
Sale Pending
Leased
Existing
Future/Expanded
Least Greatest
Houston Community College Strategic Real Estate Study26
81,418
Katy Mills
396,706
288/MacGregor
178,605
Midtown Purchase
214,350
Donation-E Little York
1,019,412
31,260
Westheimer
Warehouse-Delano
40,000
Specific suggestions for each property under review are outlined in the final chapter of this
report, Chapter 7.
Real Estate Building and Land Area by Location
Properties Under Review
Total Land Area(square feet)
Building Area
(square feet)
FAR
NORTHWEST
Page Southerland Page, Inc. 27
Map of all properties - size of land holding indicated
0
1,000,000
2,000,000
3,000,000
4,000,000
4,627,881
Land Area Owned (sf)
Legend
HCC Taxable Area
HCC Service Area
Central
Coleman
Northeast
Northwest
Southeast
Southwest
District
College
North Forest Voc-Tech Campus
Stafford Campus
Warehouse-9424 Fannin
Spring Branch Campus
Health Science Ctr.
North mpus
Eastside Campus
Pinemont Center
Missouri City Ctr
South Campus
Katy Campus
Gulfton Ctr
Katy Mills
Central Campus
Westheimer
JP McGovern
System Admin
Alief - Hayes Road
Alief - Bissonnet Ctr.
Acres Homes
Brays Oaks
TX Parkway
West Loop
288/MacGregor
Midtown Purchase
Felix Fraga
Whse-Delano
ATTC/Northline Campus
E Little York
W
Park
ieim
C
h m
c-Tec
hline
res
n
oouss
s
uth am
WWWW
ParkParkParkPark
iiiiiiii
hh
c-T- ec-T- ecc-Tecc-Tec
inelinelineline
resres
nnnnn
uussuss
ss
th Camth Camth amth am
The map on this page shows the geographic location
of each property studied, with the circle size indicating
relative land area of each property. The bubbles do not
correspond to actual geographic map scale, but are
relevant for comparison of each property to the others.
The South Campus and Northeast Campus are the
largest aggregations of land within HCC.
Houston Community College Strategic Real Estate Study28
“How community college
students use and access
the college courses and
programs has a significant
influence on the location and
configuration of community
college facilities.”
Robert M. Stein, PhD
Lena Gohlman Fox Professor of Political Science, Rice University
Fellow in Urban Politics, Baker Institute for Public Policy
Page Southerland Page, Inc. 29
3.0 Academic Property Usage
FTSE
UDHC
2,000
4,000
6,000
8,000
10,000
2,000
4,000
6,000
8,000
10,000
2,000
1,821
3,509
705
1,674
828
3,294
3,171
381
1,160
255
5,007
1,528
197
407
154
1,560
2,636
537
KatyCampus
SpringBranch
Campus
Alief-Center
Alief-Hayes
GulftonCtr
West
LoopCtr
Stafford
Campus
Missouri
CityCtr
HealthScience
Ctr.
SouthCampus
Central
Campus
Northeast
Campus
AutoTech
TrainingCtr.
Pinemont
Center
NorthForest
Voc-Tech
NorthlineCampus
Eastside
Campus
FelixFraga
Academic
FTSE
UDHC
FTSE
UDHC
FTSE
UDHC
FTSE
UDHC
FTSE
UDHC
FTSE
UDHC
CENTRAL NORTHEASTNORTHWEST SOUTHWEST SOUTHEASTCOLEMAN
The charts above show the Fall 2014 Full-Time Student Equivalent (FTSE) campus usage for
each campus (darker bar with count of FTSEs) alongside the Unduplicated Head Count (UDHC).
UDHC counts all the students who use a specific campus, with duplications removed, but there
is no distinction between students who are present for three hours per week and those who
are present for forty hours per week. Thus UDHC is useful for the calculation of student fees, to
understand the administrative load upon a campus, and to inform decisions about certain types
of space, such as libraries and recreation centers that may be used by all categories of students.
FTSE is the customary measure used in facility planning because it equalizes the time impact on
the facility of different types of students. At HCC, FTSE is calculated by dividing the total number
of instructional contact hours by 240, which is the number of contact hours in a 15 credit hour
academic semester.
The use of both measures allows the district to make informed decisions about space planning,
and to combine data about different types of student usage on an equivalent basis for the
purpose of comparison.
Fall 2014 Data
Houston Community College Strategic Real Estate Study30
0
1,000,000
2,000,000
3,000,000
4,000,000
4,627,881
Land Area Owned (sf)
Legend
HCC Taxable Area
HCC Service Area
Central
Coleman
Northeast
Northwest
Southeast
Southwest
District
College FTSE
0
1,000
2,000
3,000
4,000
5,007
North Forest Voc-Tech Campus
Stafford Campus
Spring Branch Campus
Health Science Ctr.
Northeast Campus
Eastside Campus
Pinemont Center
Missouri City Ctr
South Campus
Katy Campus
Gulfton Ctr
Central Campus
Alief - Hayes Road
Alief - Bissonnet Ctr.
West Loop
Felix Fraga
ATTC/Northline Campus
Students By Primary Campus The map below superimposes the relative FTSE per active campus data from the previous page
onto the service area map to show where in the HCC service area the greatest student use of
campuses occurs. The map is shown parallel to a map on the facing page color-coded by the
number of HCC students residing in each zip code. The juxtaposition of these two maps allows
a comparison of student residential concentration and heavy campus use. Not surprisingly, the
Central campus is not located in a high student population area yet draws the largest student
usage, suggesting that some campuses gather students from a large geographic area and usage
relates to other factors besides location of student residence.
Note: The size of the circle on the map above
corresponds to the relative number of full-time
student equivalents using that campus. This
allows for a visual comparison of the relative
student use rate in the correct geographic
location. The bubbles are centered on the
specific campus location, but should not be
mistaken for suggesting size of geography
covered and apparent overlap or proximity is
incidental.
Page Southerland Page, Inc. 31
Legend
HCC Taxable Area
HCC Service Area
HCC Instructional Locations
1 2,500
All HCC Students
Current HCC Students by Zip Code
Houston Community College Strategic Real Estate Study32
Current HCC Students per Zip Code by Campus
Northwest College
Southwest College
Drilling down to the next level of detail, the six maps at
right show, for each administrative college grouping,
where the students using the highlighted campuses
reside. Generally a correlation emerges between where
students are assigned by college and where they reside.
Exceptions to this occur in the Coleman College, which
draws evenly from the entire service area due to the
specialized nature of coursework offered, and Central
College.
For visual consistency, the scale of each map is the
same (the darkest green on one map relates to the
darkest green on each other map). This consistent scale
allows an accurate cross-map comparison, and shows
that the highest student resident concentration of any
college happens in the northwest.
1 1,400
Students Residing in
Zip Code
Active Campus in College
Other HCC Active Campus
Page Southerland Page, Inc. 33
Northeast College
Southeast CollegeCentral College
Coleman College
Houston Community College Strategic Real Estate Study34
R² = 0.6847
R² = 0.6546
-
2,000
4,000
6,000
8,000
10,000
12,000
14,000
- 100,000 200,000 300,000 400,000 500,000 600,000 700,000 800,000
FTSE
UDHC
Linear (FTSE)
Linear (UDHC)
Spring Branch
Campus
Health Science
Ctr.
Northline
Stafford West Loop
Eastside
Alief-Hayes
Central Campus
Northeast Campus
Campus Building Area (Existing sf)
NumberofStudentsAssignedtoCampus
Katy Campus
Campus Size Analysis
One of the four driving questions of this study asked what is the optimum size of a single
community college campus. There are numerous considerations which inform effective campus
size that do not relate directly to real estate location and are outside the scope of this study,
these can be summarized as level of property investment and current academic functionality.
Analyzing the data which does comprise this study, there appears to be a correlation between
campus size and student use of the campus. The graph above plots the number of students
assigned to each campus (both FTSE in blue and UDHC in orange) vs. the gross building
area recorded at the campus. For both types of student counts there is a positive correlation
between number of students using the campus and facility scale. Further investigation is
needed to understand why some locations appear to be outliers to this observation and to
establish whether there is any causal link between scale and student preference.
Page Southerland Page, Inc. 35
1,821
3,509
705
1,674
828
3,294
3,171
381
1,160
255
5,007
1,528
197
407
154
1,560
2,636
537
KatyCampus
SpringBranchCampus
Alief-Center
Alief-Hayes
GulftonCtr
WestLoopCtr
StaffordCampus
MissouriCityCtr
HealthScienceCtr.
SouthCampus
CentralCampus
NortheastCampus
AutoTechTrainingCtr.
PinemontCenter
NorthForestVoc-Tech
NorthlineCampus
EastsideCampus
FelixFragaAcademic
Student Breakdown by Campus
Full-Time Equivalents and Unduplicated Headcount
FTSE
UDHC
1.678
2.641
1.171
0.573
2.332
1.222
1.400
0.847
0.773
0.654
0.720
0.563
0.273
0.792
0.369
1.354
0.963
0.780
KatyCampus
SpringBranchCampus
Alief-Center
Alief-Hayes
GulftonCtr
WestLoopCtr
StaffordCampus
MissouriCityCtr
HealthScienceCtr.
SouthCampus
CentralCampus
NortheastCampus
AutoTechTrainingCtr.
PinemontCenter
NorthForestVoc-Tech
NorthlineCampus
EastsideCampus
FelixFragaAcademic
Student Use BY Campus Building Area
Full-Time Equivalents and Unduplicated Headcount
FTSE/100sf
UDHC/sf
1.35
3.99
3.07
1.73
7.70
4.27
9.63
1.95
7.47
0.06
4.25
0.33
0.42
7.91
0.08
2.19
3.86
1.15
KatyCampus
SpringBranchCampus
Alief-Center
Alief-Hayes
GulftonCtr
WestLoopCtr
StaffordCampus
MissouriCityCtr
HealthScienceCtr.
SouthCampus
CentralCampus
NortheastCampus
AutoTechTrainingCtr.
PinemontCenter
NorthForestVoc-Tech
NorthlineCampus
EastsideCampus
FelixFragaAcademic
Student Use by Campus Land Area
Full-Time Equivalents and Unduplicated Headcount
FTSE/1000sf
UDHC/sf
Students per 1,000 sf of Building Area
Students per 1,000 sf of Property (Land) Area
Another tool for evaluating
whether campus land and/
or building size is related to
student preference for that
campus is to compare the
students per unit area across
the different campuses. In
this way, the fact that larger
campuses inherently have
more classes to offer students
can be set aside.
The charts at right provide
a visual comparison of the
students per 1,000 square feet
of building (middle chart) and
per 1,000 square feet of land
(bottom chart). If there was a
preference for larger campuses
in general, you would expect
to see the largest physical
campuses to have the highest
intensity of use on a students
per unit area basis.
The top five campuses by
building area are highlighted
vertically across the charts,
with the Central Campus as
the largest by almost 50%
in yellow, and the next four
largest, which are similar in
size to each other, highlighted
in green.
These properties do not reflect
a significantly higher intensity
of use via this graphic analysis,
supporting the conclusion that
more research is needed to
determine how campus size
correlates to student behavior. 4.25
CentralCampus
0.7205,007
mpus
Headcount
Buildin
erty (L
1.2223,2944.27
WestLoopCtr
Stu
tudent
0.573111,67411.73
Alief-Hayes
0.5631,5280.33
NortheastCampus
ggng Are
Land) A
0.963
FTSE
UDHC
2,636
FT
U
3.86
EastsideCampus
FTSE/10
UDHC/s
HCC Student Campus Usage (2014-2015)
Houston Community College Strategic Real Estate Study36
Legend
HCC Taxable Area
HCC Service Area
Aldine ISD
Klein ISD
Cy-Fair ISD
Pearland ISD
Pasadena ISD
Galena Park ISD
Channelview
ISD
Katy ISD
Spring Branch ISD
Alief ISD
Fort Bend ISD
Houston ISD
Stafford
ISD
Students attending HCC from
out-of-district pay a higher tuition
than in-district residents. Given the
availability to many potential students
of other, in-district, alternatives (see
map of other system locations on
School Districts Surrounding HCC Service Area
page 54), HCC enrollment at a higher personal cost is
interesting. Possible explanations include: attendance
convenience closer to work than home, and/or a
preference for HCC environments or course offerings
over those of alternative higher education opportunities.
Page Southerland Page, Inc. 37
Coleman
Central
All HCC
HCC Taxable Area
HCC Service Area
1
# of Students, Fall 2015
3,200
A substantial proportion of current HCC students hail from school districts that are outside of the taxable service area. The maps above show the
relative proportion of students enrolled in the fall of 2015 who originated in non-HCC school districts.The heavier concentration of students to the
west (map left) reflects the heavy use of HCC by students from Katy and Spring Branch ISD
Out of District HCC Students
All and by College
NortheastNorthwest Southwest Southeast
Houston Community College Strategic Real Estate Study38
“... The diversity of students
and of the courses they take
at community colleges poses
a significant challenge for
locating and configuring
community colleges facilities..”
Robert M. Stein, PhD
Lena Gohlman Fox Professor of Political Science, Rice University
Fellow in Urban Politics, Baker Institute for Public Policy
Page Southerland Page, Inc. 39
Community College Students vs.
National Population
4.0 Student characteristics and local demographics
Users of the nation’s 992 community colleges are a diverse group. Nearly half (46%) of all U.S.
undergraduates are enrolled at a community college. The average age of community college
students is 28 with 14% over the age of 40.
In addition to attending a community college, nearly all of these students hold full or part time
employment. Nearly a quarter are full-time students employed full-time; the modal number of
students are part-time students and full time workers. Most importantly, 61% of all attendance at a
community college is part time.
Community college students are largely commuters living at home, with only 25% living in
on-campus housing. Half the students attending a community college are non-Anglo. Among all
Hispanic undergraduates in the U.S. 57% are enrolled in a community college, 52% of African-
American undergraduates attend a community college.
The demographic profile of Houston Community College closely matches that of the other U.S.
community colleges in the top 30 urban metropolitan areas, particularly throughout the south and
south western states.
How community college students use and access the college courses and programs has a
significant influence on the location and configuration of community college facilities. For example,
part-time students, working either full or part-time, have to navigate commuting to community
college sites to attend classes. These commutes might originate from multiple locations, including
residences, work and other places the student might visit during the week e.g., shopping malls.
Community College Student Characteristics - National Trends
Student ethnicity %
White 50%
Hispanic 21%
Black 14%
Asian 6%
Native American 1%
2 or more races 3%
Other/unknown 4%
Nonresident alien 1%
National Research Summary of Community College Students
50%
21% 14% 6% 1%
63%
17% 13% 4% 1%
White Hispanic Black Asian Native
American
4% 6%
Community College Students By Age
Age %
< 21 37%
23-39 49%
40+ 14%
Average Age 28 yrs
Median Age 24 yrs
Full-Time
Students
Part-Time
Students
Employed Full Time 22% 41%
Employed Part Time 40% 32%
By employment status (2011-2012)
US Overall
US CC Enrollment
Houston Community College Strategic Real Estate Study40
Population by Zip
1,196 95,137
Legend
HCC Taxable Area
HCC Service Area
HCC Active Instructional
Houston Area
Population
Distribution
The map on this page shows the population by zip code,
offering a high level picture of how the total population is
distributed across the HCC service area.
Page Southerland Page, Inc. 41
2013 People/ Square
Mile by Zip
63 13,798
Legend
HCC Taxable Area
HCC Service Area
HCC Active Instructional
Houston Area
Population
Density
Because the land area of each zip code varies greatly,
the total population in a zip code should be understood
in light of the population density in addition to the total.
The map on this page shows where the concentration of
people is greatest across the HCC service area.
Houston Community College Strategic Real Estate Study42
10.1%
17.6%
33.1%
16.2%
15.0%
5.5%
2.0% 0.4%
10.3%
15.8%
31.7%
17.0%
15.8%
6.2%
2.7% 0.7%
All Locations
64% of students between 18 & 29 years
4.6%
12.1%
34.1%
20.0%
17.8%
6.9%
3.6%
0.8%
10.8%
12.0%
28.8%
19.2%
18.9%
7.0%
2.7% 0.6%
HCC Students - by Age
6.7%
17.1%
33.6%
17.5%
15.9%
6.1%
2.5%
0.6%
3.1%
13.5%
24.7%
22.6%
21.9%
8.7%
4.6% 1.0%
6.7%
17.1%
33.6%
17.5%
15.9%
6.1%
2.5%
0.6%
Northwest
67% of students 18 to 29 years
Southwest
68% of students 18 to 29 years
Central
66% of students 18 to 29 years
Coleman
61% of students 18 to 29 years
Northeast
60% of students 18 to 29 years
Southeast
60% of students 18 to 29 years
Legend
HCC Student Age
Less than 18 years
18-19 years
20-24 years
25-29 years
30-39 years
40-49 years
50-59 years
60 years & over
Page Southerland Page, Inc. 43
Legend
HCC Taxable Area
HCC Service Area
HCC Active Instructional
Age Group Penetration
23.7%
77087
00.0%
HCC Students - Saturation of Target Age Group Across Service Area
More than 64% of HCC students
are between the ages of 18 and 29
years old. Census data provides
information about the breakdown
of resident’s age by zip code. By
taking the number of HCC students
in a zip code and comparing that
to the total number of residents
in the target age group, we can
approximate the penetration of HCC
enrollment in a given zip code.
By this means we can see that
in 77087 almost a quarter of the
residents between the ages of 15
and 29 are currently enrolled in
HCC. The largest area in the HCC
service area with low penetration
of enrollment in this age group is
the northwest, suggesting that
additional enrollment from that
population may be targeted.
Houston Community College Strategic Real Estate Study44
HCC Students - by Ethnicity
14.8%
31.4%
35.8%
13.8%
4.2%
20.5%
27.1%32.3%
16.3%
3.8%
14.1%
32.1%
31.3%
19.4%
3.2%
13.9%
39.3%29.2%
13.7%
3.9%
14.3%
34.9%
32.1%
15.0%
3.7%
10.2%
38.8%41.1%
7.3%
2.6%
10.3%
33.7%
37.1%
11.9%
7.0%
HCC Enrollment vs. Service Area Demographics
29%
39%
22%
9% 0%15%
36%
31%
14% 0%
White Hispanic Black Asian Native
American
HCC Service Area HCC Enrollment 2015
Legend
Ethnicity
White
Black/African American
Hispanic/Latino
Asian
Other
All Locations
Northwest
Southwest
Central
Coleman
Northeast
Southeast
Page Southerland Page, Inc. 45
HCC Service Area Population Distribution by Ethnicity
White
Hispanic/Latino Black/African American
Asian
0 100%
Proportion of Population in
Zip Code
0 100%
Proportion of Population in
Zip Code
0 100%
Proportion of Population in
Zip Code
0 100%
Proportion of Population in
Zip Code
Houston Community College Strategic Real Estate Study46
Educational Attainment Across HCC Service Area - Proportion at Less than Associates’ Degree
The map on this page shows the proportion of adults with less than an
associate degree as their maximum educational attainment. The darker blue
zip codes reflect areas with a greater proportion of the adult population that
has yet to achieve that degree.
Proportion of Adults with
less than Associate’s Degree
100%0
HCC Taxable Area
HCC Service Area
Page Southerland Page, Inc. 47
Educational Attainment Across HCC Service Area - Number at Less than Associates’ Degree
Number of Adults with less
than Associate’s Degree
41,0001
HCC Taxable Area
HCC Service Area
The map on this page shows the absolute number of adults with less than an associate degree
as their maximum educational attainment. The blue shaded zip codes reflect areas with a higher
number of non-associates’ degree holding adult residents. Target zip codes are different than
the map facing due to the difference in total population from one zip code to another.
Houston Community College Strategic Real Estate Study48
Educational Attainment Across HCC Service Area - Proportion with No Degree That are College Ready
The map on this page shows the proportion of adults with the generally required prerequisites
(High School Diploma, GED, some college coursework) but less than an associate degree as their
maximum educational attainment. The blue shaded zip codes reflect areas with a greater proportion
of the population that might be ‘ready’ for community college coursework by this definition.
Proportion of Adults ‘Ready’
for Community College
100%0
HCC Taxable Area
HCC Service Area
Page Southerland Page, Inc. 49
Educational Attainment Across HCC Service Area - Number with No Degree That are College Ready
The map on this page shows the absolute number of adults with the generally required
prerequisites (High School Diploma, GED, some college coursework) but less than an associate
degree as their maximum educational attainment. The blue shaded zip codes reflect areas with
a higher number of community college ready students. Target zip codes are different than the
map facing due to the difference in total population from one zip code to another.
Number of Adults ‘Ready’
for Community College
41,0001
HCC Taxable Area
HCC Service Area
Houston Community College Strategic Real Estate Study50
“Houston has one of the
youngest, fastest growing,
and diverse populations in
the nation...[with] a sustained
history of strong population
growth.”
Greater Houston Partnership
2015 Houston Economic Highlights, December 7, 2015
Page Southerland Page, Inc. 51
Legend
HCC Taxable Area
HCC Service Area
HCC Active Instructional
Cumulative Annual Population
Growth-2011-2013
Percent: 0-3.8%
5.0 Predictive indicators
Recent Population Growth
Purple and dark purple shaded zip codes in
the map above indicate the zip codes with the
greatest population growth between 2011 and
2013. Over that period, the greatest growth
occurred at the extreme northeast of HCC’s
service area and just west of the service area
beyond Katy. Population growth is also evident
just southeast of the Katy Mills site and on the
east side of downtown. Combined with other
measures of regional opportunity, growth areas
suggest future opportunity.
Houston is a relatively fluid MSA, and population
growth centers change over time, this analysis
should be updated regularly to reflect changes
over time.
Houston Community College Strategic Real Estate Study52
Kashmere
Wheatley
Worthing
0
1,000,000
2,000,000
3,000,000
4,000,000
4,627,881
Land Area Owned (sf)
Legend
HCC Taxable Area
HCC Service Area
Central
Coleman
Northeast
Northwest
Southeast
Southwest
District
College
HCC Active Instructional
Target High School
Attendance Zone:
Schools with lowest 4-yr
Graduation rates in district
Target HS Zones
School Location
Target High School Zones
71% 70%
68%
0%
10%
20%
30%
40%
50%
60%
70%
80%
90%
100%
0% 10% 20% 30% 40% 50% 60% 70% 80% 90% 100%
LastTwo-YearAverage
Average All Years Data Available
Student 4 Yr Graduation Rates by HISD High School
One area of coursework provided
at HCC is GED preparation. An
analysis of High School 4-year
graduation rates across HISD
identifies three schools which
appear to be consistently below
the district average for four-year
graduation rates.
The attendance zones of these three
schools may contain a higher than
average proportion of residents who
would benefit from and may seek
community college coursework.
Page Southerland Page, Inc. 53
0
1,000,000
2,000,000
3,000,000
4,000,000
4,627,881
Land Area Owned (sf)
Legend
HCC Taxable Area
HCC Service Area
Central
Coleman
Northeast
Northwest
Southeast
Southwest
District
College
HCC Active Instructional
Major Employment Centers
(rings represent ~10,000 employed)
1. Central Business District
2. Texas Medical Center
3. Westchase
4. Energy Corridor
5. Greenspoint
6. Greenway Plaza
7. Uptown
8. Port of Houston
9. Memorial City
Employment Centers
1
2
3
4
5
67
8
9
Employment Centers
Source:
Houston Intelligent Transportation System Employment Corridors
Map, maintained by City of Houston Traffic Operations Division
The Houston area is unusual in the
distribution of multiple employment
centers around the city. Since a large
proportion of community college
students work part or full-time while
they attend school, proximity to their
places of employment can be of
great benefit. The map here shows
that 8 of the 9 major employment
centers identified by COH lie within or
immediately adjacent to HCC’s service
area.
Houston Community College Strategic Real Estate Study54
“Community college students
are largely commuters living
at home...[and]...students
working...[who]...have to
navigate commuting to
community college sites to
attend classes.”
Robert M. Stein, PhD
Lena Gohlman Fox Professor of Political Science, Rice University
Fellow in Urban Politics, Baker Institute for Public Policy
Page Southerland Page, Inc. 55
HCC Taxable Area
HCC Service Area
15 Minute Drive Radius
(at 40 mph avg speed)
Current Active - Not Changing
Current Active - Expanding
Legend
North Forest Voc-Tech
Stafford Campus
Spring Branch Campus
Health Science Ctr.
Northeast Campus
Eastside Campus
Pinemont Center
South Campus
Katy Campus
Gulfton Ctr
Central Campus
JP McGovern
Alief - Hayes Road
Alief - Bissonnet Ctr.
West Loop
Felix Fraga
ATTC/Northline Campus
6.0 Distribution, Area Coverage, and Competition
HCC Existing Locations Drive Time Radius Overlap
The HCC service area covers a broad and dispersed metropolitan
area. The distance between campuses ‘as the crow flies’ does
not adequately indicate the real difficulty in reaching each location.
The map on this page shows the calculated fifteen minute drive
radius from each active HCC campus assuming an average speed
of 40mph. This analysis shows substantial overlap between
campuses at the center of HCC’s service area, with the far western
and south eastern portions of the service area served by one
or fewer campus locations. At the far south east and northwest
corners of the service area, no campus is within a fifteen minute
drive radius.
Houston Community College Strategic Real Estate Study56
Acres
Homes
Brays
Oaks
TX Parkway
HCC Taxable Area
HCC Service Area
15 Minute Drive Radius
(at 40 mph avg speed)
Legend
Under Development Radius
(Location)
North Forest Voc-Tech
Stafford Campus
Spring Branch Campus
Health Science Ctr.
Northeast Campus
Eastside Campus
Pinemont Center
South Campus
Katy Campus
Gulfton Ctr
Central Campus
JP McGovern
Alief - Hayes Road
Alief - Bissonnet Ctr.
West Loop
Felix Fraga
ATTC/Northline Campus
HCC Properties Under Development Drive Time Radius
There are three new sites under
development currently. Their calculated
fifteen minute drive radii are shown above.
This analysis shows a fair bit of overlap
between the Brays Oaks and Texas
Parkway sites’ reach. Internal information
indicates that each of these sites is
programmed to meet different needs
than those the Stafford Campus currently
satisfies.
While there is robust population growth
across Fort Bend County, the maps on
pages 46 through 48 indicate that the
current demand for HCC services is
strongest at the Harris County Boundary.
Page Southerland Page, Inc. 57
Sale Pending
Property Under Review
15 Minute Drive Radius
HCC Taxable Area
HCC Service Area
Legend
Westheimer
E Little York
Katy Mills
Midtown Purchase
288/MacGregor
North Forest Voc-Tech Campus
Stafford Campus
Spring Branch Campus
Health Science Ctr.
Northeast Campus
Eastside Campus
Pinemont Center
Missouri City Ctr
South Campus
Katy Campus
Gulfton Ctr
Central Campus
JP McGovern
Alief - Hayes Road
Alief - Bissonnet Ctr.
Acres Homes
Brays Oaks
TX Parkway
West Loop
Felix Fraga
ATTC/Northline Campus
HCC Properties Under Review Drive Time Radius
There are five property locations under review, with their
calculated fifteen minute drive radii shown above. A key
consideration in whether to develop a separate campus
at these locations is how the potential population of
students might overlap with existing campuses.
Houston Community College Strategic Real Estate Study58
All Community Colleges Serving MSA
Clear Horizons Early College High School
University Center at University Park
Sheldon Early College High School
g
Galena Park HS
La Porte College C
North Harris Campus
Aerospace Academy
Greenspoint Center
Sugarland Campus
Richmond Campus
Atascocita Center
Fairbanks Center
Central Campus
Cypress Center
CyFair Campus
North Campus
Victory Center
Pasadena Early
College HS
Clear Lake HS
Small Business
Dev. Ctr.
Maritime and
Tech TC
North Forest Voc-Tech Campus
Stafford Campus
Spring Branch Campus
Health Science Ctr.
Northeast Campus
Eastside Campus
Pinemont Center
Missouri City Ctr
South Campus
Katy Campus
Gulfton Ctr
Central Campus
JP McGovern
Alief - Hayes Road
Alief - Bissonnet Ctr.
Acres Homes
Brays Oaks
TX Parkway
West Loop
Felix Fraga
ATTC/Northline Campus
Legend
HCC Taxable Area
HCC Service Area
HCC
Lone Star
San Jacinto
Wharton County JC
Blinn (closest at Sealy)
The map above shows the locations run by the community college
systems which surround HCC’s service area. While some college system
campuses are well outside of and remote from HCC, both Lone Star to
the northwest and San Jacinto to the southeast operate campuses that
fall near the borders of HCC’s service area.
Page Southerland Page, Inc. 59
Active Campus
15 Minute Drive Radius
Clear Horizons Early College High School
University Center at University Park
Sheldon Early College High School
Health Professionals Building
Galena Park HS
La Porte Colle
North Harris Campus
Aerospace Academy
Greenspoint Center
Sugarland Campus
Richmond Campus
Atascocita Center
Fairbanks Center
Central Campus
Cypress Center
CyFair Campus
North Campus
Victory Center
Pasadena Early
College HS
Clear Lake HS
Small Business
Dev. Ctr.
Maritime and
Tech TC
HCC Taxable Area
HCC Service Area
15 Minute Drive Radius
(at 40 mph avg speed)
Current Active - Not Changing
Current Active - Expanding
Legend
North Forest Voc-Tech Campus
Stafford Campus
Spring Branch Campus
Health Science Ctr.
Northeast Campus
Eastside Campus
Pinemont Center
Missouri City Ctr
South Campus
Katy Campus
Gulfton Ctr
Central Campus
JP McGovern
Alief - Hayes Road
Alief - Bissonnet Ctr.
Acres Homes
Brays Oaks
TX Parkway
West Loop
Felix Fraga
ATTC/Northline Campus
Surrounding System Campuses and HCC Drive Times
The map above superimposes the all-system map at left onto the drive-time radius map for HCC active campuses. By this understanding of
possible population draw area, there are several non-HCC campuses which fall within a convenient drive time of HCC locations.
Given the rising cost of operating academic campuses, Professor Stein notes in his literature review that many community college systems
are experimenting with partnerships to distribute the cost of physical locations among institutions. In the interest of more efficiently serving
the target student population, it may be worth considering partnership opportunities along the perimeter of HCC’s service area with the Lone
Star and San Jacinto College Systems. If HCC negotiated to offer some classes at the Cypress Center location, the existing Katy Campus
might be effectively relocated to the west, improving geographic coverage of the service area and reducing overlap with Spring Branch.
Similarly, if HCC partnered with San Jacinto to locate a campus at the southeast corner, both systems may benefit.
Houston Community College Strategic Real Estate Study60
“...[A] remedy (for the tendency
of single member district
representation to distort the
policy choices of community
colleges) comes in the form of
transparency of information...”
Robert M. Stein, PhD
Lena Gohlman Fox Professor of Political Science, Rice University
Fellow in Urban Politics, Baker Institute for Public Policy
Page Southerland Page, Inc. 61
7.0 Analysis and conclusions
As discussed throughout the previous chapters of this report, there are numerous objective considerations that best
practice research suggests a community college employ when considering real estate location strategies. In order
to inform decisions regarding the existing properties under review and future property acquisition opportunities, all
of the different measures presented in the document have been aggregated into a single map which codes the zip
codes (the most granular level of most of the available data) by relative priority for campus location.
Each of the following measures was given equal weighting on a scale of 1-5:
• Proportion of population at target age (15-29 years)
• Above average representation of ethnicities with higher community college attendance levels
• Population density (people per square mile)
• Educational attainment (less than an Associate’s degree + ‘readiness’ for college coursework)
• Level of population growth (CAGR 2011-2013)
• Location within target high school zone (lowest 4 yr graduation rates in HISD)
• Proximity to employment centers (prioritized by number of people employed)
A score between 1 and 5 for each measure adds up to an overall zip-code by zip-code opportunity score. The map
on the following page illustrates the relative opportunity for each zip code area on the HCC service area map.
The relative priority for each zip code shows how a new community college system, if planned today, might allocate
campus resources. The reality is that HCC has a substantial existing network. Consideration of the opportunity map
requires an evaluation of how the existing network aligns with the identified opportunity locations. The second map
on the following spread (page 63) overlays the drive time radius analyses from the existing campuses to illustrate
how the existing network relates to the priority zip codes identified. To the system’s credit, the current network of
campuses appears to successfully serve all of the priority zip codes identified.
Following that overall system analysis, each of the properties under review is reviewed against the opportunity and
existing overlap map to support a recommendation for that location.
Approach Summary
Houston Community College Strategic Real Estate Study62
Central
Coleman
Northeast
Northwest
Southeast
Southwest
District
Legend
HCC Taxable Area
HCC Service Area
College
Relative Priority
Highest
Lowest
HCC Service Area
North Forest Voc-Tech Campus
Stafford Campus
Spring Branch Campus
Health Science Ctr.
Northeast Campus
Eastside Campus
Pinemont Center
Missouri City Ctr
South Campus
Katy Campus
Gulfton Ctr
Central Campus
JP McGovern
Alief - Hayes Road
Alief - Bissonnet Ctr.
Acres Homes
Brays Oaks
TX Parkway
West Loop
Felix Fraga
ATTC/Northline Campus
Opportunity Prioritization Summary by Zip Code
By the aggregate of opportunity indicators evaluated geographically for this
study, the zip codes representing the greatest location opportunities are shown
in pink on this map. By contrast, the blue shaded zip codes reflect areas of
relatively less opportunity.
Note that this map does not take into account how well the existing network
of HCC campuses covers the opportunity areas, it is purely mapping the
demographic and economic factors discussed previously.
Page Southerland Page, Inc. 63
Opportunity Map vs. Existing HCC Coverage
HCC Taxable Area
HCC Service Area
15 Minute Drive Radius
(at 40 mph avg speed)
Current Active - Not Changing
Current Active - Expanding
Legend
North Forest Voc-Tech Campus
Stafford Campus
Spring Branch Campus
Health Science Ctr.
Northeast Campus
Eastside Campus
Pinemont Center
Missouri City Ctr
South Campus
Katy Campus
Gulfton Ctr
Central Campus
JP McGovern
Alief - Hayes Road
Alief - Bissonnet Ctr.
Acres Homes
Brays Oaks
TX Parkway
West Loop
Felix Fraga
ATTC/Northline Campus
Layering the existing campus drive time radius maps onto the opportunity prioritization by zip code map shows that
all of the highest priority zip codes are served by multiple established campuses. The highest priority zip code with
minimal coverage is at the far west of the service area just to the north and northeast of the Katy campus location.
Campus consolidation opportunities appear to be available in the lower priority locations which are currently served
by multiple campuses. The Gulfton and West Loop campuses are very close to each other and consolidation to a
single location would not appear to change student access. Similarly, the leased Pinemont Center location overlaps
very heavily with the ATTC/Northline campus, suggesting an opportunity to evaluate a shift to the west when the
lease comes up for renewal, improving coverage of the priority zip code to the north.
Houston Community College Strategic Real Estate Study64
Westheimer
Central
Coleman
Northeast
Northwest
Southeast
Southwest
District
Legend
HCC Taxable Area
HCC Service Area
College
Relative Priority
Highest
Lowest
HCC Service Area
North Forest Voc-Tech Campus
Stafford Campus
Spring Branch Campus
Health Science Ctr.
Northeast Campus
Eastside Campus
Pinemont Center
Missouri City Ctr
South Campus
Katy Campus
Gulfton Ctr
Central Campus
JP McGovern
Alief - Hayes Road
Alief - Bissonnet Ctr.
Acres Homes
Brays Oaks
TX Parkway
West Loop
Felix Fraga
ATTC/Northline Campus
The 15-minute drive radius from the Westheimer
property covers numerous high priority zip codes,
suggesting that a campus in that location would draw
from a solid population of potential students.
Westheimer Location
Opportunity Intersection
Page Southerland Page, Inc. 65
Westheimer
HCC Taxable Area
HCC Service Area
15 Minute Drive Radius
(at 40 mph avg speed)
Current Active - Not Changing
Current Active - Expanding
Legend
North Forest Voc-Tech Campus
Stafford Campus
Spring Branch Campus
Health Science Ctr.
Northeast Campus
Eastside Campus
Pinemont Center
Missouri City Ctr
South Campus
Katy Campus
Gulfton Ctr
Central Campus
JP McGovern
Alief - Hayes Road
Alief - Bissonnet Ctr.
Acres Homes
Brays Oaks
TX Parkway
West Loop
Felix Fraga
ATTC/Northline Campus
Overlap Analysis
When viewed in context with the existing and planned
campus location reaches, the Westheimer property
access radius overlaps the existing network substantially
suggesting that the property does not represent a
strategic new campus opportunity at this time.
This map superimposes the ‘under review’
property’s fifteen minute radius against the
existing and planned campuses’ reach.
Houston Community College Strategic Real Estate Study66
Katy Mills
Central
Coleman
Northeast
Northwest
Southeast
Southwest
District
Legend
HCC Taxable Area
HCC Service Area
College
Relative Priority
Highest
Lowest
HCC Service Area
North Forest Voc-Tech Campus
Stafford Campus
Spring Branch Campus
Health Science Ctr.
Northeast Campus
Eastside Campus
Pinemont Center
Missouri City Ctr
South Campus
Katy Campus
Gulfton Ctr
Central Campus
JP McGovern
Alief - Hayes Road
Alief - Bissonnet Ctr.
Acres Homes
Brays Oaks
TX Parkway
West Loop
Felix Fraga
ATTC/Northline Campus
The 15-minute drive radius from the Katy Mills property
primarily covers zip codes that represent the lowest
opportunity for community college students (coded
blue). The higher opportunity zip codes and unserved
northwest corner would be better served by a campus
shifted north and somewhat east, perhaps splitting
the space between the current location and the Katy
Campus site.
Katy Mills Location
Opportunity Intersection
Page Southerland Page, Inc. 67
Katy Mills
HCC Taxable Area
HCC Service Area
15 Minute Drive Radius
(at 40 mph avg speed)
Current Active - Not Changing
Current Active - Expanding
Legend
North Forest Voc-Tech Campus
Stafford Campus
Spring Branch Campus
Health Science Ctr.
Northeast Campus
Eastside Campus
Pinemont Center
Missouri City Ctr
South Campus
Katy Campus
Gulfton Ctr
Central Campus
JP McGovern
Alief - Hayes Road
Alief - Bissonnet Ctr.
Acres Homes
Brays Oaks
TX Parkway
West Loop
Felix Fraga
ATTC/Northline Campus
The 15-minute drive radius from the Katy Mills property only intersects with the
Katy Campus and covers portions of the service area not currently served in a
15-minute radius. This opportunity to reach potential students not well-served
by the existing campus network may prove to be strategic in the future if the
demographic potential at this location improves through population growth or
other change. As mentioned on the facing page, the overlap analysis above
suggests that a location combining the Katy Mills and Katy Campus drive radius
(located between the two existing sites) would better serve the population by
increasing in area coverage and reducing overlap with the Spring Branch Campus.
Overlap Analysis
Houston Community College Strategic Real Estate Study68
E Little York Location
Opportunity Intersection
E Little York
Central
Coleman
Northeast
Northwest
Southeast
Southwest
District
Legend
HCC Taxable Area
HCC Service Area
College
Relative Priority
Highest
Lowest
HCC Service Area
North Forest Voc-Tech Campus
Stafford Campus
Spring Branch Campus
Health Science Ctr.
Northeast Campus
Eastside Campus
Pinemont Center
Missouri City Ctr
South Campus
Katy Campus
Gulfton Ctr
Central Campus
JP McGovern
Alief - Hayes Road
Alief - Bissonnet Ctr.
Acres Homes
Brays Oaks
TX Parkway
West Loop
Felix Fraga
ATTC/Northline Campus
The 15-minute drive radius from the E. Little York
property covers several high opportunity zip codes
(coded pink and orange). In isolation, this property
appears to be a strategic location for a community
college campus.
Page Southerland Page, Inc. 69
E Little York
HCC Taxable Area
HCC Service Area
15 Minute Drive Radius
(at 40 mph avg speed)
Current Active - Not Changing
Current Active - Expanding
Legend
North Forest Voc-Tech Campus
Stafford Campus
Spring Branch Campus
Health Science Ctr.
Northeast Campus
Eastside Campus
Pinemont Center
Missouri City Ctr
South Campus
Katy Campus
Gulfton Ctr
Central Campus
JP McGovern
Alief - Hayes Road
Alief - Bissonnet Ctr.
Acres Homes
Brays Oaks
TX Parkway
West Loop
Felix Fraga
ATTC/Northline Campus
The 15-minute drive radius from the E. Little York
property heavily intersects several existing HCC
campuses. A campus investment at this location would
likely pull students away from existing facilities vs.
reaching new students and the system may be better
served by divesting this property.
Overlap Analysis
Houston Community College Strategic Real Estate Study70
288/MacGregor Location
Opportunity Intersection
288/MacGregor
Central
Coleman
Northeast
Northwest
Southeast
Southwest
District
Legend
HCC Taxable Area
HCC Service Area
College
Relative Priority
Highest
Lowest
HCC Service Area
North Forest Voc-Tech Campus
Stafford Campus
Spring Branch Campus
Health Science Ctr.
Northeast Campus
Eastside Campus
Pinemont Center
Missouri City Ctr
South Campus
Katy Campus
Gulfton Ctr
Central Campus
JP McGovern
Alief - Hayes Road
Alief - Bissonnet Ctr.
Acres Homes
Brays Oaks
TX Parkway
West Loop
Felix Fraga
ATTC/Northline Campus
The 15-minute drive radius from the 288/MacGregor
property covers several high opportunity zip codes
(coded pink and orange). In isolation, this property
appears to be a strategic location for a community
college campus.
Page Southerland Page, Inc. 71
288/MacGregor
Active Campus
15 Minute Drive Radius
HCC Taxable Area
HCC Service Area
15 Minute Drive Radius
(at 40 mph avg speed)
Current Active - Not Changing
Current Active - Expanding
Legend
North Forest Voc-Tech Campus
Stafford Campus
Spring Branch Campus
Health Science Ctr.
Northeast Campus
Eastside Campus
Pinemont Center
Missouri City Ctr
South Campus
Katy Campus
Gulfton Ctr
Central Campus
JP McGovern
Alief - Hayes Road
Alief - Bissonnet Ctr.
Acres Homes
Brays Oaks
TX Parkway
West Loop
Felix Fraga
ATTC/Northline Campus
The 15-minute drive radius from the 288/MacGregor
property heavily intersects several existing HCC
campuses, including the most heavily used, Central. A
campus investment at this location would be convenient
to students already served by multiple existing facilities
and would not appear to serve any new students. Given
the high value of property in this location, the system
may be better served by divesting this property.
Overlap Analysis
Houston Community College Strategic Real Estate Study72
Midtown Purchase
Central
Coleman
Northeast
Northwest
Southeast
Southwest
District
Legend
HCC Taxable Area
HCC Service Area
College
Relative Priority
Highest
Lowest
HCC Service Area
North Forest Voc-Tech Campus
Stafford Campus
Spring Branch Campus
Health Science Ctr.
Northeast Campus
Eastside Campus
Pinemont Center
Missouri City Ctr
South Campus
Katy Campus
Gulfton Ctr
Central Campus
JP McGovern
Alief - Hayes Road
Alief - Bissonnet Ctr.
Acres Homes
Brays Oaks
TX Parkway
West Loop
Felix Fraga
ATTC/Northline Campus
The 15-minute drive radius from the Midtown Purchase
covers all of the highest opportunity zip codes (coded
pink). This property appears to be a strategic location
for a community college campus.
Midtown Purchase Location
Opportunity Intersection
Page Southerland Page, Inc. 73
Midtown Purchase
HCC Taxable Area
HCC Service Area
15 Minute Drive Radius
(at 40 mph avg speed)
Current Active - Not Changing
Current Active - Expanding
Legend
North Forest Voc-Tech Campus
Stafford Campus
Spring Branch Campus
Health Science Ctr.
Northeast Campus
Eastside Campus
Pinemont Center
Missouri City Ctr
South Campus
Katy Campus
Gulfton Ctr
Central Campus
JP McGovern
Alief - Hayes Road
Alief - Bissonnet Ctr.
Acres Homes
Brays Oaks
TX Parkway
West Loop
Felix Fraga
ATTC/Northline Campus
The 15-minute drive radius from the Midtown Purchase
property heavily intersects several existing HCC
campuses. The property is not contiguous with, but lies
within easy walking distance of the Central Campus.
Given the high cost of structured parking and limited
availability of parking space at that location,the site may
effectively serve as excess parking capacity in the short
term until further investment at this location will support
expansion needs of the nearby Central Campus.
Overlap Analysis
Houston Community College Strategic Real Estate Study74
HCC Property
Delano Warehouse
9424 Fannin Warehouse
Central
Coleman
Northeast
Northwest
Southeast
Southwest
District
Legend
HCC Taxable Area
HCC Service Area
College
Warehouse Property
System Admin Bldg.
Active/Planned
Campus
Delano Warehouse Location
Opportunity Analysis
The Delano Warehouse property is also under review in this analysis. The current facility is not in use at this time because it does not
hold a certificate of occupancy from the City of Houston. In order to obtain a certificate of occupancy, significant asbesto abatement
is required and would pose a substantial capital cost. The property was acquired with the intention of usage as warehouse space for
the entire system. Since that acquisition, the warehouse at 9424 Fannin has been put into operation. This larger facility is both without
occupancy complexities and significantly larger than the Delano property. Given that the new warehouse location is effectively serving
system needs with room for expansion if needed, it is recommended that the Delano Warehouse not be planned for future warehouse
capacity.
Page Southerland Page, Inc. 75
Delano Warehouse
9424 Fannin Warehouse
HCC Taxable Area
HCC Service Area
15 Minute Drive Radius
(at 40 mph avg speed)
Current Active - Not Changing
Current Active - Expanding
Legend
Overlap Analysis
The Delano Warehouse location is close to the Central
and Felix Fraga campuses. Holdiing the land for future
campus development does not appear to make sense -
any campus at that location would overlap heavily with
existing campus investments. The Delano Warehouse
site should be divested to free up funds for application
to more effective system use.
Houston Community College Strategic Real Estate Study76
Page Southerland Page, Inc. 77
8.0 Appendix
Full Text : Locating Community College Facilities
by Robert M. Stein, PhD
A review of scholarly and professor literature on the
best practices for locating community college facilities
does not net a set of unambiguous metrics for making
decisions on where to locate community college
facilities. Beyond building facilities near to where
community college students live, work and travel and
anticipating how programmatic content effects location,
there is little more to be gleaned from published
literature on community college facilities.
There is a clear consensus in the literature that the
location of community college facilities requires
understanding the relationship between the instructional
programs at the community college and the composition
of its students and users. This relationship defines not
only where the college might locate its facilities, it also
identifies how college infrastructure/facilities should be
configured and equipped.
It is also important to appreciate that land and space are
both scarce and increasingly expensive. This constraint
on locating community college facilities has been met
with collaborations and partnership between community
colleges and private (e.g., businesses that provide
on work site classrooms for their workers) and public
institutions (e.g., libraries, independent school districts).
The diversity of students and of the courses they take
at community colleges poses a significant challenge for
locating and configuring community colleges facilities
(see Related Note, following for more detail). A trend in
community college facilities, concurrent-use campuses,
may hold promise for the future.
A concurrent-use campus (Taber 1995; Windham et
al 2001) is a community college campus that is shared
with:
• Independent school districts
• General purpose governments
• Private for-profit businesses
• Non-profits
• Four year colleges and universities
“Due to increased demand for facilities space and library
resources, community colleges are finding it beneficial to
share the cost of information storage and dissemination
with other organizations such as public library systems
or even other community colleges (Windham et al
2001:3).”
“Consortia of community colleges and universities
appear to be one of the best vehicles that community
colleges can use to meet the challenges placed before
them and to establish and maintain their proper place in
the educational community” (May & Smith, 1992, p. 63;
Jadallah, 1994).
Houston Community College Strategic Real Estate Study78
Examples of concurrent campuses
A multi-university facility has been established at North
Harris Montgomery Community College. This facility
enables 6 public universities to work together to offer
21 unduplicated bachelor’s and 24 master’s degree
programs. These programs, although offered by six
different four-year institutions, share a single admissions
process and financial aid application process. It is
reported that coursework is easily transferred among
institutions. Technology is an integral part of this
partnership, and the facility has an extensive technology
infrastructure, as 40% of the University Center’s
instruction is delivered via interactive distance learning.
In 1997, the Oklahoma State Regents approved a
consortium of four community colleges to exchange low
enrollment and specialized courses via electronic media.
The Regents also endorsed a proposal for a consortium
of five institutions to provide cooperative instructional
services including electronic delivery of courses
and programs. The status report also called for the
improvement of quality and efficiency in the system, with
collaboration, coordination, and mergers of functions
across campuses.
The logic of shared facilities suggests (Taber 1995)
• Collaborative arrangements with other
organizations to develop needed facilities offer
some advantages that planners should consider.
• Sharing a facility usually costs less than funding
and maintaining separate facilities; and shared
facilities can provide access to a valuable
location that is otherwise unavailable.
• They also can provide access to special physical
resource needs such as adequate parking or
expensive recreational facilities or libraries.
• Shared facilities other than classrooms, such as
cafeterias or bookstores, can ensure adequate
customer markets.
• Shared facilities can offer multiple services to
students or clients who would otherwise find the
need to visit two or more different facilities.
• Each partner can use the shared facility at
a different “prime time,” which means more
efficient use of a resource
Bibliography
Jadallah, E. 1994. “The community education center:
A model for school-university partnerships” American
Secondary Education, 22 (4), 23–27.
May, G., & Smith, A. 1992. “Gaining stature through
community college-university consortia.” In B.W.
Dziech and W.R. Viler (Eds.), Prisoners of Elitism: The
Community College’s Struggle for Stature (pp. 63–76).
New Directions for Community Colleges, No. 78.
National Center for Education Statistics (NCES) .2014.
2011-12 National Postsecondary Student Aid Study
(NPSAS:12) [AACC analysis] http://nces.ed.gov/datalab/
National Center for Education Statistics (NCES) .2014.
IPEDS Fall 2013 Enrollment Survey. https://nces.ed.gov/
pubsearch/pubsinfo.asp?pubid=2015012
Taber, L.S. (1995). ERIC Review: Collaboration as a
vehicle for community college facilities development.
Community College Review, 23 (3), 73–87.
Windham, Patricia, George Perkins, Jon Rogers. 2001.
“Concurrent-Use Campuses: Part of the New Definition
of Access,” Community College Review 29:3.
Page Southerland Page, Inc. 79
Users of community colleges
Users of the nation’s 992 community colleges are a diverse group. Nearly half
(46%) of all U.S. undergraduates are enrolled at a community college. The
average age of community college students is 28 with 14% over the age of 40.
In addition to attending a community college, nearly all of these students hold full
or part time employment. Nearly a quarter is full-time students employed full-
time; the modal number of students are part-time students and full time workers.
Most importantly, 61% of all attendance at a community college is part time.
Community college students are largely commuters living at home, with only
25% living in on- campus housing. Half the students attending a community
college are non-Anglo. Among all Hispanic undergraduates in the U.S. 57% are
enrolled in a community college, 52% of African-Americans undergraduates
attend a community college.
The demographic profile of Houston Community College closely matches that
of the other U.S. community colleges in the top 30 urban metropolitan areas,
particularly throughout the south and south western states.
How community college students use and access the college courses and
programs has a significant influence on the location and configuration of
community college facilities. For example, part-time students working, either full
or part-time have to navigate commuting to community college sites to attend
classes. These commutes might originate from multiple locations, including
residences, work and other places the student might visit during the week e.g.,
shopping malls.
Offerings of community colleges
Community colleges offer a wide range of courses and degree programs. These
offerings include courses of study for a two year Associates degree leading
to the enrollment in a Bachelor’s degree program at a four year college or
university. A significant portion of community college students are enrolled in
courses for specific work place certification (e.g., emergency medical technician,
cosmetologist). Moreover, many certificate courses of instruction can and do
take place at the workplace. This allows workers to train on equipment for
which they are seeking proficiency and certification. More importantly it reduces
the capital demand on community colleges to purchase and house expensive
equipment. Classes conducted at the students’ workplace reduces commute
time for the student/worker and lessens likelihood the student will miss a class.
1.NCES (2014) 2011-12 National Postsecondary Student Aid Study
(NPSAS:12) [AACC analysis]
2.NCES. (2014). 2011-12 National Postsecondary Student Aid Study (NPSAS:
12) [AACC analysis].
3.NCES (2014). IPEDS Fall 2013 Enrollment Survey [AACC analysis].
Related Note: An overview of community college users and programs-Nationally
Community College
Students by Age
Community College
Students by
Employment Status
Community College
Students by Ethnicity
Age %
< 21 37%
23-39 49%
40+ 14%
Average Age 28 yrs
Median Age 24 yrs
Full-Time
Students
Part-Time
Students
Employed Full Time 22% 41%
Employed Part Time 40% 32%
y p y ( )
Student ethnicity %
White 50%
Hispanic 21%
Black 14%
Asian 6%
Native American 1%
2 or more races 3%
Other/unknown 4%
Nonresident alien 1%
Houston Community College Strategic Real Estate Study80
Excerpt from Memo: Discussion Regarding
Possible Classification of Instructional
Sites
Upon completion of the CIP, the System will have at least 28 distinct
operating locations, as well as other property holdings. These locations
are currently designated as “Building”, “Campus”, “Center”, “College”,
and Facility; without regard to size, population or function. Going forward,
a common rubric may be useful, especially as facilities become less
specifically identified with geographic colleges and more as portals to
articulation pathways and the Centers of Excellence.
The following taxonomy has been suggested by staff:
Site – An off-campus property that is not currently used to provide mission
related services.
Station – An off-campus location that promotes access to College services
in a location or to a population not otherwise served by the College. Stations
typically serve a population of 500 or fewer full-time student equivalents.
They offer a very limited array of courses and/or programs and do not entail
a permanent commitment for continued service. Should demand decrease or
fail to materialize, courses and programs can be discontinued and resources
moved to areas of greater demand. Stations normally provide only program
related administrative functions.
Branch – A facility or group of facilities serving a population of fewer than
3,000, but more than 500 Full Time Student Equivalents. A campus branch
is a major secondary location, with limited administrative and logistical
support services and which is normally reliant upon a parent campus for the
provision of a full range of services. Branches offer a broad array of entry
level courses and courses not requiring specialized facilities or laboratories.
Where specialized programs of study are represented, they will either
address a specific local need or have sufficient throughput to provide for a
high utilization of laboratory facilities. Branches typically exist to reduce entry
barriers and operate as feeders to a parent campus or Center of Excellence
program.
Campus – A facility or group of facilities serving a population of 3,000
or more Full Time Student Equivalents. A campus provides complete
administrative and logistical support services and is typically (but not
always) comprised of more than one building. A campus may often occupy
a significant number of lots, tracts, or parcels of land. A campus is designed
to function as a unified whole, providing both a sense of place and the
accoutrements normally expected of a higher education environment.
A campus typically offers a full spectrum of courses, programs, and
administrative and support services.
Page Southerland Page, Inc. 81
Summary Property List
Name/Label Final Aggregate Property
Group/Other Name
Total Land
Area (sf)
College/
Admin Unit
LatitudeAVGLongitudeAV Existing
Building Area
(sf)
Expanded
Building Area
(sf)
FTSE UDHC Status
System Admin Building District 163,085 District 29.74196 -95.37682 558,450 558,450 Existing
Warehouse-9424 Fannin Warehouse-9424 Fannin 593,726 District 29.66738 -95.40483 124,245 124,245 Existing
Warehouse-Delano Warehouse-Delano 31,260 District 29.74666 -95.35062 40,000 40,000 Under Review
South Campus South Campus 4,527,626 Central 29.64286 -95.38957 39,000 103,959 255 996 Expanding
Central Campus Central Campus 1,176,885 Central 29.73702 -95.37728 701,150 731,348 5,007 11,109 Expanding
288/MacGregor 288/MacGregor 396,706 Central 29.71609 -95.37741 Under Review
Midtown Purchase Midtown Purchase 178,605 Central 29.73500 -95.37348 Under Review
Health Science Ctr. Health Science Ctr. 155,302 Coleman 29.70349 -95.40514 140,000 378,242 1,160 2,657 Expanding
John P. McGovern John P. McGovern Campus 10,800 Coleman 29.70551 -95.38430 10,800 10,800 Leased/Under Review
Northeast Campus Northeast Campus 4,521,631 Northeast 29.78096 -95.25647 271,370 271,370 1,528 3,171 Existing
Auto Tech Training Ctr. Auto Tech Training Ctr. 203,866 Northeast 29.83234 -95.38448 72,059 72,059 197 325 Existing
Pinemont Center Pinemont Center 51,435 Northeast 29.84094 -95.42568 51,368 51,368 407 1,393 Leased/Existing
North Forest Voc-Tech North Forest Voc-Tech Campus 1,919,002 Northeast 29.86981 -95.29952 41,753 107,653 154 507 Expanding
Northline Campus Northline Campus 976,266 Northeast 29.83344 -95.37645 115,225 166,731 1,560 3,483 Expanding
Acres Homes Houston Trade Fair Property 492,637 Northeast 29.86979 -95.41074 - 25,120 - - Under Development
Donation-E Little York Donation-E Little York 214,350 Northeast 29.87151 -95.27295 Under Review
Katy Campus Katy Campus 1,347,931 Northwest 29.79043 -95.71437 108,503 108,503 1,821 4,152 Existing
Spring Branch Campus Spring Branch Campus 878,694 Northwest 29.78737 -95.56147 132,856 132,856 3,509 8,314 Existing
Alief - Bissonnet Center Alief - Center 229,613 Northwest 29.68073 -95.62514 60,220 60,220 705 757 Existing
Alief - Hayes Road Alief - Hayes 965,367 Northwest 29.73615 -95.57614 292,000 411,048 1,674 4,591 Expanding
Westheimer West Oaks 1,019,412 Northwest 29.73740 -95.63004 - - - Under Review
Katy Mills Katy Mills 81,418 Northwest 29.77259 -95.81338 11,003 11,003 Under Review
Eastside Campus Eastside Campus 683,107 Southeast 29.70442 -95.29644 288,559 333,007 2,636 5,680 Expanding
Felix Fraga Academic Felix Fraga Academic Campus 466,014 Southeast 29.74992 -95.33444 68,805 105,237 537 1,389 Expanding
Gulfton Ctr Gulfton Ctr 107,519 Southwest 29.71563 -95.47509 35,500 35,500 828 1,047 Existing
West Loop Ctr West Loop Ctr 771,032 Southwest 29.72160 -95.45846 269,451 294,451 3,294 7,936 Expanding
Stafford Campus Stafford Campus 329,403 Southwest 29.62788 -95.55954 239,472 277,717 3,171 7,868 Expanding
Sienna Plantation Center Missouri City Ctr 195,253 Southwest 29.53331 -95.53789 45,000 45,000 381 1,218 Sale Pending
Brays Oaks Brays Oaks 558,421 Southwest 29.65550 -95.52803 - 27,189 - - Under Development
Texas Parkway Center TX Parkway 1,826,435 Southwest 29.60270 -95.52884 - 67,825 Under Development
Total 25,072,801 3,716,789 4,550,901
Houston Community College Strategic Real Estate Study Houston, Texas

More Related Content

What's hot

Faculty advising handbook_last_revision_august2011
Faculty advising handbook_last_revision_august2011Faculty advising handbook_last_revision_august2011
Faculty advising handbook_last_revision_august2011
Houston Community College
 
HCC_District_Planning&Institutional Effectivness_Strategicplan2012
HCC_District_Planning&Institutional Effectivness_Strategicplan2012HCC_District_Planning&Institutional Effectivness_Strategicplan2012
HCC_District_Planning&Institutional Effectivness_Strategicplan2012
Houston Community College
 
KPIs for College and Career Readiness
KPIs for College and Career ReadinessKPIs for College and Career Readiness
KPIs for College and Career Readiness
Naviance
 
SampleInstitutional Planning and Accoutability
SampleInstitutional Planning and AccoutabilitySampleInstitutional Planning and Accoutability
SampleInstitutional Planning and Accoutability
Todd Long
 

What's hot (20)

HCC Transformation Phase 2 Fall 2016 Update
HCC Transformation Phase 2 Fall 2016 UpdateHCC Transformation Phase 2 Fall 2016 Update
HCC Transformation Phase 2 Fall 2016 Update
 
Faculty advising handbook_last_revision_august2011
Faculty advising handbook_last_revision_august2011Faculty advising handbook_last_revision_august2011
Faculty advising handbook_last_revision_august2011
 
HCC_District_Planning&Institutional Effectivness_Strategicplan2012
HCC_District_Planning&Institutional Effectivness_Strategicplan2012HCC_District_Planning&Institutional Effectivness_Strategicplan2012
HCC_District_Planning&Institutional Effectivness_Strategicplan2012
 
Houston Community College Strategic Plan
Houston Community College Strategic PlanHouston Community College Strategic Plan
Houston Community College Strategic Plan
 
HCC Transformation Journey: Turnaround Journey
HCC Transformation Journey: Turnaround JourneyHCC Transformation Journey: Turnaround Journey
HCC Transformation Journey: Turnaround Journey
 
HCC Performance Scorecard (Ending April 2016)
HCC Performance Scorecard (Ending April 2016)HCC Performance Scorecard (Ending April 2016)
HCC Performance Scorecard (Ending April 2016)
 
HCC Strategic Plan Executive Summary
HCC Strategic Plan Executive SummaryHCC Strategic Plan Executive Summary
HCC Strategic Plan Executive Summary
 
Student Success & Experience
Student Success & ExperienceStudent Success & Experience
Student Success & Experience
 
University Leadership Summit: HCC Chancellor Presentation
University Leadership Summit:  HCC Chancellor PresentationUniversity Leadership Summit:  HCC Chancellor Presentation
University Leadership Summit: HCC Chancellor Presentation
 
Massachusetts Early College Initiative Launch
Massachusetts Early College Initiative LaunchMassachusetts Early College Initiative Launch
Massachusetts Early College Initiative Launch
 
"Future of Work," presented July 30, 2021
"Future of Work," presented July 30, 2021"Future of Work," presented July 30, 2021
"Future of Work," presented July 30, 2021
 
Moving from Programs of Study to Rigorous Programs of Study in Oklahoma
Moving from Programs of Study to Rigorous Programs of Study in OklahomaMoving from Programs of Study to Rigorous Programs of Study in Oklahoma
Moving from Programs of Study to Rigorous Programs of Study in Oklahoma
 
KPIs for College and Career Readiness
KPIs for College and Career ReadinessKPIs for College and Career Readiness
KPIs for College and Career Readiness
 
GuidanceFest 2010 : Peace and Love - CTE and Academics
GuidanceFest  2010 : Peace and Love - CTE and AcademicsGuidanceFest  2010 : Peace and Love - CTE and Academics
GuidanceFest 2010 : Peace and Love - CTE and Academics
 
Early College Programming in Massachusetts
Early College Programming in MassachusettsEarly College Programming in Massachusetts
Early College Programming in Massachusetts
 
SampleInstitutional Planning and Accoutability
SampleInstitutional Planning and AccoutabilitySampleInstitutional Planning and Accoutability
SampleInstitutional Planning and Accoutability
 
Lessons from the U.S. and California for Sichuan University Faculty and Admin...
Lessons from the U.S. and California for Sichuan University Faculty and Admin...Lessons from the U.S. and California for Sichuan University Faculty and Admin...
Lessons from the U.S. and California for Sichuan University Faculty and Admin...
 
Cooperative Alliance Update
Cooperative Alliance UpdateCooperative Alliance Update
Cooperative Alliance Update
 
Charting the Future
Charting the Future Charting the Future
Charting the Future
 
San Diego And Imperial Valley Intro
San Diego And Imperial Valley IntroSan Diego And Imperial Valley Intro
San Diego And Imperial Valley Intro
 

Similar to Houston Community College Strategic Real Estate Study Houston, Texas

stem-focused-technology-mediated-advising-reform
stem-focused-technology-mediated-advising-reformstem-focused-technology-mediated-advising-reform
stem-focused-technology-mediated-advising-reform
Markeisha Grant
 
THE COMPLEX AND MULTI-FACETED NATURE OF SCHOOL CONSTRUCTION COSTS: Factors Af...
THE COMPLEX AND MULTI-FACETED NATURE OF SCHOOL CONSTRUCTION COSTS: Factors Af...THE COMPLEX AND MULTI-FACETED NATURE OF SCHOOL CONSTRUCTION COSTS: Factors Af...
THE COMPLEX AND MULTI-FACETED NATURE OF SCHOOL CONSTRUCTION COSTS: Factors Af...
Dave Andrews
 
OSWALD Balancing Undergrad Dems
OSWALD Balancing Undergrad DemsOSWALD Balancing Undergrad Dems
OSWALD Balancing Undergrad Dems
Chaz Oswald
 
Social Justice Across the Curriculum
Social Justice Across the CurriculumSocial Justice Across the Curriculum
Social Justice Across the Curriculum
Rikki Wheatley
 
State of the University Address 2010
State of the University Address 2010State of the University Address 2010
State of the University Address 2010
Public Affairs
 
Accreditation system from_ussr_for_sc-1987-2pgs-edu
Accreditation system from_ussr_for_sc-1987-2pgs-eduAccreditation system from_ussr_for_sc-1987-2pgs-edu
Accreditation system from_ussr_for_sc-1987-2pgs-edu
RareBooksnRecords
 

Similar to Houston Community College Strategic Real Estate Study Houston, Texas (20)

stem-focused-technology-mediated-advising-reform
stem-focused-technology-mediated-advising-reformstem-focused-technology-mediated-advising-reform
stem-focused-technology-mediated-advising-reform
 
Using Data to Improve Minority-Serving Institution Success
Using Data to Improve Minority-Serving Institution SuccessUsing Data to Improve Minority-Serving Institution Success
Using Data to Improve Minority-Serving Institution Success
 
PBH 805: Week 6 Slides
PBH 805: Week 6 SlidesPBH 805: Week 6 Slides
PBH 805: Week 6 Slides
 
A Mixed Methods Sampling Methodology For A Multisite Case Study
A Mixed Methods Sampling Methodology For A Multisite Case StudyA Mixed Methods Sampling Methodology For A Multisite Case Study
A Mixed Methods Sampling Methodology For A Multisite Case Study
 
THE COMPLEX AND MULTI-FACETED NATURE OF SCHOOL CONSTRUCTION COSTS: Factors Af...
THE COMPLEX AND MULTI-FACETED NATURE OF SCHOOL CONSTRUCTION COSTS: Factors Af...THE COMPLEX AND MULTI-FACETED NATURE OF SCHOOL CONSTRUCTION COSTS: Factors Af...
THE COMPLEX AND MULTI-FACETED NATURE OF SCHOOL CONSTRUCTION COSTS: Factors Af...
 
A cross case analysis of career pathway programs
A cross case analysis of career pathway programsA cross case analysis of career pathway programs
A cross case analysis of career pathway programs
 
CCWT Intro at CSCC Conference
CCWT Intro at CSCC ConferenceCCWT Intro at CSCC Conference
CCWT Intro at CSCC Conference
 
NCLC-Final
NCLC-FinalNCLC-Final
NCLC-Final
 
Disrupted Futures 2023 | Learning from large-scale, longitudinal datasets
Disrupted Futures 2023 | Learning from large-scale, longitudinal datasetsDisrupted Futures 2023 | Learning from large-scale, longitudinal datasets
Disrupted Futures 2023 | Learning from large-scale, longitudinal datasets
 
OSWALD Balancing Undergrad Dems
OSWALD Balancing Undergrad DemsOSWALD Balancing Undergrad Dems
OSWALD Balancing Undergrad Dems
 
A Public Health Information System For Conducting Community Health Needs Asse...
A Public Health Information System For Conducting Community Health Needs Asse...A Public Health Information System For Conducting Community Health Needs Asse...
A Public Health Information System For Conducting Community Health Needs Asse...
 
Social Justice Across the Curriculum
Social Justice Across the CurriculumSocial Justice Across the Curriculum
Social Justice Across the Curriculum
 
Does the CAA Need Further Revision? – Perspective from a Scholar Practitioner
Does the CAA Need Further Revision? – Perspective from a Scholar PractitionerDoes the CAA Need Further Revision? – Perspective from a Scholar Practitioner
Does the CAA Need Further Revision? – Perspective from a Scholar Practitioner
 
A formula for success: a four-year referendum journey
A formula for success: a four-year referendum journeyA formula for success: a four-year referendum journey
A formula for success: a four-year referendum journey
 
fox__EDU 645_final paper
fox__EDU 645_final paperfox__EDU 645_final paper
fox__EDU 645_final paper
 
State of the University Address 2010
State of the University Address 2010State of the University Address 2010
State of the University Address 2010
 
Measurement Memo Re: Measuring the Impact of Student Diversity Program
Measurement Memo Re: Measuring the Impact of Student Diversity ProgramMeasurement Memo Re: Measuring the Impact of Student Diversity Program
Measurement Memo Re: Measuring the Impact of Student Diversity Program
 
Dr. David Salvesen - Nashville Area School Siting Symposium
Dr. David Salvesen - Nashville Area School Siting SymposiumDr. David Salvesen - Nashville Area School Siting Symposium
Dr. David Salvesen - Nashville Area School Siting Symposium
 
Accreditation system from_ussr_for_sc-1987-2pgs-edu
Accreditation system from_ussr_for_sc-1987-2pgs-eduAccreditation system from_ussr_for_sc-1987-2pgs-edu
Accreditation system from_ussr_for_sc-1987-2pgs-edu
 
HCC Research Presentation
HCC Research PresentationHCC Research Presentation
HCC Research Presentation
 

More from Houston Community College

More from Houston Community College (20)

Chancellor’s Legislative Testimony
Chancellor’s Legislative TestimonyChancellor’s Legislative Testimony
Chancellor’s Legislative Testimony
 
HCC Trustee Orientation
HCC Trustee OrientationHCC Trustee Orientation
HCC Trustee Orientation
 
Houston Community College Small Business Development Program Procedures
Houston Community College Small Business Development Program ProceduresHouston Community College Small Business Development Program Procedures
Houston Community College Small Business Development Program Procedures
 
Procurement policies and procedures 10 15 18
Procurement policies and procedures 10 15 18Procurement policies and procedures 10 15 18
Procurement policies and procedures 10 15 18
 
Houston Community Common Data Set 2020-2021
Houston Community Common Data Set 2020-2021Houston Community Common Data Set 2020-2021
Houston Community Common Data Set 2020-2021
 
HCC Board of Trustee Bylaws
HCC Board of Trustee BylawsHCC Board of Trustee Bylaws
HCC Board of Trustee Bylaws
 
Technology Resource Regulation CR2
Technology Resource Regulation CR2Technology Resource Regulation CR2
Technology Resource Regulation CR2
 
HCC Board of Trustee Bylaws
HCC Board of Trustee BylawsHCC Board of Trustee Bylaws
HCC Board of Trustee Bylaws
 
Quarter One 2019-2020: Chief Executive Officer's Report
Quarter One 2019-2020: Chief Executive Officer's ReportQuarter One 2019-2020: Chief Executive Officer's Report
Quarter One 2019-2020: Chief Executive Officer's Report
 
Sexual Assault Policy for Employees
Sexual Assault Policy for EmployeesSexual Assault Policy for Employees
Sexual Assault Policy for Employees
 
Sexual Assault Policy for Students
Sexual Assault Policy for StudentsSexual Assault Policy for Students
Sexual Assault Policy for Students
 
HCC Board of Trustee Bylaws
HCC Board of Trustee BylawsHCC Board of Trustee Bylaws
HCC Board of Trustee Bylaws
 
2018-2019 Comprehensive Annual Financial Report
2018-2019 Comprehensive Annual Financial Report2018-2019 Comprehensive Annual Financial Report
2018-2019 Comprehensive Annual Financial Report
 
2019 HCC Annual Clery Security Report
2019 HCC Annual Clery Security Report2019 HCC Annual Clery Security Report
2019 HCC Annual Clery Security Report
 
HCC 2019 Procurement Plan (revised)
HCC 2019 Procurement Plan (revised)HCC 2019 Procurement Plan (revised)
HCC 2019 Procurement Plan (revised)
 
HCC Common Data Set 2018-2019
HCC Common Data Set 2018-2019HCC Common Data Set 2018-2019
HCC Common Data Set 2018-2019
 
How to recognize an email scam
How to recognize an email scamHow to recognize an email scam
How to recognize an email scam
 
2013 CAPITAL IMPROVEMENT PROGRAM (THROUGH 31 OCTOBER 2018)
2013 CAPITAL IMPROVEMENT PROGRAM (THROUGH 31 OCTOBER 2018)2013 CAPITAL IMPROVEMENT PROGRAM (THROUGH 31 OCTOBER 2018)
2013 CAPITAL IMPROVEMENT PROGRAM (THROUGH 31 OCTOBER 2018)
 
2013 CAPITAL IMPROVEMENT PROGRAM (THROUGH 30 APRIL 2018)
2013 CAPITAL IMPROVEMENT PROGRAM (THROUGH 30 APRIL 2018)2013 CAPITAL IMPROVEMENT PROGRAM (THROUGH 30 APRIL 2018)
2013 CAPITAL IMPROVEMENT PROGRAM (THROUGH 30 APRIL 2018)
 
2013 CAPITAL IMPROVEMENT PROGRAM (THROUGH 31 AUGUST 2018)
2013 CAPITAL IMPROVEMENT PROGRAM (THROUGH 31 AUGUST 2018)2013 CAPITAL IMPROVEMENT PROGRAM (THROUGH 31 AUGUST 2018)
2013 CAPITAL IMPROVEMENT PROGRAM (THROUGH 31 AUGUST 2018)
 

Recently uploaded

Spellings Wk 3 English CAPS CARES Please Practise
Spellings Wk 3 English CAPS CARES Please PractiseSpellings Wk 3 English CAPS CARES Please Practise
Spellings Wk 3 English CAPS CARES Please Practise
AnaAcapella
 
Salient Features of India constitution especially power and functions
Salient Features of India constitution especially power and functionsSalient Features of India constitution especially power and functions
Salient Features of India constitution especially power and functions
KarakKing
 
1029 - Danh muc Sach Giao Khoa 10 . pdf
1029 -  Danh muc Sach Giao Khoa 10 . pdf1029 -  Danh muc Sach Giao Khoa 10 . pdf
1029 - Danh muc Sach Giao Khoa 10 . pdf
QucHHunhnh
 

Recently uploaded (20)

Introduction to Nonprofit Accounting: The Basics
Introduction to Nonprofit Accounting: The BasicsIntroduction to Nonprofit Accounting: The Basics
Introduction to Nonprofit Accounting: The Basics
 
This PowerPoint helps students to consider the concept of infinity.
This PowerPoint helps students to consider the concept of infinity.This PowerPoint helps students to consider the concept of infinity.
This PowerPoint helps students to consider the concept of infinity.
 
SOC 101 Demonstration of Learning Presentation
SOC 101 Demonstration of Learning PresentationSOC 101 Demonstration of Learning Presentation
SOC 101 Demonstration of Learning Presentation
 
2024-NATIONAL-LEARNING-CAMP-AND-OTHER.pptx
2024-NATIONAL-LEARNING-CAMP-AND-OTHER.pptx2024-NATIONAL-LEARNING-CAMP-AND-OTHER.pptx
2024-NATIONAL-LEARNING-CAMP-AND-OTHER.pptx
 
FSB Advising Checklist - Orientation 2024
FSB Advising Checklist - Orientation 2024FSB Advising Checklist - Orientation 2024
FSB Advising Checklist - Orientation 2024
 
Spatium Project Simulation student brief
Spatium Project Simulation student briefSpatium Project Simulation student brief
Spatium Project Simulation student brief
 
Application orientated numerical on hev.ppt
Application orientated numerical on hev.pptApplication orientated numerical on hev.ppt
Application orientated numerical on hev.ppt
 
Spellings Wk 3 English CAPS CARES Please Practise
Spellings Wk 3 English CAPS CARES Please PractiseSpellings Wk 3 English CAPS CARES Please Practise
Spellings Wk 3 English CAPS CARES Please Practise
 
Salient Features of India constitution especially power and functions
Salient Features of India constitution especially power and functionsSalient Features of India constitution especially power and functions
Salient Features of India constitution especially power and functions
 
Graduate Outcomes Presentation Slides - English
Graduate Outcomes Presentation Slides - EnglishGraduate Outcomes Presentation Slides - English
Graduate Outcomes Presentation Slides - English
 
Google Gemini An AI Revolution in Education.pptx
Google Gemini An AI Revolution in Education.pptxGoogle Gemini An AI Revolution in Education.pptx
Google Gemini An AI Revolution in Education.pptx
 
Towards a code of practice for AI in AT.pptx
Towards a code of practice for AI in AT.pptxTowards a code of practice for AI in AT.pptx
Towards a code of practice for AI in AT.pptx
 
1029 - Danh muc Sach Giao Khoa 10 . pdf
1029 -  Danh muc Sach Giao Khoa 10 . pdf1029 -  Danh muc Sach Giao Khoa 10 . pdf
1029 - Danh muc Sach Giao Khoa 10 . pdf
 
ComPTIA Overview | Comptia Security+ Book SY0-701
ComPTIA Overview | Comptia Security+ Book SY0-701ComPTIA Overview | Comptia Security+ Book SY0-701
ComPTIA Overview | Comptia Security+ Book SY0-701
 
Holdier Curriculum Vitae (April 2024).pdf
Holdier Curriculum Vitae (April 2024).pdfHoldier Curriculum Vitae (April 2024).pdf
Holdier Curriculum Vitae (April 2024).pdf
 
Dyslexia AI Workshop for Slideshare.pptx
Dyslexia AI Workshop for Slideshare.pptxDyslexia AI Workshop for Slideshare.pptx
Dyslexia AI Workshop for Slideshare.pptx
 
Sociology 101 Demonstration of Learning Exhibit
Sociology 101 Demonstration of Learning ExhibitSociology 101 Demonstration of Learning Exhibit
Sociology 101 Demonstration of Learning Exhibit
 
Making communications land - Are they received and understood as intended? we...
Making communications land - Are they received and understood as intended? we...Making communications land - Are they received and understood as intended? we...
Making communications land - Are they received and understood as intended? we...
 
Micro-Scholarship, What it is, How can it help me.pdf
Micro-Scholarship, What it is, How can it help me.pdfMicro-Scholarship, What it is, How can it help me.pdf
Micro-Scholarship, What it is, How can it help me.pdf
 
Key note speaker Neum_Admir Softic_ENG.pdf
Key note speaker Neum_Admir Softic_ENG.pdfKey note speaker Neum_Admir Softic_ENG.pdf
Key note speaker Neum_Admir Softic_ENG.pdf
 

Houston Community College Strategic Real Estate Study Houston, Texas

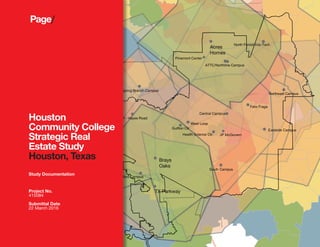
  • 1. Sale Pending Property Under Review 15 Minute Drive Radius Missouri City Ctr HCC Taxable Area HCC Service Area gend Acres Homes Brays Oaks TX Parkway North Forest Voc-Tech Stafford Campus Spring Branch Campus Health Science Ctr. Northeast Campus Eastside Campus Pinemont Center South Campus Katy Campus Gulfton Ctr Central Campus JP McGovern Alief - Hayes Road Alief - Bissonnet Ctr. West Loop Felix Fraga ATTC/Northline Campus CC Taxable Area CC Service Area te Drive Radius mph avg speed) rent Active - Not Changing rent Active - Expanding nd fStafforrdff SprrinCKaty CCampusCCCC Alieiefef - Hefief etet Ctr.nneet ref - Bissonnef - BissoAlieefAlieef - Bisf - Bisef - Bisef -efef ssosoonnononnsoooBissssss CCC Taxable Area CCC Service Area tte Drive Radius mph avg speed) rrent Active - Not Changing rrent Active - Expanding nnd Study Documentation Project No. 415084 Submittal Date 22 March 2016 Houston Community College Strategic Real Estate Study Houston, Texas
  • 2. Houston Community College Strategic Real Estate Study2 “Build facilities near where students live, work and travel...and anticipate how programmatic content affects location” Robert M. Stein, PhD Lena Gohlman Fox Professor of Political Science, Rice University Fellow in Urban Politics, Baker Institute for Public Policy
  • 3. Page Southerland Page, Inc. 3 Key Questions Driving Study The Houston Community College System (HCC), in the course of delivering upon its educational mission, owns numerous real estate properties. These properties serve as active educational campuses, administrative operational bases, and placeholders for future educational or administrative needs. Properties were acquired over time in support of intended service and growth plans, or were gifted to the College. Periodic review and realignment of real estate inventory is necessary to assure ongoing asset alignment with system plans and regional realities. This strategic real estate study analyzes both system provided and publically available data to outline an objective framework to inform key real estate decisions. The key questions this study addresses are: 1. What is the optimum distance between educational campuses in a community college network? 2. What is the optimum size of a single community college campus? 3. Are there any identifiable areas within the HCC service area where a campus does not currently exist, but objective research suggests a campus should be located? 4. Are any of the existing HCC properties currently operating as (or targeted as future) educational campuses in the wrong place, or poorly located based upon objective considerations? Two parallel approaches to addressing these questions are reflected in this report. In the first, Robert M. Stein, PhD, in his role as Empirical Researcher and Demographic Analyst, conducted a review of published literature and consensus best practices for community college system planning to identify any established guidelines that might inform or direct the HCC real estate strategy. In the second, PageSoutherlandPage, Inc. (Architects - hereinafter, Page) built from Stein’s research to compile demographic and geographic data in a series of maps showing different characteristics of the service area and real estate network. The convergence of these parallel approaches establishes an objective basis for further exploration. Executive Summary
  • 4. Houston Community College Strategic Real Estate Study4 Review of Published Literature from “Locating Community College Facilities” by Robert M. Stein, PhD For the complete text of Stein’s review, please see chapter 7 at the end of this document. A review of scholarly published literature on the best practices for locating community college facilities does not net a set of unambiguous metrics for making decisions on where to locate community college facilities. Beyond building facilities near to where community college students live, work and travel and anticipating how programmatic content effects location, there is little more to be gleaned from published literature on community college facilities. There is a clear consensus in the literature that the location of community college facilities relates to the relationship between the instructional programs at the community college and the composition of its students and users. This relationship defines not only where the college might locate its facilities, it also identifies how college infrastructure/facilities should be configured and equipped. This study is charged with measurable, location-based analysis, and location-based instructional evaluation will not be addressed in this report. Study Context In June of 2011, HCC published the HCC System Facilities Master Plan: 2011-2033. This comprehensive plan summarizes a full year of research and consultation with numerous HCC leaders and stakeholders aimed to create a “clear vision for all future development of the physical environment of Houston Community College Systemin support of its academic missions and goals.” Recognizing that both HCC and the region served by the system will evolve, the plan recommended regular updates. Five years later, this supplementary study builds directly on the vision established in the 2011 master plan. One of the four key methods employed in the master plan was, “identification of the main drivers that impact basic decisions about facility location.” The main drivers identified are: demographics, accessibility, and enrollment pipeline. A combination of the key questions, Stein’s research, and these drivers serve to organize this real estate study. Disclaimer - This study was completed over a period of months during which some situational changes occurred. In particular, the planned sale of the Missouri City Sienna Plantation campus was completed on 26 February 2016. There may be isolated references to this campus which do not reflect that change in condition.
  • 5. Page Southerland Page, Inc. 5 Demographic and Geographic Analyses Current Use Analysis Objective analysis logically builds from the explicit historical data available. Today, each of the existing HCC academic campuses serve different numbers of students. When comparing the relative student use by campus with the zip code of origin of HCC students, it appears that students are in some cases traveling past a campus that is closer to their home in order to attend classes. One possibilie explanation is that students are willing to travel further to attend a larger location with more of a campus feel. This study does find a positive correlation between building size and level of student usage, but without further analysis into other possible drivers like relative course offerings and facility quality/amenities the role of campus size in student preference is difficult to disaggregate. Further study is required to identify optimal campus size. Another analysis of student location with respect to campuses shows that a substantial number of HCC students are identified as coming from outside the taxing district (23% in Fall 2015). The majority of these hail from Katy, Spring Branch and Fort Bend ISD, but students originate from all the surrounding districts. This demand suggests growth opportunity is strong to the west. Comparative maps are employed in this report to geographically illustrate the current population, population density, and population by target (most common community college attending) age. Additionally, proportion of population by ethnicity is mapped to highlight how the diversity of HCC’s service area is distributed geographically. Following are a series of maps that look at educational attainment of the resident population, showing both all the adults with less than an associate’s degree as their highest attainment and those adults who are community college ready (possess college readiness degrees or credentials). To supplement these analyses of where potential students reside today, a series of maps looks at forward indicators of potential students. First, a population growth map shows where the service area is experiencing the fastest population growth. Second, the public high schools with the lowest 4-year graduation rates are mapped, with their attendance boundaries, to suggest where the GED and college prep population needs are greatest. Finally, the major Houston area employment centers are located to show job centers which support part-time and working students. The final analysis explores where community college campuses currently exist, locating all of the surrounding community college system campuses as well as analyzing the effective overlap of existing HCC sites through evaluation of the 15 minute drive-time radius from each active and planned campus.
  • 6. Houston Community College Strategic Real Estate Study6 Conclusions The demographic and geographic analyses aggregate up into a zip-code level priority map that highlights the geographic locations of greatest potential based upon an even weighting of seven geographic prioritization measures (see box below). This priority map locates the ideal geographic areas for community college campuses across the HCC service area, irrespective of the current network of HCC facilities. •Population at target age (15-29 years) •Representative ethnicity concentration •Population density •Educational attainment and ‘readiness’ for college coursework •Population growth •Low 4 yr graduation rate high school zones •Employment center proximity Geographic Prioritization Measures Recommendations and conclusions for this real estate strategy are drawn from examination of the existing network of HCC campuses and their overlapping ‘convenient access areas’ (as measured by the drive-time radius analysis) against the priority map created. In every case, the highest priority zip codes identified are being served by more than one HCC campus location. This suggests that the established network of campuses effectively targets the priority students, and there may be opportunities for consolidation as operational and financial considerations are evaluated. On the facing page, each of the property holdings which are ‘under review’ in the current inventory, meaning that they are owned by HCC but no current plans exist to develop a campus or administrative building on the site, is discussed in detail with respect to the priority population that might be reached from that location and the overlap with existing or under development facility resources. Additionally, several consolidation opportunities are identified with properties that overlap heavily in their effective reach.
  • 7. Page Southerland Page, Inc. 7 Recommendations Specific recommendations for the properties under review are: • Westheimer - Divest property: location covers a high priority geography but has extensive overlap with existing and planned HCC campuses • Katy and Katy Mills - Divest property: Evaluate the potential to ultimately divest Katy Mills and the current Katy campus in favor of a new campus better serving the western reaches of the service area. The current placement of the Katy campus means roughly half of its 15 minute drive radius is already served by the Spring Branch Campus. At the same time, the Katy Mills property, which covers geography well to the west of and distinct from Spring Branch is too small to support substantial development. • 288/MacGregor - Divest property: location covers a high priority geography, but is very close to numerous existing campuses which already serve that priority geography well • E. Little York - Divest property: location is well located with respect to priority geography on the north east side of the service area, but is very close to numerous existing campuses and would not serve a new population from that location • Midtown Purchase - Hold as parking and future expansion for Central campus: location is sufficiently close to the existing central campus to realize efficiencies in operation and investment as inexpensive overflow surface parking in the immediate, and future expansion space for the Central Campus in the future. • Delano Warehouse - Divest property. Specific recommendations for consolidation of existing properties are: • Gulfton - Divest property: location has heavy overlap with the West Loop campus and a small student body, suggesting that consolidation with the West Loop location and the new center at Brays Oaks will utilize resources more effectively. • Pinemont (Leased) - When lease is up, look for opportunities to either consolidate operations with Northline or shift the campus west to improve geographic coverage and reduce the overlap with the ATTC/Northline campus facility.. Future property location opportunities may be evaluated against the established geographic priority map and the overlapping existing campus drive-radius map to determine whether the real estate represents an objective opportunity to serve the target HCC student population effectively.
  • 8. Houston Community College Strategic Real Estate Study8 “...the relationship between the instructional programs at the community college and the composition of its students and users...defines not only where the college might locate its facilities, it also identifies how college infrastructure/facilities should be configured and equipped.” Robert M. Stein, PhD Lena Gohlman Fox Professor of Political Science, Rice University Fellow in Urban Politics, Baker Institute for Public Policy
  • 9. Page Southerland Page, Inc. 9 4.0 Student characteristics and local demographics 39 Community College Student Characteris- tics - National Trends 40 Houston Area Population Distribution 41 Houston Area Population Density 42 HCC Students - by Age 43 HCC Students - Saturation of Target Age Group Across Service Area 44 HCC Students - by Ethnicity 45 HCC Service Area Population Distribution by Ethnicity 46 Educational Attainment Across HCC Service Area - Proportion at Less than Associates’ Degree 47 Educational Attainment Across HCC Service Area - Number at Less than Asso- ciates’ Degree 48 Educational Attainment Across HCC Service Area - Proportion with No Degree That are College Ready 49 Educational Attainment Across HCC Service Area - Number with No Degree That are College Ready 5.0 Predictive indicators 51 Recent Population Growth 52 Target High School Zones 53 Employment Centers 1.0 Definitions, Funding, and Oversight 15 Definitions, Service and Taxing Areas 16 School Districts Within HCC Service Area 18 Administrative Organization and Breakdown 19 HCC Trustee District Boundaries 2.0 HCC Real Estate Property Summary 21 Introduction 22 HCC Existing Real Estate by Property Status 23 Complete Property Listing 24 Real Estate Building and Land Area by Loca- tion 3.0 Academic Property Usage 30 Students By Primary Campus 31 Current HCC Students by Zip Code 32 Current HCC Students per Zip Code by Campus 34 Campus Size Analysis 36 School Districts Surrounding HCC Service Area 37 Out of District HCC Students Contents/ 01 02 03 04 05
  • 10. Houston Community College Strategic Real Estate Study10 6.0 Distribution, Area Coverage, and Competition 55 HCC Existing Locations Drive Time Radius Overlap 56 HCC Properties Under Development Drive Time Radius 57 HCC Properties Under Review Drive Time Radius 58 All Community Colleges Serving MSA 59 Surrounding System Campuses and HCC Drive Times 7.0 Analysis and conclusions 61 Approach Summary 62 Opportunity Prioritization Summary by Zip Code 63 Opportunity Map vs. Existing HCC Coverage 64 Westheimer Location 66 Katy Mills Location 68 E Little York Location 70 288/MacGregor Location 72 Midtown Purchase Location 74 Delano Warehouse Location 8.0 Appendix 77 Full Text : Locating Community College Facilities 79 Related Note: An overview of community college users and programs-Nationally 80 Excerpt from Memo: Discussion Regarding Possible Classification of Instructional Sites 81 Summary Property List 82 Complete Property List 07 08 06
  • 11. Page Southerland Page, Inc. 11 System Leadership/ Board of Trustees Dr. Adriana Tamez, Chair, District III Robert Glaser, Vice Chair, District V Dr. Carolyn Evans-Shabazz, Secretary, District IV Zeph Capo, District I David B. Wilson, District II Dr. John P. Hansen, District VI Neeta Sane, District VII Eva L. Loredo, District VIII Christopher W. Oliver, District IX Executive Cabinet Dr. Cesar Maldonado, Chancellor Teri Zamora, Sr. Vice Chancellor, Finance & Administration Dr. Kimberly Beatty, Vice Chancellor, Instructional Services, CAO Dr. Butch Herod, Vice Chancellor, Innovation Planning & Institutional Analytics E. Ashley Smith, General Counsel Frederica Guthrie, Director, Communication Services Dr. Melissa Gonzalez, Chief of Staff
  • 12. Houston Community College Strategic Real Estate Study12 Acknowledgements/ This document represents the compilation of months of work organized and led by PageSoutherlandPage, Inc. (Page) in consultation with key Administrators of Houston Community College and under the direction of Charles D. Smith, PE, Chief Facilities Officer Houston Community College. Page gratefully extends its gratitude to all participants from HCC for sharing their time and leadership. Jeff Bricker is committed to improving the quality of life in Houston through his architectural practice. A proud native Houstonian, he has managed many large, complex projects for educational, government, and business clients in his hometown. Previously a principal of Bricker + Cannady Architects, he now provides Page with technical and managerial direction on a number of important public projects for the City of Houston and Harris County, as well as an array of other building types for private sector clients. Bricker + Cannady was folded into Page when Jeff was invited to join the firm in 2004. Jeff is equally passionate about his commitment to civic service efforts in Houston, often sharing local developments and updates with staff and encouraging their interest and involvement in city governance. A longtime community leader, he has been involved in the planning, strategy and fundraising for numerous bond elections and local political campaigns. As he points out, “Our responsibility doesn’t end when we complete projects that improve the way people live. We also have a duty as citizens to ensure that quality of life continues through community involvement.” Jeff has served on the boards of Southwest Houston 2000, The Park People, Leadership Houston, and the American Red Cross. In addition, he has been active with the Greater Houston Partnership, having served as the former chair of its Local Government Relations Committee and Federal Government Relations Committee, a founding member of its Partnership’s Quality of Life Committee, and former chair of a taskforce on sensible growth for its Business Issues Committee. His projects include the Jones Plaza in Houston’s Theatre District, several buildings within the Discovery Green downtown park, the Houston Area Women’s Shelter, the Student Services Center for the University of Houston’s downtown campus, more than 80 municipal parks under the auspices of the City of Houston’s Parks to Standard Program, development of the master plan for the Harris County parks system, and the Maverick Activities Center at the University of Texas at Arlington. Several recent projects for the University of Houston have helped to transform its main campus. Those include the Student Recreation and Wellness Center, the West Dining Facility, and the 800-bed Cougar Place student housing projects. The $120 million football stadium, initially accommodating 40,000 spectators but designed to be expanded in the future to add another 20,000 seats, further expands his campus portfolio. Jeff Bricker, AIA, Principal in Charge
  • 13. Page Southerland Page, Inc. 13 Jamie Flatt, Principal, Strategic and Geographic Analyst Also a proud native Houstonian, Jamie first brought her exceptional creativity and business acumen to predesign projects at Page in 2005. She arrived at the profession of architecture via a circuitous route: psychology major/pre-med student at Harvard, management consultant focused on emergence of the internet and modernization of banking networks right out of school, then internal strategist at a New York investment bank for two years, finally rounded out by a brief stint as fulfillment manager at a media marketing firm before getting her MArch at Rice. At Page, Jamie has led predesign projects across numerous market sectors including academic, civic, government, corporate, and public safety. Notable projects include a needs assessment for the Houston Police Department Headquarters consolidation (still the basis for the proposed Houston Justice Complex), a service and facility master plan for the Houston Public Library, and a master plan for ADNOC’s Petroleum Institute campus in Abu Dhabi. Prior to joining Page, she served as an associate in the Corporate Strategy Group at Lehman Brothers in New York developing firm-wide strategic planning and analysis. Jamie also served as an analyst for a strategic consulting firm in Washington, D.C., where she conducted retail network optimization analyses for a major retail bank across multiple markets. Robert M. Stein, PhD, Empirical Researcher and Demographic Analyst Robert M. Stein, Ph.D., is the fellow in urban politics at the Baker Institute and the Lena Grohlman Fox Professor of Political Science at Rice University. He also is the faculty director of Rice’s Center for Civic Engagement. Stein’s current research focuses on alternative modes of elections and voting procedures in the United States; emergency preparedness, behavioral response to severe weather events, and risk assessment; and home weatherization programs in low- and moderate-income households. His work has been supported by the National Science Foundation, the City of Houston’s Office of Public Safety and Homeland Security, the Environmental Defense Fund and Pew Charitable Trusts, among others. Stein is co-author of “Perpetuating the Pork Barrel: Policy Subsystems and American Democracy” (Cambridge University Press, 1995) and author of “Urban Alternatives: Public and Private Markets in the Provision of Local Services” (Pittsburgh Press, 1990). He has received the Outstanding Reviewer Award from Political Research Quarterly and the Best Paper Award on Federalism and Intergovernmental Relations (with Kenneth Bickers) from the American Political Science Association. He teaches courses on public policy, urban politics and political behavior at Rice, where twice he has been awarded the George R. Brown Award for Superior Teaching. Stein received his bachelor’s degree from Ohio Wesleyan University. He earned his master’s and doctoral degree from the University of Wisconsin–Milwaukee. Aaron Jones, AIA, Associate Principal, Project Manager
  • 14. Houston Community College Strategic Real Estate Study14 “The board of trustees of a junior college district may accept or acquire by purchase or rent land and facilities in the name of the junior college district within the junior college district’s service area.” Texas Education Code Title 3, Subchapter G Section 130.086
  • 15. Page Southerland Page, Inc. 15 1.0 Definitions, Funding, and Oversight Definitions, Service and Taxing Areas Like all junior college systems in Texas, HCC is regulated by the state education code. The following text is from Title 3, Subchapter G, Section 130: Higher Education, Non-Baccalaureate System, Junior College Districts. This code articulates the specific rules governing property considerations for Junior Colleges. Sec. 130.161. 2): “Service area” means: (A) the territory within the boundaries of the taxing district of a junior college district; and (B) the territory outside the boundaries of the taxing district of a junior college district in which the junior college district provides services. Sec. 130.182 defines the service area of the Houston Community College System District as including the territory within: • the Houston, Alief, Katy, Spring Branch, and North Forest independent school districts; • the Stafford Municipal School District; and • the part of the Fort Bend Independent School District that is located in the municipalities of Houston, Missouri City, and Pearland. See map on following page.
  • 16. Houston Community College Strategic Real Estate Study16 Legend HCC Taxable Area HCC Service Area HCC Property Katy ISD Spring Branch ISD Alief ISD Fort Bend ISD Houston ISD Stafford ISD School Districts Within HCC Service Area Only that part of the Fort Bend Independent School District that is located in the municipalities of Houston, Missouri City, and Pearland is included in the HCC Service Area.
  • 17. Page Southerland Page, Inc. 17 The college has several funding options available to fund the purchase or construction of campus facilities: General Obligation Bonds repayment funded by debt portion of ad valorem taxes* Public Finance Corporation (PFC) Lease Revenue Bonds repayment funded from pledged PFC lease revenues Revenue Bonds repayment funded from pledged operating revenues Public Private Partnership (P3) funded by operations under partnership agreement Fund Balance funded from cash accumulated from previous years’ operations and from disposition of assets Tuition and Fee Revenues tuition and fee rates set by HCC Board of Trustees; available for all valid expenses of the college Operation and Maintenance Tax ad valorem tax rates set by HCC Board of Trustees; available for all valid expenses of the college within the taxing district only The two* primary options available to the college for operation of campus facilities include: * General Obligation Bonds require approval by an election of the voters within the HCC taxing district, and may not be used to fund locations outside of the taxing district. * HCC’s other primary funding stream received from state appropriations must be used exclusively to pay for instructional and administrative salaries, and supplies and materials for instructional purposes. The defined service area is larger in the case of HCC than the established taxable area. Within the designated service area, Spring Branch and Katy ISD residents have not yet voted to support HCC directly via property taxes. As a result, students residing in the district, but outside of the taxable area pay tuition at out-of-district rates.
  • 18. Houston Community College Strategic Real Estate Study18 Administrative Organization and Breakdown The Houston Community College System district is divided up into nine trustee districts for the purpose of representation and oversight. The map on the facing page illustrates the trustee district breakdown. One benefit of the current study is that it highlights the reality that many community college students attend classes closer to where they work, shop and travel each day than to where they sleep. Professor Stein’s previous publications on the challenges of democratic governance structures imply that continuing to provide the types of information assembled by the Administration and reported herein regarding where the students living in each district actually engage HCC will materially assist Trustees in making sound decisions and explaining them to the electorate.1,2 1. Robert M. Stein and Kenneth N. Bickers. 1995. Perpetuating the Pork Barrel: Policy Subsystems and American Democracy. Cambridge University Press 2. Aggregated information on student enrollment by campus can be provided to trustees, preserving the confidentiality and privacy of individuals students.
  • 19. Page Southerland Page, Inc. 19 I II IIIIV V VI VII VIII IX Legend HCC Taxable Area HCC Service Area HCC Teaching Site HCC Trustee District Boundaries
  • 20. Houston Community College Strategic Real Estate Study20 “...HCC currently serves a 622 square mile service area via 3.7 million square feet of academic buildings on 576 acres of property ...” Aggregate of Master Property Data
  • 21. Page Southerland Page, Inc. 21 2.0 HCC Real Estate Property Summary The Houston Community College System (HCC), in the course of delivering upon its educational mission, owns numerous real estate properties. These properties serve as active educational campuses, administrative operational bases, and placeholders for future educational or administrative needs. Properties were acquired over time in support of intended service and growth plans, or were gifted to the College. The entire inventory of properties held by HCC are included in this study. 187 separate parcels are separately accounted for (either by name or appraisal district designation). A large number of these parcels are contiguous or adjacent to one another and for the purpose of this analysis have been aggregated into 26 distinct tracts. Re-platting these properties would simplify asset management, ongoing analysis and public explanation of land holdings, however, such re-platting efforts should be carefully considered as part of other work, as the standalone cost of reducing 187 plats to 26 locations could easily exceed two million dollars. Properties are grouped by current administrative entity or ‘College’ where applicable and then designated as one of the following types, depending on the current plans for that location. Introduction • Existing - Developed property in current service not currently slated for growth or disposition. • Expanding - Developed property in current service being expanded as part of the current construction program. • Under Review - Current holding that is not in active service and which the administration has asked Consultant to specifically comment upon. • Under Development - Current property that is the site of new facility under contract for construction. • Sale Pending - Current property being divested by the College Total Area of Land Parcels Analyzed, by Status (square feet) Total Building Area Grouped, by Property Status (square feet) 1,414,571 2,909,393 61,803 120,134 45,000 Existing Expanding Under Review Under Development Sale Pending 8,097,500 11,970,004 1,932,551 2,877,493 195,253 Existing Expanding Under Review Under Development Sale Pending Current Area
  • 22. Houston Community College Strategic Real Estate Study22 0 1,000,000 2,000,000 3,000,000 4,000,000 4,627,881 Land Area Owned (sf) Legend HCC Taxable Area HCC Service Area Central Coleman Northeast Northwest Southeast Southwest District College Existing/In Use - No change planned Expanding Campus Under Development Property Under Review Sale Pending Leased Property Status North Forest Voc-Tech Campus Stafford Campus Warehouse-9424 Fannin Spring Branch Campus Health Science Ctr. Northeast Campus Eastside Campus Pinemont Center Missouri City Ctr South Campus Katy Campus Gulfton Ctr Katy Mills Central Campus Westheimer JP McGovern System Admin Alief - Hayes Road Alief - Bissonnet Ctr. Acres Homes Brays Oaks TX Parkway West Loop 288/MacGregor Midtown Purchase Felix Fraga Whse-Delano ATTC/Northline Campus E Little York HCC Existing Real Estate by Property Status Analysis and objective review of the existing facilities is complicated by the different property and location names utilized for the various properties in inventory. Upon completion of the CIP, the System will have at least 28 distinct operating locations, in addition to remote sites. These locations are currently designated as “Building”, “Campus”, “Center”,“College”, and “Facility”; without apparent regard to size, population or function. As HCC moves towards the ‘Centers of Excellence’ strategy a more consistent naming approach would simplify communications and administration of the various facilities (see facility director’s memo excerpt in appendix).
  • 23. Page Southerland Page, Inc. 23 Complete Property Listing Administrative Unit Specific Location Land Area (sf) Current Status District System Admin Building 163,085 Existing Warehouse-9424 Fannin 593,726 Existing Warehouse-Delano 31,260 Under Review Central South Campus 4,527,626 Expanding Central Campus 1,176,885 Expanding 288/MacGregor 396,706 Under Review Midtown Purchase 178,605 Under Review Coleman Health Science Ctr. 155,302 Expanding John P. McGovern 10,800 Leased/Under Review Northeast Northeast Campus 4,521,631 Existing Auto Tech Training Ctr. 203,866 Existing Pinemont Center 51,435 Leased/Existing North Forest Voc-Tech 1,919,002 Expanding Northline Campus 976,266 Expanding Acres Homes 492,637 Under Development Donation-E Little York 214,350 Under Review Northwest Katy Campus 1,347,931 Existing Spring Branch Campus 878,694 Existing Alief - Bissonnet Center 229,613 Existing Alief - Hayes Road 965,367 Expanding West Houston Inst. 1,019,412 Under Review Katy Mills 81,418 Under Review Southeast Eastside Campus 683,107 Expanding Felix Fraga Academic 466,014 Expanding Southwest Gulfton Ctr 107,519 Existing West Loop Ctr 771,032 Expanding Stafford Campus 329,403 Expanding Missouri City Ctr 195,253 Sale Pending Brays Oaks 558,421 Under Development TX Parkway 1,826,435 Under Development *Note that the properties comprising the Stafford Campus are not currently contiguous, with several plots a short distance away on . Discussions are underway with the local municipality to swap land that is adjacent to the HCC campus for these sites. Given the increased functionality and flexibility that contiguous properties provide, it is recommended that the land swap be pursued. *
  • 24. Houston Community College Strategic Real Estate Study24 Real Estate Building and Land Area by Location Established/Planned Total Land Area(square feet) Building Area (square feet) 292,000 269,451 237,252 140,000 0.08 0.15 0.26 0.43 0.33 0.38 0.84 0.23 0.05 0.03 1.00 2.44 FAR NORTHWEST SOUTHWEST COLEMAN 108,503 132,856 60,220 411,048 35,500 294,451 275,497 27,189 45,000 67,825 10,800 378,242 1,347,931 878,694 229,613 965,367 107,519 771,032 329,403 195,253 558,421 1,826,435 10,800 155,302 Katy Campus Spring Branch Campus Alief - Bissonnet Center Alief - Hayes Road Gulfton Center West Loop Center Stafford Campus Sienna Plantation Center Brays Oaks TX Parkway Center John P. McGovern Health Science Ctr. Each property listed on the preceding page is illustrated on the charts to the right (and following page). Properties are grouped by administrative unit. The length of the gray bars on the left are sized to show the relative area of HCC buildings on the land. The darker gray represents the future, or planned area, while the lighter gray represents the current building area. The bars extending to the right are sized to show the relative size of the land available at that location and are color-coded by the status of the property (existing, expanding, under review, etc.). Properties with larger gray bars and smaller colored bars are more constrained in their potential for future growth than properties with larger colored bars and smaller gray bars. This ratio of building to land area is sometimes called the Floor to Area Ratio or FAR. The lower FAR properties have substantially more opportunity for growth (e.g. Texas Parkway Center) than the properties with an FAR greater than 1.0 (e.g. the Health Science Ctr.)
  • 25. Page Southerland Page, Inc. 25 Total Land Area(square feet) Building Area (square feet) FAR NORTHWEST 39,000 41,753 115,225 288,559 68,805 701,150 0.02 0.62 0.21 3.42 0.06 0.35 1.00 0.03 0.17 0.23 0.05 0.49 CENTRAL DISTRICT NORTHEAST SOUTHEAST 103,959 124,245 558,450 271,370 72,059 51,368 107,653 166,731 25,120 333,007 105,237 731,348 4,527,626 1,176,885 593,726 163,085 4,521,631 203,886 51,435 1,919,002 976,266 492,637 683,107 466,014 South Campus Central Campus Warehouse-9424 Fannin System Administration Building Northeast Campus Auto Tech Training Ctr. Pinemont Center North Forest Voc-Tech Northline Campus Acres Homes Eastside Campus Felix Fraga Academic Floor Area Ratio (FAR) is the ratio of a building’s total floor area (gross floor area in square feet) to the size of the piece of land upon which it is built (square feet of land). FAR is a measure of site development density. The color codes visually highlight the very dense sites (towards red on the spectrum) vs. the much less dense sites (towards green on the spectrum). Legend Building Area (sf) Floor to Area Ratio (FAR) Land Area (sf) Existing/In Use No change planned Expanding Campus Under Development Sale Pending Leased Existing Future/Expanded Least Greatest
  • 26. Houston Community College Strategic Real Estate Study26 81,418 Katy Mills 396,706 288/MacGregor 178,605 Midtown Purchase 214,350 Donation-E Little York 1,019,412 31,260 Westheimer Warehouse-Delano 40,000 Specific suggestions for each property under review are outlined in the final chapter of this report, Chapter 7. Real Estate Building and Land Area by Location Properties Under Review Total Land Area(square feet) Building Area (square feet) FAR NORTHWEST
  • 27. Page Southerland Page, Inc. 27 Map of all properties - size of land holding indicated 0 1,000,000 2,000,000 3,000,000 4,000,000 4,627,881 Land Area Owned (sf) Legend HCC Taxable Area HCC Service Area Central Coleman Northeast Northwest Southeast Southwest District College North Forest Voc-Tech Campus Stafford Campus Warehouse-9424 Fannin Spring Branch Campus Health Science Ctr. North mpus Eastside Campus Pinemont Center Missouri City Ctr South Campus Katy Campus Gulfton Ctr Katy Mills Central Campus Westheimer JP McGovern System Admin Alief - Hayes Road Alief - Bissonnet Ctr. Acres Homes Brays Oaks TX Parkway West Loop 288/MacGregor Midtown Purchase Felix Fraga Whse-Delano ATTC/Northline Campus E Little York W Park ieim C h m c-Tec hline res n oouss s uth am WWWW ParkParkParkPark iiiiiiii hh c-T- ec-T- ecc-Tecc-Tec inelinelineline resres nnnnn uussuss ss th Camth Camth amth am The map on this page shows the geographic location of each property studied, with the circle size indicating relative land area of each property. The bubbles do not correspond to actual geographic map scale, but are relevant for comparison of each property to the others. The South Campus and Northeast Campus are the largest aggregations of land within HCC.
  • 28. Houston Community College Strategic Real Estate Study28 “How community college students use and access the college courses and programs has a significant influence on the location and configuration of community college facilities.” Robert M. Stein, PhD Lena Gohlman Fox Professor of Political Science, Rice University Fellow in Urban Politics, Baker Institute for Public Policy
  • 29. Page Southerland Page, Inc. 29 3.0 Academic Property Usage FTSE UDHC 2,000 4,000 6,000 8,000 10,000 2,000 4,000 6,000 8,000 10,000 2,000 1,821 3,509 705 1,674 828 3,294 3,171 381 1,160 255 5,007 1,528 197 407 154 1,560 2,636 537 KatyCampus SpringBranch Campus Alief-Center Alief-Hayes GulftonCtr West LoopCtr Stafford Campus Missouri CityCtr HealthScience Ctr. SouthCampus Central Campus Northeast Campus AutoTech TrainingCtr. Pinemont Center NorthForest Voc-Tech NorthlineCampus Eastside Campus FelixFraga Academic FTSE UDHC FTSE UDHC FTSE UDHC FTSE UDHC FTSE UDHC FTSE UDHC CENTRAL NORTHEASTNORTHWEST SOUTHWEST SOUTHEASTCOLEMAN The charts above show the Fall 2014 Full-Time Student Equivalent (FTSE) campus usage for each campus (darker bar with count of FTSEs) alongside the Unduplicated Head Count (UDHC). UDHC counts all the students who use a specific campus, with duplications removed, but there is no distinction between students who are present for three hours per week and those who are present for forty hours per week. Thus UDHC is useful for the calculation of student fees, to understand the administrative load upon a campus, and to inform decisions about certain types of space, such as libraries and recreation centers that may be used by all categories of students. FTSE is the customary measure used in facility planning because it equalizes the time impact on the facility of different types of students. At HCC, FTSE is calculated by dividing the total number of instructional contact hours by 240, which is the number of contact hours in a 15 credit hour academic semester. The use of both measures allows the district to make informed decisions about space planning, and to combine data about different types of student usage on an equivalent basis for the purpose of comparison. Fall 2014 Data
  • 30. Houston Community College Strategic Real Estate Study30 0 1,000,000 2,000,000 3,000,000 4,000,000 4,627,881 Land Area Owned (sf) Legend HCC Taxable Area HCC Service Area Central Coleman Northeast Northwest Southeast Southwest District College FTSE 0 1,000 2,000 3,000 4,000 5,007 North Forest Voc-Tech Campus Stafford Campus Spring Branch Campus Health Science Ctr. Northeast Campus Eastside Campus Pinemont Center Missouri City Ctr South Campus Katy Campus Gulfton Ctr Central Campus Alief - Hayes Road Alief - Bissonnet Ctr. West Loop Felix Fraga ATTC/Northline Campus Students By Primary Campus The map below superimposes the relative FTSE per active campus data from the previous page onto the service area map to show where in the HCC service area the greatest student use of campuses occurs. The map is shown parallel to a map on the facing page color-coded by the number of HCC students residing in each zip code. The juxtaposition of these two maps allows a comparison of student residential concentration and heavy campus use. Not surprisingly, the Central campus is not located in a high student population area yet draws the largest student usage, suggesting that some campuses gather students from a large geographic area and usage relates to other factors besides location of student residence. Note: The size of the circle on the map above corresponds to the relative number of full-time student equivalents using that campus. This allows for a visual comparison of the relative student use rate in the correct geographic location. The bubbles are centered on the specific campus location, but should not be mistaken for suggesting size of geography covered and apparent overlap or proximity is incidental.
  • 31. Page Southerland Page, Inc. 31 Legend HCC Taxable Area HCC Service Area HCC Instructional Locations 1 2,500 All HCC Students Current HCC Students by Zip Code
  • 32. Houston Community College Strategic Real Estate Study32 Current HCC Students per Zip Code by Campus Northwest College Southwest College Drilling down to the next level of detail, the six maps at right show, for each administrative college grouping, where the students using the highlighted campuses reside. Generally a correlation emerges between where students are assigned by college and where they reside. Exceptions to this occur in the Coleman College, which draws evenly from the entire service area due to the specialized nature of coursework offered, and Central College. For visual consistency, the scale of each map is the same (the darkest green on one map relates to the darkest green on each other map). This consistent scale allows an accurate cross-map comparison, and shows that the highest student resident concentration of any college happens in the northwest. 1 1,400 Students Residing in Zip Code Active Campus in College Other HCC Active Campus
  • 33. Page Southerland Page, Inc. 33 Northeast College Southeast CollegeCentral College Coleman College
  • 34. Houston Community College Strategic Real Estate Study34 R² = 0.6847 R² = 0.6546 - 2,000 4,000 6,000 8,000 10,000 12,000 14,000 - 100,000 200,000 300,000 400,000 500,000 600,000 700,000 800,000 FTSE UDHC Linear (FTSE) Linear (UDHC) Spring Branch Campus Health Science Ctr. Northline Stafford West Loop Eastside Alief-Hayes Central Campus Northeast Campus Campus Building Area (Existing sf) NumberofStudentsAssignedtoCampus Katy Campus Campus Size Analysis One of the four driving questions of this study asked what is the optimum size of a single community college campus. There are numerous considerations which inform effective campus size that do not relate directly to real estate location and are outside the scope of this study, these can be summarized as level of property investment and current academic functionality. Analyzing the data which does comprise this study, there appears to be a correlation between campus size and student use of the campus. The graph above plots the number of students assigned to each campus (both FTSE in blue and UDHC in orange) vs. the gross building area recorded at the campus. For both types of student counts there is a positive correlation between number of students using the campus and facility scale. Further investigation is needed to understand why some locations appear to be outliers to this observation and to establish whether there is any causal link between scale and student preference.
  • 35. Page Southerland Page, Inc. 35 1,821 3,509 705 1,674 828 3,294 3,171 381 1,160 255 5,007 1,528 197 407 154 1,560 2,636 537 KatyCampus SpringBranchCampus Alief-Center Alief-Hayes GulftonCtr WestLoopCtr StaffordCampus MissouriCityCtr HealthScienceCtr. SouthCampus CentralCampus NortheastCampus AutoTechTrainingCtr. PinemontCenter NorthForestVoc-Tech NorthlineCampus EastsideCampus FelixFragaAcademic Student Breakdown by Campus Full-Time Equivalents and Unduplicated Headcount FTSE UDHC 1.678 2.641 1.171 0.573 2.332 1.222 1.400 0.847 0.773 0.654 0.720 0.563 0.273 0.792 0.369 1.354 0.963 0.780 KatyCampus SpringBranchCampus Alief-Center Alief-Hayes GulftonCtr WestLoopCtr StaffordCampus MissouriCityCtr HealthScienceCtr. SouthCampus CentralCampus NortheastCampus AutoTechTrainingCtr. PinemontCenter NorthForestVoc-Tech NorthlineCampus EastsideCampus FelixFragaAcademic Student Use BY Campus Building Area Full-Time Equivalents and Unduplicated Headcount FTSE/100sf UDHC/sf 1.35 3.99 3.07 1.73 7.70 4.27 9.63 1.95 7.47 0.06 4.25 0.33 0.42 7.91 0.08 2.19 3.86 1.15 KatyCampus SpringBranchCampus Alief-Center Alief-Hayes GulftonCtr WestLoopCtr StaffordCampus MissouriCityCtr HealthScienceCtr. SouthCampus CentralCampus NortheastCampus AutoTechTrainingCtr. PinemontCenter NorthForestVoc-Tech NorthlineCampus EastsideCampus FelixFragaAcademic Student Use by Campus Land Area Full-Time Equivalents and Unduplicated Headcount FTSE/1000sf UDHC/sf Students per 1,000 sf of Building Area Students per 1,000 sf of Property (Land) Area Another tool for evaluating whether campus land and/ or building size is related to student preference for that campus is to compare the students per unit area across the different campuses. In this way, the fact that larger campuses inherently have more classes to offer students can be set aside. The charts at right provide a visual comparison of the students per 1,000 square feet of building (middle chart) and per 1,000 square feet of land (bottom chart). If there was a preference for larger campuses in general, you would expect to see the largest physical campuses to have the highest intensity of use on a students per unit area basis. The top five campuses by building area are highlighted vertically across the charts, with the Central Campus as the largest by almost 50% in yellow, and the next four largest, which are similar in size to each other, highlighted in green. These properties do not reflect a significantly higher intensity of use via this graphic analysis, supporting the conclusion that more research is needed to determine how campus size correlates to student behavior. 4.25 CentralCampus 0.7205,007 mpus Headcount Buildin erty (L 1.2223,2944.27 WestLoopCtr Stu tudent 0.573111,67411.73 Alief-Hayes 0.5631,5280.33 NortheastCampus ggng Are Land) A 0.963 FTSE UDHC 2,636 FT U 3.86 EastsideCampus FTSE/10 UDHC/s HCC Student Campus Usage (2014-2015)
  • 36. Houston Community College Strategic Real Estate Study36 Legend HCC Taxable Area HCC Service Area Aldine ISD Klein ISD Cy-Fair ISD Pearland ISD Pasadena ISD Galena Park ISD Channelview ISD Katy ISD Spring Branch ISD Alief ISD Fort Bend ISD Houston ISD Stafford ISD Students attending HCC from out-of-district pay a higher tuition than in-district residents. Given the availability to many potential students of other, in-district, alternatives (see map of other system locations on School Districts Surrounding HCC Service Area page 54), HCC enrollment at a higher personal cost is interesting. Possible explanations include: attendance convenience closer to work than home, and/or a preference for HCC environments or course offerings over those of alternative higher education opportunities.
  • 37. Page Southerland Page, Inc. 37 Coleman Central All HCC HCC Taxable Area HCC Service Area 1 # of Students, Fall 2015 3,200 A substantial proportion of current HCC students hail from school districts that are outside of the taxable service area. The maps above show the relative proportion of students enrolled in the fall of 2015 who originated in non-HCC school districts.The heavier concentration of students to the west (map left) reflects the heavy use of HCC by students from Katy and Spring Branch ISD Out of District HCC Students All and by College NortheastNorthwest Southwest Southeast
  • 38. Houston Community College Strategic Real Estate Study38 “... The diversity of students and of the courses they take at community colleges poses a significant challenge for locating and configuring community colleges facilities..” Robert M. Stein, PhD Lena Gohlman Fox Professor of Political Science, Rice University Fellow in Urban Politics, Baker Institute for Public Policy
  • 39. Page Southerland Page, Inc. 39 Community College Students vs. National Population 4.0 Student characteristics and local demographics Users of the nation’s 992 community colleges are a diverse group. Nearly half (46%) of all U.S. undergraduates are enrolled at a community college. The average age of community college students is 28 with 14% over the age of 40. In addition to attending a community college, nearly all of these students hold full or part time employment. Nearly a quarter are full-time students employed full-time; the modal number of students are part-time students and full time workers. Most importantly, 61% of all attendance at a community college is part time. Community college students are largely commuters living at home, with only 25% living in on-campus housing. Half the students attending a community college are non-Anglo. Among all Hispanic undergraduates in the U.S. 57% are enrolled in a community college, 52% of African- American undergraduates attend a community college. The demographic profile of Houston Community College closely matches that of the other U.S. community colleges in the top 30 urban metropolitan areas, particularly throughout the south and south western states. How community college students use and access the college courses and programs has a significant influence on the location and configuration of community college facilities. For example, part-time students, working either full or part-time, have to navigate commuting to community college sites to attend classes. These commutes might originate from multiple locations, including residences, work and other places the student might visit during the week e.g., shopping malls. Community College Student Characteristics - National Trends Student ethnicity % White 50% Hispanic 21% Black 14% Asian 6% Native American 1% 2 or more races 3% Other/unknown 4% Nonresident alien 1% National Research Summary of Community College Students 50% 21% 14% 6% 1% 63% 17% 13% 4% 1% White Hispanic Black Asian Native American 4% 6% Community College Students By Age Age % < 21 37% 23-39 49% 40+ 14% Average Age 28 yrs Median Age 24 yrs Full-Time Students Part-Time Students Employed Full Time 22% 41% Employed Part Time 40% 32% By employment status (2011-2012) US Overall US CC Enrollment
  • 40. Houston Community College Strategic Real Estate Study40 Population by Zip 1,196 95,137 Legend HCC Taxable Area HCC Service Area HCC Active Instructional Houston Area Population Distribution The map on this page shows the population by zip code, offering a high level picture of how the total population is distributed across the HCC service area.
  • 41. Page Southerland Page, Inc. 41 2013 People/ Square Mile by Zip 63 13,798 Legend HCC Taxable Area HCC Service Area HCC Active Instructional Houston Area Population Density Because the land area of each zip code varies greatly, the total population in a zip code should be understood in light of the population density in addition to the total. The map on this page shows where the concentration of people is greatest across the HCC service area.
  • 42. Houston Community College Strategic Real Estate Study42 10.1% 17.6% 33.1% 16.2% 15.0% 5.5% 2.0% 0.4% 10.3% 15.8% 31.7% 17.0% 15.8% 6.2% 2.7% 0.7% All Locations 64% of students between 18 & 29 years 4.6% 12.1% 34.1% 20.0% 17.8% 6.9% 3.6% 0.8% 10.8% 12.0% 28.8% 19.2% 18.9% 7.0% 2.7% 0.6% HCC Students - by Age 6.7% 17.1% 33.6% 17.5% 15.9% 6.1% 2.5% 0.6% 3.1% 13.5% 24.7% 22.6% 21.9% 8.7% 4.6% 1.0% 6.7% 17.1% 33.6% 17.5% 15.9% 6.1% 2.5% 0.6% Northwest 67% of students 18 to 29 years Southwest 68% of students 18 to 29 years Central 66% of students 18 to 29 years Coleman 61% of students 18 to 29 years Northeast 60% of students 18 to 29 years Southeast 60% of students 18 to 29 years Legend HCC Student Age Less than 18 years 18-19 years 20-24 years 25-29 years 30-39 years 40-49 years 50-59 years 60 years & over
  • 43. Page Southerland Page, Inc. 43 Legend HCC Taxable Area HCC Service Area HCC Active Instructional Age Group Penetration 23.7% 77087 00.0% HCC Students - Saturation of Target Age Group Across Service Area More than 64% of HCC students are between the ages of 18 and 29 years old. Census data provides information about the breakdown of resident’s age by zip code. By taking the number of HCC students in a zip code and comparing that to the total number of residents in the target age group, we can approximate the penetration of HCC enrollment in a given zip code. By this means we can see that in 77087 almost a quarter of the residents between the ages of 15 and 29 are currently enrolled in HCC. The largest area in the HCC service area with low penetration of enrollment in this age group is the northwest, suggesting that additional enrollment from that population may be targeted.
  • 44. Houston Community College Strategic Real Estate Study44 HCC Students - by Ethnicity 14.8% 31.4% 35.8% 13.8% 4.2% 20.5% 27.1%32.3% 16.3% 3.8% 14.1% 32.1% 31.3% 19.4% 3.2% 13.9% 39.3%29.2% 13.7% 3.9% 14.3% 34.9% 32.1% 15.0% 3.7% 10.2% 38.8%41.1% 7.3% 2.6% 10.3% 33.7% 37.1% 11.9% 7.0% HCC Enrollment vs. Service Area Demographics 29% 39% 22% 9% 0%15% 36% 31% 14% 0% White Hispanic Black Asian Native American HCC Service Area HCC Enrollment 2015 Legend Ethnicity White Black/African American Hispanic/Latino Asian Other All Locations Northwest Southwest Central Coleman Northeast Southeast
  • 45. Page Southerland Page, Inc. 45 HCC Service Area Population Distribution by Ethnicity White Hispanic/Latino Black/African American Asian 0 100% Proportion of Population in Zip Code 0 100% Proportion of Population in Zip Code 0 100% Proportion of Population in Zip Code 0 100% Proportion of Population in Zip Code
  • 46. Houston Community College Strategic Real Estate Study46 Educational Attainment Across HCC Service Area - Proportion at Less than Associates’ Degree The map on this page shows the proportion of adults with less than an associate degree as their maximum educational attainment. The darker blue zip codes reflect areas with a greater proportion of the adult population that has yet to achieve that degree. Proportion of Adults with less than Associate’s Degree 100%0 HCC Taxable Area HCC Service Area
  • 47. Page Southerland Page, Inc. 47 Educational Attainment Across HCC Service Area - Number at Less than Associates’ Degree Number of Adults with less than Associate’s Degree 41,0001 HCC Taxable Area HCC Service Area The map on this page shows the absolute number of adults with less than an associate degree as their maximum educational attainment. The blue shaded zip codes reflect areas with a higher number of non-associates’ degree holding adult residents. Target zip codes are different than the map facing due to the difference in total population from one zip code to another.
  • 48. Houston Community College Strategic Real Estate Study48 Educational Attainment Across HCC Service Area - Proportion with No Degree That are College Ready The map on this page shows the proportion of adults with the generally required prerequisites (High School Diploma, GED, some college coursework) but less than an associate degree as their maximum educational attainment. The blue shaded zip codes reflect areas with a greater proportion of the population that might be ‘ready’ for community college coursework by this definition. Proportion of Adults ‘Ready’ for Community College 100%0 HCC Taxable Area HCC Service Area
  • 49. Page Southerland Page, Inc. 49 Educational Attainment Across HCC Service Area - Number with No Degree That are College Ready The map on this page shows the absolute number of adults with the generally required prerequisites (High School Diploma, GED, some college coursework) but less than an associate degree as their maximum educational attainment. The blue shaded zip codes reflect areas with a higher number of community college ready students. Target zip codes are different than the map facing due to the difference in total population from one zip code to another. Number of Adults ‘Ready’ for Community College 41,0001 HCC Taxable Area HCC Service Area
  • 50. Houston Community College Strategic Real Estate Study50 “Houston has one of the youngest, fastest growing, and diverse populations in the nation...[with] a sustained history of strong population growth.” Greater Houston Partnership 2015 Houston Economic Highlights, December 7, 2015
  • 51. Page Southerland Page, Inc. 51 Legend HCC Taxable Area HCC Service Area HCC Active Instructional Cumulative Annual Population Growth-2011-2013 Percent: 0-3.8% 5.0 Predictive indicators Recent Population Growth Purple and dark purple shaded zip codes in the map above indicate the zip codes with the greatest population growth between 2011 and 2013. Over that period, the greatest growth occurred at the extreme northeast of HCC’s service area and just west of the service area beyond Katy. Population growth is also evident just southeast of the Katy Mills site and on the east side of downtown. Combined with other measures of regional opportunity, growth areas suggest future opportunity. Houston is a relatively fluid MSA, and population growth centers change over time, this analysis should be updated regularly to reflect changes over time.
  • 52. Houston Community College Strategic Real Estate Study52 Kashmere Wheatley Worthing 0 1,000,000 2,000,000 3,000,000 4,000,000 4,627,881 Land Area Owned (sf) Legend HCC Taxable Area HCC Service Area Central Coleman Northeast Northwest Southeast Southwest District College HCC Active Instructional Target High School Attendance Zone: Schools with lowest 4-yr Graduation rates in district Target HS Zones School Location Target High School Zones 71% 70% 68% 0% 10% 20% 30% 40% 50% 60% 70% 80% 90% 100% 0% 10% 20% 30% 40% 50% 60% 70% 80% 90% 100% LastTwo-YearAverage Average All Years Data Available Student 4 Yr Graduation Rates by HISD High School One area of coursework provided at HCC is GED preparation. An analysis of High School 4-year graduation rates across HISD identifies three schools which appear to be consistently below the district average for four-year graduation rates. The attendance zones of these three schools may contain a higher than average proportion of residents who would benefit from and may seek community college coursework.
  • 53. Page Southerland Page, Inc. 53 0 1,000,000 2,000,000 3,000,000 4,000,000 4,627,881 Land Area Owned (sf) Legend HCC Taxable Area HCC Service Area Central Coleman Northeast Northwest Southeast Southwest District College HCC Active Instructional Major Employment Centers (rings represent ~10,000 employed) 1. Central Business District 2. Texas Medical Center 3. Westchase 4. Energy Corridor 5. Greenspoint 6. Greenway Plaza 7. Uptown 8. Port of Houston 9. Memorial City Employment Centers 1 2 3 4 5 67 8 9 Employment Centers Source: Houston Intelligent Transportation System Employment Corridors Map, maintained by City of Houston Traffic Operations Division The Houston area is unusual in the distribution of multiple employment centers around the city. Since a large proportion of community college students work part or full-time while they attend school, proximity to their places of employment can be of great benefit. The map here shows that 8 of the 9 major employment centers identified by COH lie within or immediately adjacent to HCC’s service area.
  • 54. Houston Community College Strategic Real Estate Study54 “Community college students are largely commuters living at home...[and]...students working...[who]...have to navigate commuting to community college sites to attend classes.” Robert M. Stein, PhD Lena Gohlman Fox Professor of Political Science, Rice University Fellow in Urban Politics, Baker Institute for Public Policy
  • 55. Page Southerland Page, Inc. 55 HCC Taxable Area HCC Service Area 15 Minute Drive Radius (at 40 mph avg speed) Current Active - Not Changing Current Active - Expanding Legend North Forest Voc-Tech Stafford Campus Spring Branch Campus Health Science Ctr. Northeast Campus Eastside Campus Pinemont Center South Campus Katy Campus Gulfton Ctr Central Campus JP McGovern Alief - Hayes Road Alief - Bissonnet Ctr. West Loop Felix Fraga ATTC/Northline Campus 6.0 Distribution, Area Coverage, and Competition HCC Existing Locations Drive Time Radius Overlap The HCC service area covers a broad and dispersed metropolitan area. The distance between campuses ‘as the crow flies’ does not adequately indicate the real difficulty in reaching each location. The map on this page shows the calculated fifteen minute drive radius from each active HCC campus assuming an average speed of 40mph. This analysis shows substantial overlap between campuses at the center of HCC’s service area, with the far western and south eastern portions of the service area served by one or fewer campus locations. At the far south east and northwest corners of the service area, no campus is within a fifteen minute drive radius.
  • 56. Houston Community College Strategic Real Estate Study56 Acres Homes Brays Oaks TX Parkway HCC Taxable Area HCC Service Area 15 Minute Drive Radius (at 40 mph avg speed) Legend Under Development Radius (Location) North Forest Voc-Tech Stafford Campus Spring Branch Campus Health Science Ctr. Northeast Campus Eastside Campus Pinemont Center South Campus Katy Campus Gulfton Ctr Central Campus JP McGovern Alief - Hayes Road Alief - Bissonnet Ctr. West Loop Felix Fraga ATTC/Northline Campus HCC Properties Under Development Drive Time Radius There are three new sites under development currently. Their calculated fifteen minute drive radii are shown above. This analysis shows a fair bit of overlap between the Brays Oaks and Texas Parkway sites’ reach. Internal information indicates that each of these sites is programmed to meet different needs than those the Stafford Campus currently satisfies. While there is robust population growth across Fort Bend County, the maps on pages 46 through 48 indicate that the current demand for HCC services is strongest at the Harris County Boundary.
  • 57. Page Southerland Page, Inc. 57 Sale Pending Property Under Review 15 Minute Drive Radius HCC Taxable Area HCC Service Area Legend Westheimer E Little York Katy Mills Midtown Purchase 288/MacGregor North Forest Voc-Tech Campus Stafford Campus Spring Branch Campus Health Science Ctr. Northeast Campus Eastside Campus Pinemont Center Missouri City Ctr South Campus Katy Campus Gulfton Ctr Central Campus JP McGovern Alief - Hayes Road Alief - Bissonnet Ctr. Acres Homes Brays Oaks TX Parkway West Loop Felix Fraga ATTC/Northline Campus HCC Properties Under Review Drive Time Radius There are five property locations under review, with their calculated fifteen minute drive radii shown above. A key consideration in whether to develop a separate campus at these locations is how the potential population of students might overlap with existing campuses.
  • 58. Houston Community College Strategic Real Estate Study58 All Community Colleges Serving MSA Clear Horizons Early College High School University Center at University Park Sheldon Early College High School g Galena Park HS La Porte College C North Harris Campus Aerospace Academy Greenspoint Center Sugarland Campus Richmond Campus Atascocita Center Fairbanks Center Central Campus Cypress Center CyFair Campus North Campus Victory Center Pasadena Early College HS Clear Lake HS Small Business Dev. Ctr. Maritime and Tech TC North Forest Voc-Tech Campus Stafford Campus Spring Branch Campus Health Science Ctr. Northeast Campus Eastside Campus Pinemont Center Missouri City Ctr South Campus Katy Campus Gulfton Ctr Central Campus JP McGovern Alief - Hayes Road Alief - Bissonnet Ctr. Acres Homes Brays Oaks TX Parkway West Loop Felix Fraga ATTC/Northline Campus Legend HCC Taxable Area HCC Service Area HCC Lone Star San Jacinto Wharton County JC Blinn (closest at Sealy) The map above shows the locations run by the community college systems which surround HCC’s service area. While some college system campuses are well outside of and remote from HCC, both Lone Star to the northwest and San Jacinto to the southeast operate campuses that fall near the borders of HCC’s service area.
  • 59. Page Southerland Page, Inc. 59 Active Campus 15 Minute Drive Radius Clear Horizons Early College High School University Center at University Park Sheldon Early College High School Health Professionals Building Galena Park HS La Porte Colle North Harris Campus Aerospace Academy Greenspoint Center Sugarland Campus Richmond Campus Atascocita Center Fairbanks Center Central Campus Cypress Center CyFair Campus North Campus Victory Center Pasadena Early College HS Clear Lake HS Small Business Dev. Ctr. Maritime and Tech TC HCC Taxable Area HCC Service Area 15 Minute Drive Radius (at 40 mph avg speed) Current Active - Not Changing Current Active - Expanding Legend North Forest Voc-Tech Campus Stafford Campus Spring Branch Campus Health Science Ctr. Northeast Campus Eastside Campus Pinemont Center Missouri City Ctr South Campus Katy Campus Gulfton Ctr Central Campus JP McGovern Alief - Hayes Road Alief - Bissonnet Ctr. Acres Homes Brays Oaks TX Parkway West Loop Felix Fraga ATTC/Northline Campus Surrounding System Campuses and HCC Drive Times The map above superimposes the all-system map at left onto the drive-time radius map for HCC active campuses. By this understanding of possible population draw area, there are several non-HCC campuses which fall within a convenient drive time of HCC locations. Given the rising cost of operating academic campuses, Professor Stein notes in his literature review that many community college systems are experimenting with partnerships to distribute the cost of physical locations among institutions. In the interest of more efficiently serving the target student population, it may be worth considering partnership opportunities along the perimeter of HCC’s service area with the Lone Star and San Jacinto College Systems. If HCC negotiated to offer some classes at the Cypress Center location, the existing Katy Campus might be effectively relocated to the west, improving geographic coverage of the service area and reducing overlap with Spring Branch. Similarly, if HCC partnered with San Jacinto to locate a campus at the southeast corner, both systems may benefit.
  • 60. Houston Community College Strategic Real Estate Study60 “...[A] remedy (for the tendency of single member district representation to distort the policy choices of community colleges) comes in the form of transparency of information...” Robert M. Stein, PhD Lena Gohlman Fox Professor of Political Science, Rice University Fellow in Urban Politics, Baker Institute for Public Policy
  • 61. Page Southerland Page, Inc. 61 7.0 Analysis and conclusions As discussed throughout the previous chapters of this report, there are numerous objective considerations that best practice research suggests a community college employ when considering real estate location strategies. In order to inform decisions regarding the existing properties under review and future property acquisition opportunities, all of the different measures presented in the document have been aggregated into a single map which codes the zip codes (the most granular level of most of the available data) by relative priority for campus location. Each of the following measures was given equal weighting on a scale of 1-5: • Proportion of population at target age (15-29 years) • Above average representation of ethnicities with higher community college attendance levels • Population density (people per square mile) • Educational attainment (less than an Associate’s degree + ‘readiness’ for college coursework) • Level of population growth (CAGR 2011-2013) • Location within target high school zone (lowest 4 yr graduation rates in HISD) • Proximity to employment centers (prioritized by number of people employed) A score between 1 and 5 for each measure adds up to an overall zip-code by zip-code opportunity score. The map on the following page illustrates the relative opportunity for each zip code area on the HCC service area map. The relative priority for each zip code shows how a new community college system, if planned today, might allocate campus resources. The reality is that HCC has a substantial existing network. Consideration of the opportunity map requires an evaluation of how the existing network aligns with the identified opportunity locations. The second map on the following spread (page 63) overlays the drive time radius analyses from the existing campuses to illustrate how the existing network relates to the priority zip codes identified. To the system’s credit, the current network of campuses appears to successfully serve all of the priority zip codes identified. Following that overall system analysis, each of the properties under review is reviewed against the opportunity and existing overlap map to support a recommendation for that location. Approach Summary
  • 62. Houston Community College Strategic Real Estate Study62 Central Coleman Northeast Northwest Southeast Southwest District Legend HCC Taxable Area HCC Service Area College Relative Priority Highest Lowest HCC Service Area North Forest Voc-Tech Campus Stafford Campus Spring Branch Campus Health Science Ctr. Northeast Campus Eastside Campus Pinemont Center Missouri City Ctr South Campus Katy Campus Gulfton Ctr Central Campus JP McGovern Alief - Hayes Road Alief - Bissonnet Ctr. Acres Homes Brays Oaks TX Parkway West Loop Felix Fraga ATTC/Northline Campus Opportunity Prioritization Summary by Zip Code By the aggregate of opportunity indicators evaluated geographically for this study, the zip codes representing the greatest location opportunities are shown in pink on this map. By contrast, the blue shaded zip codes reflect areas of relatively less opportunity. Note that this map does not take into account how well the existing network of HCC campuses covers the opportunity areas, it is purely mapping the demographic and economic factors discussed previously.
  • 63. Page Southerland Page, Inc. 63 Opportunity Map vs. Existing HCC Coverage HCC Taxable Area HCC Service Area 15 Minute Drive Radius (at 40 mph avg speed) Current Active - Not Changing Current Active - Expanding Legend North Forest Voc-Tech Campus Stafford Campus Spring Branch Campus Health Science Ctr. Northeast Campus Eastside Campus Pinemont Center Missouri City Ctr South Campus Katy Campus Gulfton Ctr Central Campus JP McGovern Alief - Hayes Road Alief - Bissonnet Ctr. Acres Homes Brays Oaks TX Parkway West Loop Felix Fraga ATTC/Northline Campus Layering the existing campus drive time radius maps onto the opportunity prioritization by zip code map shows that all of the highest priority zip codes are served by multiple established campuses. The highest priority zip code with minimal coverage is at the far west of the service area just to the north and northeast of the Katy campus location. Campus consolidation opportunities appear to be available in the lower priority locations which are currently served by multiple campuses. The Gulfton and West Loop campuses are very close to each other and consolidation to a single location would not appear to change student access. Similarly, the leased Pinemont Center location overlaps very heavily with the ATTC/Northline campus, suggesting an opportunity to evaluate a shift to the west when the lease comes up for renewal, improving coverage of the priority zip code to the north.
  • 64. Houston Community College Strategic Real Estate Study64 Westheimer Central Coleman Northeast Northwest Southeast Southwest District Legend HCC Taxable Area HCC Service Area College Relative Priority Highest Lowest HCC Service Area North Forest Voc-Tech Campus Stafford Campus Spring Branch Campus Health Science Ctr. Northeast Campus Eastside Campus Pinemont Center Missouri City Ctr South Campus Katy Campus Gulfton Ctr Central Campus JP McGovern Alief - Hayes Road Alief - Bissonnet Ctr. Acres Homes Brays Oaks TX Parkway West Loop Felix Fraga ATTC/Northline Campus The 15-minute drive radius from the Westheimer property covers numerous high priority zip codes, suggesting that a campus in that location would draw from a solid population of potential students. Westheimer Location Opportunity Intersection
  • 65. Page Southerland Page, Inc. 65 Westheimer HCC Taxable Area HCC Service Area 15 Minute Drive Radius (at 40 mph avg speed) Current Active - Not Changing Current Active - Expanding Legend North Forest Voc-Tech Campus Stafford Campus Spring Branch Campus Health Science Ctr. Northeast Campus Eastside Campus Pinemont Center Missouri City Ctr South Campus Katy Campus Gulfton Ctr Central Campus JP McGovern Alief - Hayes Road Alief - Bissonnet Ctr. Acres Homes Brays Oaks TX Parkway West Loop Felix Fraga ATTC/Northline Campus Overlap Analysis When viewed in context with the existing and planned campus location reaches, the Westheimer property access radius overlaps the existing network substantially suggesting that the property does not represent a strategic new campus opportunity at this time. This map superimposes the ‘under review’ property’s fifteen minute radius against the existing and planned campuses’ reach.
  • 66. Houston Community College Strategic Real Estate Study66 Katy Mills Central Coleman Northeast Northwest Southeast Southwest District Legend HCC Taxable Area HCC Service Area College Relative Priority Highest Lowest HCC Service Area North Forest Voc-Tech Campus Stafford Campus Spring Branch Campus Health Science Ctr. Northeast Campus Eastside Campus Pinemont Center Missouri City Ctr South Campus Katy Campus Gulfton Ctr Central Campus JP McGovern Alief - Hayes Road Alief - Bissonnet Ctr. Acres Homes Brays Oaks TX Parkway West Loop Felix Fraga ATTC/Northline Campus The 15-minute drive radius from the Katy Mills property primarily covers zip codes that represent the lowest opportunity for community college students (coded blue). The higher opportunity zip codes and unserved northwest corner would be better served by a campus shifted north and somewhat east, perhaps splitting the space between the current location and the Katy Campus site. Katy Mills Location Opportunity Intersection
  • 67. Page Southerland Page, Inc. 67 Katy Mills HCC Taxable Area HCC Service Area 15 Minute Drive Radius (at 40 mph avg speed) Current Active - Not Changing Current Active - Expanding Legend North Forest Voc-Tech Campus Stafford Campus Spring Branch Campus Health Science Ctr. Northeast Campus Eastside Campus Pinemont Center Missouri City Ctr South Campus Katy Campus Gulfton Ctr Central Campus JP McGovern Alief - Hayes Road Alief - Bissonnet Ctr. Acres Homes Brays Oaks TX Parkway West Loop Felix Fraga ATTC/Northline Campus The 15-minute drive radius from the Katy Mills property only intersects with the Katy Campus and covers portions of the service area not currently served in a 15-minute radius. This opportunity to reach potential students not well-served by the existing campus network may prove to be strategic in the future if the demographic potential at this location improves through population growth or other change. As mentioned on the facing page, the overlap analysis above suggests that a location combining the Katy Mills and Katy Campus drive radius (located between the two existing sites) would better serve the population by increasing in area coverage and reducing overlap with the Spring Branch Campus. Overlap Analysis
  • 68. Houston Community College Strategic Real Estate Study68 E Little York Location Opportunity Intersection E Little York Central Coleman Northeast Northwest Southeast Southwest District Legend HCC Taxable Area HCC Service Area College Relative Priority Highest Lowest HCC Service Area North Forest Voc-Tech Campus Stafford Campus Spring Branch Campus Health Science Ctr. Northeast Campus Eastside Campus Pinemont Center Missouri City Ctr South Campus Katy Campus Gulfton Ctr Central Campus JP McGovern Alief - Hayes Road Alief - Bissonnet Ctr. Acres Homes Brays Oaks TX Parkway West Loop Felix Fraga ATTC/Northline Campus The 15-minute drive radius from the E. Little York property covers several high opportunity zip codes (coded pink and orange). In isolation, this property appears to be a strategic location for a community college campus.
  • 69. Page Southerland Page, Inc. 69 E Little York HCC Taxable Area HCC Service Area 15 Minute Drive Radius (at 40 mph avg speed) Current Active - Not Changing Current Active - Expanding Legend North Forest Voc-Tech Campus Stafford Campus Spring Branch Campus Health Science Ctr. Northeast Campus Eastside Campus Pinemont Center Missouri City Ctr South Campus Katy Campus Gulfton Ctr Central Campus JP McGovern Alief - Hayes Road Alief - Bissonnet Ctr. Acres Homes Brays Oaks TX Parkway West Loop Felix Fraga ATTC/Northline Campus The 15-minute drive radius from the E. Little York property heavily intersects several existing HCC campuses. A campus investment at this location would likely pull students away from existing facilities vs. reaching new students and the system may be better served by divesting this property. Overlap Analysis
  • 70. Houston Community College Strategic Real Estate Study70 288/MacGregor Location Opportunity Intersection 288/MacGregor Central Coleman Northeast Northwest Southeast Southwest District Legend HCC Taxable Area HCC Service Area College Relative Priority Highest Lowest HCC Service Area North Forest Voc-Tech Campus Stafford Campus Spring Branch Campus Health Science Ctr. Northeast Campus Eastside Campus Pinemont Center Missouri City Ctr South Campus Katy Campus Gulfton Ctr Central Campus JP McGovern Alief - Hayes Road Alief - Bissonnet Ctr. Acres Homes Brays Oaks TX Parkway West Loop Felix Fraga ATTC/Northline Campus The 15-minute drive radius from the 288/MacGregor property covers several high opportunity zip codes (coded pink and orange). In isolation, this property appears to be a strategic location for a community college campus.
  • 71. Page Southerland Page, Inc. 71 288/MacGregor Active Campus 15 Minute Drive Radius HCC Taxable Area HCC Service Area 15 Minute Drive Radius (at 40 mph avg speed) Current Active - Not Changing Current Active - Expanding Legend North Forest Voc-Tech Campus Stafford Campus Spring Branch Campus Health Science Ctr. Northeast Campus Eastside Campus Pinemont Center Missouri City Ctr South Campus Katy Campus Gulfton Ctr Central Campus JP McGovern Alief - Hayes Road Alief - Bissonnet Ctr. Acres Homes Brays Oaks TX Parkway West Loop Felix Fraga ATTC/Northline Campus The 15-minute drive radius from the 288/MacGregor property heavily intersects several existing HCC campuses, including the most heavily used, Central. A campus investment at this location would be convenient to students already served by multiple existing facilities and would not appear to serve any new students. Given the high value of property in this location, the system may be better served by divesting this property. Overlap Analysis
  • 72. Houston Community College Strategic Real Estate Study72 Midtown Purchase Central Coleman Northeast Northwest Southeast Southwest District Legend HCC Taxable Area HCC Service Area College Relative Priority Highest Lowest HCC Service Area North Forest Voc-Tech Campus Stafford Campus Spring Branch Campus Health Science Ctr. Northeast Campus Eastside Campus Pinemont Center Missouri City Ctr South Campus Katy Campus Gulfton Ctr Central Campus JP McGovern Alief - Hayes Road Alief - Bissonnet Ctr. Acres Homes Brays Oaks TX Parkway West Loop Felix Fraga ATTC/Northline Campus The 15-minute drive radius from the Midtown Purchase covers all of the highest opportunity zip codes (coded pink). This property appears to be a strategic location for a community college campus. Midtown Purchase Location Opportunity Intersection
  • 73. Page Southerland Page, Inc. 73 Midtown Purchase HCC Taxable Area HCC Service Area 15 Minute Drive Radius (at 40 mph avg speed) Current Active - Not Changing Current Active - Expanding Legend North Forest Voc-Tech Campus Stafford Campus Spring Branch Campus Health Science Ctr. Northeast Campus Eastside Campus Pinemont Center Missouri City Ctr South Campus Katy Campus Gulfton Ctr Central Campus JP McGovern Alief - Hayes Road Alief - Bissonnet Ctr. Acres Homes Brays Oaks TX Parkway West Loop Felix Fraga ATTC/Northline Campus The 15-minute drive radius from the Midtown Purchase property heavily intersects several existing HCC campuses. The property is not contiguous with, but lies within easy walking distance of the Central Campus. Given the high cost of structured parking and limited availability of parking space at that location,the site may effectively serve as excess parking capacity in the short term until further investment at this location will support expansion needs of the nearby Central Campus. Overlap Analysis
  • 74. Houston Community College Strategic Real Estate Study74 HCC Property Delano Warehouse 9424 Fannin Warehouse Central Coleman Northeast Northwest Southeast Southwest District Legend HCC Taxable Area HCC Service Area College Warehouse Property System Admin Bldg. Active/Planned Campus Delano Warehouse Location Opportunity Analysis The Delano Warehouse property is also under review in this analysis. The current facility is not in use at this time because it does not hold a certificate of occupancy from the City of Houston. In order to obtain a certificate of occupancy, significant asbesto abatement is required and would pose a substantial capital cost. The property was acquired with the intention of usage as warehouse space for the entire system. Since that acquisition, the warehouse at 9424 Fannin has been put into operation. This larger facility is both without occupancy complexities and significantly larger than the Delano property. Given that the new warehouse location is effectively serving system needs with room for expansion if needed, it is recommended that the Delano Warehouse not be planned for future warehouse capacity.
  • 75. Page Southerland Page, Inc. 75 Delano Warehouse 9424 Fannin Warehouse HCC Taxable Area HCC Service Area 15 Minute Drive Radius (at 40 mph avg speed) Current Active - Not Changing Current Active - Expanding Legend Overlap Analysis The Delano Warehouse location is close to the Central and Felix Fraga campuses. Holdiing the land for future campus development does not appear to make sense - any campus at that location would overlap heavily with existing campus investments. The Delano Warehouse site should be divested to free up funds for application to more effective system use.
  • 76. Houston Community College Strategic Real Estate Study76
  • 77. Page Southerland Page, Inc. 77 8.0 Appendix Full Text : Locating Community College Facilities by Robert M. Stein, PhD A review of scholarly and professor literature on the best practices for locating community college facilities does not net a set of unambiguous metrics for making decisions on where to locate community college facilities. Beyond building facilities near to where community college students live, work and travel and anticipating how programmatic content effects location, there is little more to be gleaned from published literature on community college facilities. There is a clear consensus in the literature that the location of community college facilities requires understanding the relationship between the instructional programs at the community college and the composition of its students and users. This relationship defines not only where the college might locate its facilities, it also identifies how college infrastructure/facilities should be configured and equipped. It is also important to appreciate that land and space are both scarce and increasingly expensive. This constraint on locating community college facilities has been met with collaborations and partnership between community colleges and private (e.g., businesses that provide on work site classrooms for their workers) and public institutions (e.g., libraries, independent school districts). The diversity of students and of the courses they take at community colleges poses a significant challenge for locating and configuring community colleges facilities (see Related Note, following for more detail). A trend in community college facilities, concurrent-use campuses, may hold promise for the future. A concurrent-use campus (Taber 1995; Windham et al 2001) is a community college campus that is shared with: • Independent school districts • General purpose governments • Private for-profit businesses • Non-profits • Four year colleges and universities “Due to increased demand for facilities space and library resources, community colleges are finding it beneficial to share the cost of information storage and dissemination with other organizations such as public library systems or even other community colleges (Windham et al 2001:3).” “Consortia of community colleges and universities appear to be one of the best vehicles that community colleges can use to meet the challenges placed before them and to establish and maintain their proper place in the educational community” (May & Smith, 1992, p. 63; Jadallah, 1994).
  • 78. Houston Community College Strategic Real Estate Study78 Examples of concurrent campuses A multi-university facility has been established at North Harris Montgomery Community College. This facility enables 6 public universities to work together to offer 21 unduplicated bachelor’s and 24 master’s degree programs. These programs, although offered by six different four-year institutions, share a single admissions process and financial aid application process. It is reported that coursework is easily transferred among institutions. Technology is an integral part of this partnership, and the facility has an extensive technology infrastructure, as 40% of the University Center’s instruction is delivered via interactive distance learning. In 1997, the Oklahoma State Regents approved a consortium of four community colleges to exchange low enrollment and specialized courses via electronic media. The Regents also endorsed a proposal for a consortium of five institutions to provide cooperative instructional services including electronic delivery of courses and programs. The status report also called for the improvement of quality and efficiency in the system, with collaboration, coordination, and mergers of functions across campuses. The logic of shared facilities suggests (Taber 1995) • Collaborative arrangements with other organizations to develop needed facilities offer some advantages that planners should consider. • Sharing a facility usually costs less than funding and maintaining separate facilities; and shared facilities can provide access to a valuable location that is otherwise unavailable. • They also can provide access to special physical resource needs such as adequate parking or expensive recreational facilities or libraries. • Shared facilities other than classrooms, such as cafeterias or bookstores, can ensure adequate customer markets. • Shared facilities can offer multiple services to students or clients who would otherwise find the need to visit two or more different facilities. • Each partner can use the shared facility at a different “prime time,” which means more efficient use of a resource Bibliography Jadallah, E. 1994. “The community education center: A model for school-university partnerships” American Secondary Education, 22 (4), 23–27. May, G., & Smith, A. 1992. “Gaining stature through community college-university consortia.” In B.W. Dziech and W.R. Viler (Eds.), Prisoners of Elitism: The Community College’s Struggle for Stature (pp. 63–76). New Directions for Community Colleges, No. 78. National Center for Education Statistics (NCES) .2014. 2011-12 National Postsecondary Student Aid Study (NPSAS:12) [AACC analysis] http://nces.ed.gov/datalab/ National Center for Education Statistics (NCES) .2014. IPEDS Fall 2013 Enrollment Survey. https://nces.ed.gov/ pubsearch/pubsinfo.asp?pubid=2015012 Taber, L.S. (1995). ERIC Review: Collaboration as a vehicle for community college facilities development. Community College Review, 23 (3), 73–87. Windham, Patricia, George Perkins, Jon Rogers. 2001. “Concurrent-Use Campuses: Part of the New Definition of Access,” Community College Review 29:3.
  • 79. Page Southerland Page, Inc. 79 Users of community colleges Users of the nation’s 992 community colleges are a diverse group. Nearly half (46%) of all U.S. undergraduates are enrolled at a community college. The average age of community college students is 28 with 14% over the age of 40. In addition to attending a community college, nearly all of these students hold full or part time employment. Nearly a quarter is full-time students employed full- time; the modal number of students are part-time students and full time workers. Most importantly, 61% of all attendance at a community college is part time. Community college students are largely commuters living at home, with only 25% living in on- campus housing. Half the students attending a community college are non-Anglo. Among all Hispanic undergraduates in the U.S. 57% are enrolled in a community college, 52% of African-Americans undergraduates attend a community college. The demographic profile of Houston Community College closely matches that of the other U.S. community colleges in the top 30 urban metropolitan areas, particularly throughout the south and south western states. How community college students use and access the college courses and programs has a significant influence on the location and configuration of community college facilities. For example, part-time students working, either full or part-time have to navigate commuting to community college sites to attend classes. These commutes might originate from multiple locations, including residences, work and other places the student might visit during the week e.g., shopping malls. Offerings of community colleges Community colleges offer a wide range of courses and degree programs. These offerings include courses of study for a two year Associates degree leading to the enrollment in a Bachelor’s degree program at a four year college or university. A significant portion of community college students are enrolled in courses for specific work place certification (e.g., emergency medical technician, cosmetologist). Moreover, many certificate courses of instruction can and do take place at the workplace. This allows workers to train on equipment for which they are seeking proficiency and certification. More importantly it reduces the capital demand on community colleges to purchase and house expensive equipment. Classes conducted at the students’ workplace reduces commute time for the student/worker and lessens likelihood the student will miss a class. 1.NCES (2014) 2011-12 National Postsecondary Student Aid Study (NPSAS:12) [AACC analysis] 2.NCES. (2014). 2011-12 National Postsecondary Student Aid Study (NPSAS: 12) [AACC analysis]. 3.NCES (2014). IPEDS Fall 2013 Enrollment Survey [AACC analysis]. Related Note: An overview of community college users and programs-Nationally Community College Students by Age Community College Students by Employment Status Community College Students by Ethnicity Age % < 21 37% 23-39 49% 40+ 14% Average Age 28 yrs Median Age 24 yrs Full-Time Students Part-Time Students Employed Full Time 22% 41% Employed Part Time 40% 32% y p y ( ) Student ethnicity % White 50% Hispanic 21% Black 14% Asian 6% Native American 1% 2 or more races 3% Other/unknown 4% Nonresident alien 1%
  • 80. Houston Community College Strategic Real Estate Study80 Excerpt from Memo: Discussion Regarding Possible Classification of Instructional Sites Upon completion of the CIP, the System will have at least 28 distinct operating locations, as well as other property holdings. These locations are currently designated as “Building”, “Campus”, “Center”, “College”, and Facility; without regard to size, population or function. Going forward, a common rubric may be useful, especially as facilities become less specifically identified with geographic colleges and more as portals to articulation pathways and the Centers of Excellence. The following taxonomy has been suggested by staff: Site – An off-campus property that is not currently used to provide mission related services. Station – An off-campus location that promotes access to College services in a location or to a population not otherwise served by the College. Stations typically serve a population of 500 or fewer full-time student equivalents. They offer a very limited array of courses and/or programs and do not entail a permanent commitment for continued service. Should demand decrease or fail to materialize, courses and programs can be discontinued and resources moved to areas of greater demand. Stations normally provide only program related administrative functions. Branch – A facility or group of facilities serving a population of fewer than 3,000, but more than 500 Full Time Student Equivalents. A campus branch is a major secondary location, with limited administrative and logistical support services and which is normally reliant upon a parent campus for the provision of a full range of services. Branches offer a broad array of entry level courses and courses not requiring specialized facilities or laboratories. Where specialized programs of study are represented, they will either address a specific local need or have sufficient throughput to provide for a high utilization of laboratory facilities. Branches typically exist to reduce entry barriers and operate as feeders to a parent campus or Center of Excellence program. Campus – A facility or group of facilities serving a population of 3,000 or more Full Time Student Equivalents. A campus provides complete administrative and logistical support services and is typically (but not always) comprised of more than one building. A campus may often occupy a significant number of lots, tracts, or parcels of land. A campus is designed to function as a unified whole, providing both a sense of place and the accoutrements normally expected of a higher education environment. A campus typically offers a full spectrum of courses, programs, and administrative and support services.
  • 81. Page Southerland Page, Inc. 81 Summary Property List Name/Label Final Aggregate Property Group/Other Name Total Land Area (sf) College/ Admin Unit LatitudeAVGLongitudeAV Existing Building Area (sf) Expanded Building Area (sf) FTSE UDHC Status System Admin Building District 163,085 District 29.74196 -95.37682 558,450 558,450 Existing Warehouse-9424 Fannin Warehouse-9424 Fannin 593,726 District 29.66738 -95.40483 124,245 124,245 Existing Warehouse-Delano Warehouse-Delano 31,260 District 29.74666 -95.35062 40,000 40,000 Under Review South Campus South Campus 4,527,626 Central 29.64286 -95.38957 39,000 103,959 255 996 Expanding Central Campus Central Campus 1,176,885 Central 29.73702 -95.37728 701,150 731,348 5,007 11,109 Expanding 288/MacGregor 288/MacGregor 396,706 Central 29.71609 -95.37741 Under Review Midtown Purchase Midtown Purchase 178,605 Central 29.73500 -95.37348 Under Review Health Science Ctr. Health Science Ctr. 155,302 Coleman 29.70349 -95.40514 140,000 378,242 1,160 2,657 Expanding John P. McGovern John P. McGovern Campus 10,800 Coleman 29.70551 -95.38430 10,800 10,800 Leased/Under Review Northeast Campus Northeast Campus 4,521,631 Northeast 29.78096 -95.25647 271,370 271,370 1,528 3,171 Existing Auto Tech Training Ctr. Auto Tech Training Ctr. 203,866 Northeast 29.83234 -95.38448 72,059 72,059 197 325 Existing Pinemont Center Pinemont Center 51,435 Northeast 29.84094 -95.42568 51,368 51,368 407 1,393 Leased/Existing North Forest Voc-Tech North Forest Voc-Tech Campus 1,919,002 Northeast 29.86981 -95.29952 41,753 107,653 154 507 Expanding Northline Campus Northline Campus 976,266 Northeast 29.83344 -95.37645 115,225 166,731 1,560 3,483 Expanding Acres Homes Houston Trade Fair Property 492,637 Northeast 29.86979 -95.41074 - 25,120 - - Under Development Donation-E Little York Donation-E Little York 214,350 Northeast 29.87151 -95.27295 Under Review Katy Campus Katy Campus 1,347,931 Northwest 29.79043 -95.71437 108,503 108,503 1,821 4,152 Existing Spring Branch Campus Spring Branch Campus 878,694 Northwest 29.78737 -95.56147 132,856 132,856 3,509 8,314 Existing Alief - Bissonnet Center Alief - Center 229,613 Northwest 29.68073 -95.62514 60,220 60,220 705 757 Existing Alief - Hayes Road Alief - Hayes 965,367 Northwest 29.73615 -95.57614 292,000 411,048 1,674 4,591 Expanding Westheimer West Oaks 1,019,412 Northwest 29.73740 -95.63004 - - - Under Review Katy Mills Katy Mills 81,418 Northwest 29.77259 -95.81338 11,003 11,003 Under Review Eastside Campus Eastside Campus 683,107 Southeast 29.70442 -95.29644 288,559 333,007 2,636 5,680 Expanding Felix Fraga Academic Felix Fraga Academic Campus 466,014 Southeast 29.74992 -95.33444 68,805 105,237 537 1,389 Expanding Gulfton Ctr Gulfton Ctr 107,519 Southwest 29.71563 -95.47509 35,500 35,500 828 1,047 Existing West Loop Ctr West Loop Ctr 771,032 Southwest 29.72160 -95.45846 269,451 294,451 3,294 7,936 Expanding Stafford Campus Stafford Campus 329,403 Southwest 29.62788 -95.55954 239,472 277,717 3,171 7,868 Expanding Sienna Plantation Center Missouri City Ctr 195,253 Southwest 29.53331 -95.53789 45,000 45,000 381 1,218 Sale Pending Brays Oaks Brays Oaks 558,421 Southwest 29.65550 -95.52803 - 27,189 - - Under Development Texas Parkway Center TX Parkway 1,826,435 Southwest 29.60270 -95.52884 - 67,825 Under Development Total 25,072,801 3,716,789 4,550,901