
Recommended
Recommended
More Related Content
What's hot
What's hot (19)
Similar to H Yaghoubi - ACS 2014
Similar to H Yaghoubi - ACS 2014 (20)
H Yaghoubi - ACS 2014
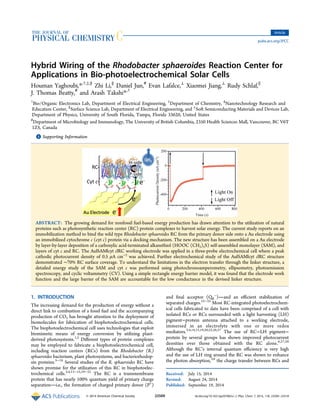
- 1. Hybrid Wiring of the Rhodobacter sphaeroides Reaction Center for Applications in Bio-photoelectrochemical Solar Cells Houman Yaghoubi,*,†,‡,§ Zhi Li,∥ Daniel Jun,# Evan Lafalce,⊥ Xiaomei Jiang,⊥ Rudy Schlaf,∥ J. Thomas Beatty,# and Arash Takshi*,† † Bio/Organic Electronics Lab, Department of Electrical Engineering, ‡ Department of Chemistry, § Nanotechnology Research and Education Center, ∥ Surface Science Lab, Department of Electrical Engineering, and ⊥ Soft Semiconducting Materials and Devices Lab, Department of Physics, University of South Florida, Tampa, Florida 33620, United States # Department of Microbiology and Immunology, The University of British Columbia, 2350 Health Sciences Mall, Vancouver, BC V6T 1Z3, Canada *S Supporting Information ABSTRACT: The growing demand for nonfossil fuel-based energy production has drawn attention to the utilization of natural proteins such as photosynthetic reaction center (RC) protein complexes to harvest solar energy. The current study reports on an immobilization method to bind the wild type Rhodobacter sphaeroides RC from the primary donor side onto a Au electrode using an immobilized cytochrome c (cyt c) protein via a docking mechanism. The new structure has been assembled on a Au electrode by layer-by-layer deposition of a carboxylic acid-terminated alkanethiol (HOOC (CH2)5S) self-assembled monolayer (SAM), and layers of cyt c and RC. The Au|SAM|cyt c|RC working electrode was applied in a three-probe electrochemical cell where a peak cathodic photocurrent density of 0.5 μA cm−2 was achieved. Further electrochemical study of the Au|SAM|cyt c|RC structure demonstrated ∼70% RC surface coverage. To understand the limitations in the electron transfer through the linker structure, a detailed energy study of the SAM and cyt c was performed using photochronoamperometry, ellipsometry, photoemission spectroscopy, and cyclic voltammetry (CV). Using a simple rectangle energy barrier model, it was found that the electrode work function and the large barrier of the SAM are accountable for the low conductance in the devised linker structure. 1. INTRODUCTION The increasing demand for the production of energy without a direct link to combustion of a fossil fuel and the accompanying production of CO2 has brought attention to the deployment of biomolecules for fabrication of biophotoelectrochemical cells. The biophotoelectrochemical cell uses technologies that exploit biomimetic means of energy conversion by utilizing plant- derived photosystems.1,2 Different types of protein complexes may be employed to fabricate a biophotoelectrochemical cell, including reaction centers (RCs) from the Rhodobacter (R.) sphaeroides bacterium, plant photosystems, and bacteriorhodop- sin proteins.3−18 Several studies of the R. sphaeroides RC have shown promise for the utilization of this RC in biophotoelec- trochemical cells.3,4,13−15,19−22 The RC is a transmembrane protein that has nearly 100% quantum yield of primary charge separationi.e., the formation of charged primary donor (P+ ) and final acceptor (QB − )and an efficient stabilization of separated charges.23−25 Most RC-integrated photoelectrochem- ical cells fabricated to date have been comprised of a cell with isolated RCs or RCs surrounded with a light harvesting (LH) pigment−protein antenna attached to a working electrode, immersed in an electrolyte with one or more redox mediators.3,4,14,15,19,20,22,26,27 The use of RC−LH pigment− protein by several groups has shown improved photocurrent densities over those obtained with the RC alone.6,27,28 Although the RC’s internal quantum efficiency is very high and the use of LH ring around the RC was shown to enhance the photon absorption,3,6 the charge transfer between RCs and Received: July 15, 2014 Revised: August 24, 2014 Published: September 19, 2014 Article pubs.acs.org/JPCC © 2014 American Chemical Society 23509 dx.doi.org/10.1021/jp507065u | J. Phys. Chem. C 2014, 118, 23509−23518
- 2. electrodes is another feature that influences biomolecule-based solar energy conversion. The RC of R. sphaeroides is comprised of three protein subunits called L, M, and H (Figure 1c). Typically, biophotoelectrochemical cells have been fabricated using RCs immobilized from either the H-side or the P-side on the surface of one of the cell’s electrode.3,4,13,15,19,20,22,27,29 Upon illumination, a photocurrent can be generated by transferring one of the charges (positive or negative) from the RC to the electrode. The opposite charges are moved to the counter electrode via a redox mediator in the electrolyte. The electron transfer (ET) rate between the RC and the electrode is higher when RCs are oriented on the electrode’s surface from the P- side due to a shorter distance between the RC P+ site and the electrode.29 However, the charge transfer at the RC-electrode interface in this orientation is complicated by a bowl on the P- side that introduces a gap between the electrode and the protein (Figure 1c). A previous work showed a higher photocurrent can be achieved if the bowl of at least some of the RCs may be filled by diffusion of cytochrome c (cyt c) into the space between a 7-His-tagged (at the C terminus of the RC M protein) RC and a nitrillotriacetic acid (NTA)-terminated self-assembled monolayer (SAM) on a Au electrode.30 While the work of Lebedev et al. pointed to the importance of the bowl problem, the approach relies on the random diffusion of cyt c proteins rather than constructing the structure.30 The current study is focused on employing a hybrid oligomer−protein linker for immobilizing the wild-type RC from the P-side onto an Au electrode and at the same time filling the bowl, which resulted in higher peak photocurrent density compared to that in the previous work.30 This structure was assembled through a layer-by-layer deposition of a SAM with carboxylic acid terminal groups,31 cyt c, and RC proteins. Because the feasibility of immobilizing cyt c onto a Au electrode using 6-mercaptohexanoic acid had been demonstrated before,31,32 we utilized the same molecule to construct the hybrid SAM|cyt c linker for RCs (Figure 1a). The goal was to obtain RC immobilization which occurs via the docking interaction between RC and cyt c. It was assumed that this mechanism could bring the cyt c heme and the RC P cofactor into proximity for an efficient ET. The results presented in this work show that the new structure binds the RC without any need for protein mutation. Additionally, the observed photo- current density evidenced successful docking between cyt c and RC. Furthermore, the energy structure of the hybrid linker was studied in detail and a quantum model was proposed to estimate the electrical conductance along the linker. A schematic of the new structure and the ET events between the RC, cyt c, and the SAM-modified Au electrode are illustrated in Figure 1a, with a representation of RC−cyt c interaction given in Figure 1b. Additionally, Figure 1c shows a schematic of the RC protein subunits and the ET pathway through the cofactors. A bowl in the RC is indicated, based on the RC−cyt c cocomplex crystal structure.33 2. EXPERIMENTAL SECTION 2.1. Electrode Preparation. All materials including equine heart cyt c were purchased from Sigma-Aldrich, except for the RC protein. Wild-type RC from Rhodobacter sphaeroides (Supporting Information (SI) Figure S1 shows the absorbance spectrum of the RC) was prepared as described,4,34,35 using LDAO for solubilization. Planar Au working electrodes were fabricated by evaporating an adhesive Cr layer (20 nm) followed by deposition of 400 nm thick Au layers onto the cleaned glass substrates. The Au electrodes were cleaned by rinsing sequentially with acetone, methanol, isopropanol, deionized water, and dried completely under a N2 stream prior to performing experiments. The Au|SAM|cyt c|RC electrode was fabricated by treating a cleaned Au electrode in a 10 mM 6-mercaptohexanoic acid (lower concentrations of linkers resulted in lower photocurrents; SI Figure S2) over 5 days at room temperature, rinsing the electrode in 0.1 M Tris− HCl (pH 8) buffer, followed by immersing in a 0.8 mM cyt c solution for a day at 4 °C, rinsing with buffer, and immersing in a 1.0 μM solution of RCs at 4 °C for a day. Weakly bound RCs were removed from the electrode by rinsing the electrode with buffer. The alkanethiol self-assembly was performed as suggested by Love et al.36 2.2. Electrochemical Setup. The fabricated electrode was used in an electrochemical cell as the working electrode. A 13 cm length of Pt wire of 0.25 mm diameter was shaped to a coil and used as the counter electrode. A 60 μM solution of coenzyme Q2 (2, 3-dimethoxy-5-methyl-6-geranyl-1, 4-benzo- quinone; hereafter referred to as Q) in 0.1 M Tris buffer was used as the electrolyte. It was shown by Trammell et al. that the above-mentioned concentration is not limiting the current in a cell with the RC proteins.29 For the experiments in which a reference electrode was needed, a Ag/AgCl electrode was used. All the experiments were carried out at room temperature using 0.1 M Tris−HCl at pH 8 as the background electrolyte. The Figure 1. (a) ET pathway between the 6-mercaptohexanoic acid-modified Au electrode, cyt c, and the RC in the Au|SAM|cyt c|RC structure. The photon-generated electrons acquired at QB are transferred to the counter electrode via diffusion of QH2 (mediator). (b) The RC−cyt c cocomplex. The RC subunits are represented as ribbons and colored light blue (L), dark blue (M), and brown (H). Green ribbons show cyt c. (c) RC subunit proteins and cofactors. The dashed arrow shows the ET path from P to QB. The Journal of Physical Chemistry C Article dx.doi.org/10.1021/jp507065u | J. Phys. Chem. C 2014, 118, 23509−2351823510
- 3. current polarity convention was set in a fashion that defined cathodic current as negative. Each cell was kept in the dark until the open-circuit potential (OCP) stabilized. For the photo- current measurements, the same potential was applied to the cell by the potentiostat such that the current in the dark was zero.4,11 The cells were illuminated with a commercial solar simulator (RST300S (AM 1.0), Radiant Source Technology) at an incident light intensity of 80 mW cm−2 at the electrode’s surface. The solar light source uses a XL3000 PerkinElmer Fiber Optic Illumination (FOI) system that employs a 300-W Cermax Xenon light. Photocurrents and photovoltages were recorded using a VersaSTAT 4 (Princeton Applied Research) potentiostat in both three and two electrode setups. The three electrode measurements were performed to accurately study the reactions only on the surface of the working electrode (the potential changes of the working electrode are measured independent of changes that may occur at the counter electrode). Hence, the surface area of Pt counter electrode would not be a rate-limiting factor. 2.3. External Quantum Efficiency (EQE) Measure- ments. Light from a Tungsten Halogen lamp (Oriel 6334NS 24 V250W) was focused onto the entrance slit of a monochromator (Cornerstone 260 1/4M) using a pair of parabolic mirrors. The dispersed light passing through the exit slit (slit width: 5 nm) was subsequently focused onto the device using a convex lens. The photocurrent was measured from 590 to 950 nm in steps of 6 nm in the three-electrode cell. At each wavelength step, the photocurrent was monitored for two complete cycles consisting of 20 s of illumination followed by 20 s in the dark, where the light was blocked by a computer controlled shutter at the exit slit of the monochromator. The incident power was measured by a thermopile detector (Oriel 71945) connected to a multimeter (Keithley2000). The EQE was measured as the ratio of collected electrons to incident photons.37,38 The equation for calculation is thus: ω = × ·ℏ · J e I EQE 100 (1) where J is the current density in A cm−2 , e is the electron charge in C, I is the incident photon power density in W cm−2 , and ℏω is the energy per photon in Joules, all at the wavelength λ (see SI for further details). 2.4. Ellipsometry. The thickness measurements were performed using a Rudolf Research Type ellipsometer AutoEL (wavelength of 6328 Å (He−Ne laser)) at an incident angle of 70° for carboxylic acid-terminated SAMs; a Sopra spectroscopic ellipsometer ES 4G (multilayer optical spectrometric scanner) at an incident angle of 70.1° was used for cyt c and RC layers. The refractive index and the coefficient of absorption values for the Au substrates were measured to be 0.1508 and 3.3280, respectively. The ellipsometric data were analyzed assuming an index of refraction of 1.4846 for the SAM monolayer, as suggested by the supplier (Sigma-Aldrich). 2.5. Photoemission Spectroscopy. For photoemission spectroscopy, all samples were prepared in a glovebox which was fitted to the fast load lock of a multifunctional characterization system.39 This commercial multichamber system (SPECS, Berlin, Germany) consists of two preparation chambers and one analysis chamber outfitted for X-ray photoemission spectroscopy (XPS). The base vacuum level of this system is 2 × 10⁻¹⁰ mbar. An Mg Kα X-ray emission source with incident energy of 1253.6 eV and 20 mA emission current was used for the core level XPS. Low intensity XPS (LIXPS) measurements were performed prior to XPS in standby mode with 0.1 mA emission current. The corresponding significantly lower amount of photon flux was generated and used to measure the sample work function (WF) free of charging artifacts.40 The ultraviolet photoemission spectroscopy (UPS) measurement was carried out with a SPECS UVS10/35 UV source by discharging highly pure helium gas (99.99%). The He I line was generated by controlling the discharging voltage in a range of 600 to 750 V. The data analysis was performed using Igor Pro software. The energy gap of the linker molecule was estimated from the optical absorption spectrum using a Thermo Scientific (Evolution 201) UV−vis spectrophotometer. Further experimental details are given in the SI. 3. RESULTS 3.1. Photochronoamperometry Analysis. The photo- current density of the Au|SAM|cyt c|RC structure was measured in both three and two electrode setups with only one diffusible redox mediator (Q) in the electrolyte. As shown in Figure 2a, in a three-electrode experiment, a cathodic photocurrent was achieved upon illumination. Immobilizing RCs using hybrid SAM|cyt c linker resulted in peak current density of up to 0.5 μA cm−2 , which is at least 3 times of that using random diffusion of cyt c proteins in a previous work.30 The photocurrent density stabilized at −185 nA cm−2 after 400 s while the working electrode was held at the dark OCP of +0.05 V vs normal hydrogen electrode (NHE). There was an initial spike of photocurrent at the onset of illumination similar to what has been observed in a recent work.27 It was reasoned that this initial spike was originated from a kinetic limitation at the RC’s primary acceptor side (QB) due to the different rates of P+ reduction and QB − oxidation, which results in buildup of negative charges within the protein.27 Accordingly, the overoxidation of the redox mediator equilibrates the charge accumulation inside RC.27 To confirm the contribution of the protein complexes to the photocurrent generation, control experiments were performed on a cell containing a Au|SAM|cyt c working electrode and Q as the charge carrier, but without any RC protein component. The negligible photocurrent density in the Au|SAM|cyt c structure (black line in Figure 2a) demonstrates that the photocurrent Figure 2. (a) Time dependence photoresponse of a fabricated biophotoelectrochemical cell under 80 mW cm−2 illumination with coenzyme Q as the single diffusible redox mediator. In the graph the arrows indicate light ON (↑) and OFF (↓), with the current obtained from the configurations shown as nA cm−2 according to the key. (b) EQE of the photocurrent, per incident photon, generated on the Au| SAM|cyt c|RC electrode (red dots), compared to the absorption spectrum of the RC (bold black line). The Journal of Physical Chemistry C Article dx.doi.org/10.1021/jp507065u | J. Phys. Chem. C 2014, 118, 23509−2351823511
- 4. stems from the charge generation in the RC. The cathodic photocurrent in the Au|SAM|cyt c|RC structure implies ET from the Au electrode to the RC, which likely suggests the protein orientation with the primary donor (P-side) facing the electrode. Hence, the majority of cyt c molecules likely bound to the P-side of the RC protein complex. Adding more cyt c to the electrolyte did not enhance the photocurrent, which supports the interpretation that the majority of the RCs were docked onto SAM-bound cyt c proteins. The photochronoam- perometry study of the two electrode setup resulted in a short circuit steady-state photocurrent density (JSC) of −156 nA cm−2 and a steady-state open circuit voltage (VOC) of ∼90 mV under continuous illumination (SI Figure S3). As shown in the following text, the energy barrier at the SAM is one of the limiting factors for an efficient charge transfer and energy conversion. However, the very low photocurrent (15 nA cm−2 ) from an electrode without any SAM (Au|cyt c|RC in Figure 2a) shows the importance of the linker molecule in a successful use of the incubated cyt c for the RC immobilization. The low photocurrent may be due to variable orientation of cyt c upon adsorption on Au and/or cyt c conformational changes, protein unfolding, and even denaturation on this bare metal electrode, as it has been shown in several studies.41−43 To further verify that the observed photocurrent in the Au| SAM|cyt c|RC cell stems from the photon absorption and charge generation by RCs, a photocurrent action spectrum was obtained across 590 to 950 nm and the EQE was estimated, as well (see Experimental). Figure 2b shows a substantial match between the RC absorption spectrum and the efficiency of photocurrent generation across this wavelength range. The distinctive triplets of RC cofactor absorptions are clearly present in the EQE spectrum. The stability of the Au|SAM|cyt c|RC structure was studied further by measuring the photocurrent density of a single cell over a course of 5 days. As shown in Figure 3, the magnitude of the photocurrent density dropped from 185 nA cm−2 for a fresh electrode to 102 nA cm−2 after 4 days of storage in aerobic condition. The result suggests that the rate of reduction in the photocurrent density is faster in the first couple of days. This could be due to the degradation of fraction RC complexes, as was shown in an earlier study by Ciesielski et al. for photosystem I (PSI)-based photoelectrochemical cells.11 Extended device lifetime by appropriate sealing and oxygen removal can be achieved as it has been shown earlier.11 Additionally, these results show that, despite the lack of a covalent bond between RC and cyt c, the protein−protein interaction is strong enough to hold more than half of the RCs after 4 days, in aerobic conditions, while the protein complexes kept their integrity and functionality. Since the thickness and the energy levels of the SAM and the cyt c layer affect the electron transfer rate through the hybrid linker, further studies were carried out to characterize each layer. The thickness of the layers was measured using the ellipsometry technique. The energy levels of the SAM were studied using the photoemission spectroscopy and the UV−vis absorption methods. Additionally, cyclic voltammetry (CV) was used to investigate the energy level of cyt c as well as to estimate the success rate of the cyt c and the RC immobilization. The results from these measurements were used to confirm the successful construction of the Au|SAM|cyt c|RC structure using the layer-by-layer assembly. 3.2. Ellipsometry Analysis. The Au|SAM|cyt c|RC structure was further studied by measuring the thickness of the SAM, SAM|cyt c, and SAM|cyt c|RC layers using ellipsometry. This was performed to confirm that the thickness of each layer is in agreement with the size of employed molecules. As shown in Figure 4, the SAM prepared from an ethanolic solution of 10 mM 6-mercaptohexanoic acid showed a ∼14 Å thick layer. Assuming a 30° tilt for the alkanethiol chain,32 the measured thickness is slightly larger than the theoretical thickness expected for a close-packed monolayer oriented to the surface. This has been explained by coverage of a high free energy surface (i.e., Au) with reversibly physisorbed layers of water, hydrocarbons, and other organic compounds under laboratory ambient conditions.44 As shown in Figure 4, the thickness of the SAM increased by ∼33 Å after cyt c immobilization on top, which is in a good agreement with the size of cyt c reported by other groups.45−47 Upon deposition of the RCs the thickness increased from ∼47 Å to ∼120 Å, indicating that a monolayer of RCs (thickness ∼70 Å) had attached on top of the Au|SAM|cyt c. 3.3. Photoemission Spectroscopy Analysis. In order to evaluate how the energy levels of the SAM affect the ET between the Au electrode and the RC, the highest-occupied- molecular-orbital (HOMO) and the lowest-unoccupied-molec- ular-orbital (LUMO) of the SAM were measured using LIXPS, UPS, and UV−vis absorption spectroscopy methods. Addition- ally, XPS data provided further evidence for the successful attachment of the desired molecules (see Figures S4−S5 for Figure 3. Change in the steady-state photocurrent density of a cell, measured over a course of 5 days (one test each day). Figure 4. Ellipsometric estimation of the thickness of sample 1 (SAM of 6-mercaptohexanoic acid), sample 2 (SAM|cyt c), and sample 3 (SAM|cyt c|RC). The Journal of Physical Chemistry C Article dx.doi.org/10.1021/jp507065u | J. Phys. Chem. C 2014, 118, 23509−2351823512
- 5. further details). Figure 5 shows the UP spectra measured before and after deposition of the SAM during this experiment. The center panel (Figure 5b) shows the complete spectra, and the side panels show the secondary edge normalized (Figure 5a) as well as the valence bands region after background subtraction (Figure 5c). The secondary edge spectral cutoffs acquired via LIXPS (Figure 5a) allowed for the determination of the WF of the Au and the Au|SAM substrates. The WF was calculated by subtracting the cutoff binding energy value from the excitation energy (21.2182 eV) and taking the analyzer broadening of 0.1 eV into account. Figure 5b shows the complete set of normalized UPS. The main emission features include the Fermi level, the valence bands/HOMO (VB/HOMO) density of states, and the secondary edge. The magnified VB/HOMO spectra with background removed are shown in Figure 5c. Before deposition of a SAM, the valence bands and the Fermi level of the Au substrate can be clearly observed. After the deposition of a SAM, these features are suppressed and replaced by features corresponding to the emissions from the SAM. The valence bands maximum (VBM) of the Au electrode coated with a SAM relative to Au alone are shown in the magnified VB/HOMO spectra. In order to estimate the optical band/HOMO−LUMO gap in the linker molecule, the absorption spectrum of the linker solution (10 mM in ethanol) was measured. As shown in Figure 6, the absorption threshold starts around 300 nm which corresponds to an energy gap of 4.13 eV. From the LIXPS and UPS results the HOMO level is measured to be 7.2 eV below the vacuum level. Hence, the absorption results indicate a LUMO of 3.07 eV below the vacuum level. As explained in the Discussion section, the energy levels in the SAM can be used to draw an energy diagram across the Au|SAM|cyt c|RC to assess the limitations in the ET. 3.4. Electrochemistry Analysis. To estimate the electro- chemical midpoint potentials (i.e., energy levels) and the surface coverage of the proteins, electrochemical CV was performed for each layer. Figure 7a shows the CVs of Au, Au| SAM, Au|SAM|cyt c, and Au|SAM|cyt c|RC electrodes at a scan rate of 0.05 V·s−1 at room temperature. As curve ii shows, the Au electrode primed with a layer of 6-mercaptohexanoic acid SAM exhibited no electroactivity in the potential range from 0.1 to 0.6 V in the 0.1 M Tris−HCl (pH 8.0) background electrolyte. Previous studies have mainly reported the CVs of carboxylic acid-terminated SAM electrodes for positive voltages.32 When the scan range was extended below 0.0 V vs NHE (i.e., the case here) the CV of the SAM showed a pair of peaks corresponding to protonation and deprotonation of the surface COOH groups.48 After immobilization of cyt c, direct electrochemistry of surface-bound cyt c was achieved (Figure 7, curve (iii), and a pair of quasi-reversible redox peaks due to the one-electron oxidation and reduction of a heme FeIII/FeII couple was apparent at ∼0.23 V vs NHE (Figure 7b). The surface formal potential of cyt c is nearly identical to the values previously reported for cyt c bound to physiological membranes.49 From the average of the reduction and oxidation peak potentials, the redox potential of cyt c was measured to be ∼0.23 V vs NHE (4.73 eV below vacuum level). The CV result from RCs in the Au|SAM|cyt c|RC structure in the presence of quinone (Q) in the electrolyte is presented in Figure 7(c). Because the immobilized proteins are present as a Figure 5. LIXPS and UP spectra before (red) and after (black) the deposition of SAM on a clean Au substrate. (a) The normalized secondary edges measured with LIXPS before UPS. (b) The complete normalized UP spectra. (c) The evolution of the VB emission features through the deposition process (black, SAM; red, Au). Figure 6. UV−vis absorption spectrum of the linker solution (10 mM 6-mercaptohexanoic acid). The Journal of Physical Chemistry C Article dx.doi.org/10.1021/jp507065u | J. Phys. Chem. C 2014, 118, 23509−2351823513
- 6. monolayer, the concentration of RC is very low, and the redox peaks in the CV graph are relatively small. Nevertheless, the RC P peaks at ∼0.4 and 0.6 V vs NHE were observed, which confirms the successful RC immobilization (see SI Figure S6 for the pronounced oxidation and reduction peaks of the RC primary donor in the presence of excess RCs). The midpoint potential of RC was estimated to be ca. +0.45 (vs NHE), which is similar to that reported in previous works.3,4,20 This confirms that in this structure the RCs are still redox-active, upon docking to cyt c. As explained in the Discussion section, the area under the anodic peak (Figure 7c, inset) has been used to estimate the total amount of exchanged charges in the redox reaction of RCs, from which the RC density and surface coverage were estimated. 4. DISCUSSION The cathodic photocurrent in Figure 2 indicates the direction of ET from the Au electrode to the RC protein via the SAM|cyt c structure, and accordingly confirms the anticipated protein orientation with the P-side facing the electrode. Although the photocurrent result shows the feasibility of immobilizing RCs through cyt c proteins, the overall photocurrent depends on the number of the immobilized RCs and the ET rate through the SAM|cyt c linker. Assuming a high degree of surface coverage by the SAM,31 the density of immobilized RCs is limited by the frequency of binding to cyt c. Using the results from the electrochemical experiments, we describe in the following text an estimation of the surface coverage of the cyt c and the RC layers. Also, the ET rate is estimated from the transient photocurrent response. For surface coverage estimation of active cyt c heme proteins, the total charge was calculated using the CV peak integration (Figure 7b) after background subtraction.32 For the Au|SAM| cyt c structures, the electroactive surface density of cyt c was determined by automatic CV peak integration, using VersaSTAT 4 software. Integrating the area under the peak of photocurrent density vs potential gives the charge density (Qtotal). Using Faraday’s Law, the electroactive surface concentration of cyt c can be then estimated using eq 2:20,32 Γ = Q nF total (2) where Γ is the electroactive surface density of cyt c, n is the number of unit charges in the redox reaction of the protein (n = 1 in this case), and F is the faradaic constant (96485 C·mol−1 ). Considering the surface area of the electrode, the surface density of ∼14 × 10−12 mole·cm−2 was estimated for immobilized cyt c, which is consistent with a previous report.32 Bearing in mind the approximate diameter of a cyt c molecule, 3.3 nm,45 the calculated value of the cyt c surface concentration corresponds to a ∼70% surface coverage of the electrode. The CV peak integration technique was also applied to estimate the surface coverage of RC using the CV plot in Figure 7c. The measured charge density of ∼581 nC (Figure 7c, inset) corresponds to a surface density of RC of 6.02 × 10⁻¹² mol· cm−2 . Considering the estimated density of cyt c on the surface (14 × 10−12 mol·cm−2 ) the number of attached RCs is almost half of the cyt c proteins on the electrode. Despite the lower number of RCs, based on the protein diameter (∼5 nm) the RC surface coverage is estimated to be ∼70%, which is in the same range as cyt c. Previous research has shown that electrostatic interactions between acidic amino acids on the RC periplasmic surface (P-side) and the basic amino acid residues, primarily lysines, surrounding the cyt c heme contribute to interprotein docking and stability of the RC− cyt c cocomplex;33,50 Our unpublished results shows that R. sphaeroides cyt c2 and horse heart cyt c are ∼30% structurally similar. Additionally, cyt c was found to bind to the proximal position faster, as well as with a higher affinity of the oxidized form to the RC.51 In the current study, the photocurrent density of the Au|SAM|cyt c|RC structure confirms the binding of cyt c and RC complexes. Additionally, the photocurrent direction proves that cyt c binds to the P-side of the RC protein complex. This binding configuration here can be compared to the mechanism known for the in vivo RC and cyt c proteins bond, as proposed by others.52−54 The ET rate between RC and the Au electrode in the Au| SAM|cyt c|RC structure was estimated through the photo- current transition at the onset of illumination as suggested by Trammell et al.29 Figure 8 shows the photocurrent transition (1.4 s) for the RC-modified Au electrode with RC proteins sitting on cyt c-terminated SAMs. Assuming the transient photocurrent follows an exponential profile, the current density, J, was fitted to J = Jpeak(1 − e−kt ), where Jpeak = −450 nA cm−2 is Figure 7. (a) CVs of a Au electrode (i, black trace), a Au|SAM electrode (ii, red trace), Au|SAM|cyt c (iii, blue trace), and Au|SAM|cyt c|RC (iv, orange trace). The scan rate was 0.05 V·s−1 , and the background electrolyte was 0.1 M Tris buffer. (b) Close-up view of the green rectangle in panel a, which shows a pair of quasi-reversible redox peaks attributed to the heme FeIII/FeII couple in cyt c, at ∼0.23 V vs NHE (blue trace), wherein the comparative CV for iv is shown in orange. (c) CV of the Au|SAM|cyt c|RC electrode (scan rate of 0.05 V·s−1 ) in the presence of Q, which shows oxidation−reduction peaks of the RC primary donor (P). The inset shows the anodic peak scaled and colored to emphasize the area of interest. The surface under the peak (purple) was used to estimate the density of immobilized RCs. The Journal of Physical Chemistry C Article dx.doi.org/10.1021/jp507065u | J. Phys. Chem. C 2014, 118, 23509−2351823514
- 7. the peak current density, k is the ET rate, and t is time (t = 0 is the onset of the illumination). Based on the fitting curve in Figure 8, the ET rate between the RC and the Au electrode was estimated to be k = 7.1 s−1 . The relatively low ET rate in the Au|SAM|cyt c|RC structure can be explained by an energy diagram of the different layers, shown in Figure 9. The electrochemical midpoint potentials of the cyt c heme and P+ in RC were measured at 0.23 and 0.45 V vs NHE, respectively (Figure 7). The energy levels inside the RC have been studied in detail by others and explained by Blankenship.55 The midpoint potential of Q at pH 8 was measured in our earlier work as ∼0.042 V vs NHE.4 The vacuum potential of Pt and the electrochemical potential of the QB site within the RC were also presented in a previous report.3 The HOMO and LUMO levels for the SAM were obtained from UPS, LIXPS, and UV− vis absorption results (Figures 5 and 6). The observed cathodic photocurrent implies ET from the Au to P+ in the RC, while the energy diagram in Figure 9 shows that the ET is hindered by the energy barrier of the SAM and the unfavorable energy difference between Au and cyt c. Although the Au Fermi level is below the cyt c energy level, the density of electrons above the Fermi level is not zero at room temperature. Additionally, WF measurement of the sputtered Au was performed in vacuum. The WF of a surface can be strongly affected by the condition of the surface. In the event of surface reactions (such as oxidation or reduction), the WF can change considerably. Hence, it is reasonable to assume that there are electrons with enough energy to tunnel through the SAM to the cyt c. Considering the energy barrier (ΔE1) of 1.93 eV (the difference between EF (Au) and ELUMO (SAM)) and the tunneling length (a) of 3.0 nm (Figure 4, sample 2 - the distance from the electrode to the middle of cyt c where heme is located), the wave function for an electron tunneling through the SAM experiences attenuation. Using a simple square barrier model for the SAM, the one-dimensional conductance, G, through the barrier can be found from eq 3:56 = ΔG e h T E 2 ( ) 2 2 (3) where e = 1.6 × 10⁻¹⁹ C is the charge of one electron, h = 6.626 × 10⁻³⁴ J·s is Planck’s constant, and T(ΔE2) is the tunneling transmission coefficient between two energy states across the barrier with an energy difference of ΔE2. For a large barrier, the transmission coefficient is estimated by eq 4:56 π Δ ≈ Δ Δ − Δ⎛ ⎝ ⎜⎜ ⎞ ⎠ ⎟⎟T E E E m E h a( ) 16 exp 4 2 2 2 1 e 1 (4) where me = 9.11 × 10⁻³¹ kg is the electron mass. From eq 2 and 3, the one-dimensional conductance of the barrier is estimated to be G = 4.65 × 10⁻²³ Ω−1 , which is very low. It should be noted that G is not the conductance of the SAM, but is the conductance along a single linker molecule (in one dimension). As shown in Figure 2, the SAM has a crucial role in the protein immobilization since without the linker no photocurrent was observed (mainly due to the cyt c adsorption orientation). In order to eliminate the charge transfer barrier, a conjugated linker molecule with a HOMO level slightly higher than the energy level in cyt c could be used. In this case, the ET would occur by the charge hopping through the hybrid conjugated molecule-cyt c linker, instead of tunneling. Additionally, a low WF material for the working electrode would greatly increase the ET rate. A detailed study of such approaches is underway in our laboratory, and the results will be reported in forthcoming papers. The proposed docking mechanism, described above, may also be exploited for other types of carotenoid-based proteins such as RC-light harvesting (LH) complexes and possibly PSI for intriguing applications in photovoltaic, photonic, optoelec- tronic devices, and biosensors.9,27,57−60 Carotenoid-based proteins have shown promise for photo- voltaic applications. Several studies have focused on the assembly of PSI onto various substrates such as P-dope silicon and graphene oxide, which resulted in enhanced current densities over 100 μA cm−2 .10,61 Other studies on integration of oriented RC-LH1 complexes, mostly on transparent conductive oxide electrodes, showed several μA current densities,19,27 with an exception of a recent work on a densely packed monolayer of RC-LH1 complexes on a Au electrode using Langmuir− Blodgett technology, which resulted in a 45 μA cm−2 current density.62 Beside carotenoid-based photosystems, bacteriorho- dopsin as a robust light-driven proton pump has found various applications in solar energy conversion,17,18,63 optoelec- tronics,64 and organic field effect transistors.65 A recent study on fabricating a photovoltaic cell using aqueous bacteriorho- Figure 8. Photocurrent transition (inset, close-up view of the dashed rectangle) at the onset of illumination for Au|SAM|cyt c|RC electrode (onset of illumination at 0.0 s, and cessation of illumination as indicated by the upward and downward pointing arrows). Figure 9. Energy diagram of the bioelectrochemical cell with the Au| SAM|cyt c|RC structure and the proposed mechanism for operation of the cells with Q as the single diffusible redox mediator. RC complexes are modeled as oriented with the P-side toward the Au electrode. Arrows indicate the route of ET from the Au to cyt c, into the P-side of the RC, and through Q to the Pt electrode. The energy level at each layer is relative to the vacuum level. The corresponding electro- chemical potentials can be found from the normal hydrogen electrode (NHE) axis at the right. The Journal of Physical Chemistry C Article dx.doi.org/10.1021/jp507065u | J. Phys. Chem. C 2014, 118, 23509−2351823515
- 8. dopsin generated a photoelectric response of ∼33 μA cm−2 .66 Overall, the tendency toward biomimetic devices and the need for the production of clean energy by mimicking nature brings the light-capturing proteins applications in bioelectronic devices to the forefront of cutting-edge research. The overall effort will advance the application of biological materials in electronic devices with a far reaching impact in the fields of solar cells, biosensors, and bionanotechnology. 5. CONCLUSIONS We have demonstrated the feasibility of utilizing a protein− protein interaction to immobilize the R. sphaeroides wild type RC protein from the P-side through a hybrid carboxylic acid- terminated alkanethiol SAM|cyt c linker. The new linker structure has demonstrated the ability to control the orientation of the RC with reasonable stability in bonding to the RC protein complex. A simple layer-by-layer deposition/incubation method was applied to build a Au|SAM|cyt c|RC structure which resulted in 70% of the surface coverage by RC proteins. The ET rate between the Au electrode and RCs was found to be k ≈ 7.1 s−1 . Our detailed energy study of the layers showed a large energy barrier at the SAM which limits the ET rate. These results provide key information about how specific surface modification of an electrode may control the performance of RC complexes in systems suitable for the development of solar energy converters, and other types of photon energy-harvesting biomaterials. This work provides an experimental and theoretical baseline for future work. ■ ASSOCIATED CONTENT *S Supporting Information Additional information including further experimental details, absorbance spectra of RCs of R. sphaeroides at room temperature, the effect of linker solution concentration on the photocurrent density for the Au|SAM|cyt c|RC cell, the two- electrode photocurrent and photovoltage measurements of the Au|SAM|cyt c|RC structure, XPS spectra of O1s, N1s, C1s, and S2p core level emissions for Au, Au|SAM, Au|SAM|cyt c, and Au|SAM|cyt c|RC samples, Gaussian−Lorentzian fit to the RC N 1s emission line measured on the Au|SAM|cyt c|RC electrode, CV of the Au|SAM|cyt c|RC electrode in the presence of Q with excessive RCs, which shows pronounced oxidation and reduction peaks for the RC primary donor (P), and effects of cycling the applied potential on the mean steady state current densities, obtained from the Au|SAM|cyt c|RC electrode. This material is available free of charge via the Internet at http://pubs.acs.org. ■ AUTHOR INFORMATION Corresponding Authors *E-mail: hyaghoubi@mail.usf.edu; Tel.: +1-813-409-8192. *E-mail: atakshi@usf.edu Tel.: +1-813-421-3037. Notes The authors declare no competing financial interest. ■ ACKNOWLEDGMENTS The authors wish to acknowledge the University of South Florida for the financial support of this work. This work was supported by the National Science Foundation through NSF 1400017. The authors also wish to acknowledge Ms. Caitrin Eaton for valuable assistance with data processing. ■ REFERENCES (1) Boghossian, A. A.; Ham, M.-H.; Choi, J. H.; Strano, M. S. Biomimetic Strategies for Solar Energy Conversion: A Technical Perspective. Energy Environ. Sci. 2011, 4, 3834−3843. (2) Yehezkeli, O.; Tel-Vered, R.; Michaeli, D.; Willner, I.; Nechushtai, R. Photosynthetic Reaction Center-Functionalized Elec- trodes for Photo-Bioelectrochemical Cells. Photosynth. Res. 2013, 1− 15. (3) Tan, S. C.; Crouch, L. I.; Mahajan, S.; Jones, M. R.; Welland, M. E. Increasing the Open-Circuit Voltage of Photoprotein-Based Photoelectrochemical Cells by Manipulation of the Vacuum Potential of the Electrolytes. ACS Nano 2012, 6, 9103−9109. (4) Yaghoubi, H.; Li, Z.; Jun, D.; Saer, R.; Slota, J. E.; Beerbom, M.; Schlaf, R.; Madden, J. D.; Beatty, J. T.; Takshi, A. The Role of Gold- Adsorbed Photosynthetic Reaction Centers and Redox Mediators in the Charge Transfer and Photocurrent Generation in a Bio- Photoelectrochemical Cell. J. Phys. Chem. C 2012, 116, 24868−24877. (5) Yaghoubi, H.; Takshi, A.; Jun, D.; Saer, R.; Madden, J. D.; Beatty, J. T. Free-Floating Reaction Centers (RCs) Versus Attached Monolayer of RCs in Bio-Photoelectrochemical Cells. Mater. Res Soc. Symp. Proc., 1414, mrsf11-1414-hh07-03, 2012; 10.1557/opl.2012.735 (6) den Hollander, M.-J.; Magis, J. G.; Fuchsenberger, P.; Aartsma, T. J.; Jones, M. R.; Frese, R. N. Enhanced Photocurrent Generation by Photosynthetic Bacterial Reaction Centers through Molecular Relays, Light-Harvesting Complexes, and Direct Protein−Gold Interactions. Langmuir 2011, 27, 10282−10294. (7) Lu, Y.; Xu, J.; Liu, B.; Kong, J. Photosynthetic Reaction Center Functionalized Nano-Composite Films: Effective Strategies for Probing and Exploiting the Photo-Induced Electron Transfer of Photosensitive Membrane Protein. Biosens. Bioelectron. 2007, 22, 1173−1185. (8) Katz, E. Application of Bifunctional Reagents for Immobilization of Proteins on a Carbon Electrode Surface: Oriented Immobilization of Photosynthetic Reaction Centers. J. Electroanal. Chem. 1994, 365, 157−164. (9) Efrati, A.; Tel-Vered, R.; Michaeli, D.; Nechushtai, R.; Willner, I. Cytochrome C-Coupled Photosystem I and Photosystem II (PSI/ PSII) Photo-Bioelectrochemical Cells. Energy Environ. Sci. 2013, 6, 2950−2956. (10) LeBlanc, G.; Chen, G.; Gizzie, E. A.; Jennings, G. K.; Cliffel, D. E. Enhanced Photocurrents of Photosystem I Films on P-Doped Silicon. Adv. Mater. 2012, 24, 5959−5962. (11) Ciesielski, P. N.; Hijazi, F. M.; Scott, A. M.; Faulkner, C. J.; Beard, L.; Emmett, K.; Rosenthal, S. J.; Cliffel, D.; Kane Jennings, G. Photosystem I-Based Biohybrid Photoelectrochemical Cells. Bioresour. Technol. 2010, 101, 3047−3053. (12) Yehezkeli, O.; Wilner, O. I.; Tel-Vered, R.; Roizman-Sade, D.; Nechushtai, R.; Willner, I. Generation of Photocurrents by Bis-Aniline- Cross-Linked Pt Nanoparticle/Photosystem I Composites on Electro- des. J. Phys. Chem. B 2010, 114, 14383−14388. (13) Trammell, S. A.; Wang, L.; Zullo, J. M.; Shashidhar, R.; Lebedev, N. Orientated Binding of Photosynthetic Reaction Centers on Gold Using Ni−NTA Self-Assembled Monolayers. Biosens. Bioelectron. 2004, 19, 1649−1655. (14) Nagata, M.; et al. Immobilization and Photocurrent Activity of a Light-Harvesting Antenna Complex II, LHCII, Isolated from a Plant on Electrodes. ACS Macro Lett. 2012, 1, 296−299. (15) Kondo, M.; et al. Photocurrent and Electronic Activities of Oriented-His-Tagged Photosynthetic Light-Harvesting/Reaction Cen- ter Core Complexes Assembled onto a Gold Electrode. Biomacromo- lecules 2012, 13, 432−438. (16) Al-Aribe, K. M.; Knopf, G. K.; Bassi, A. S. Organic Photovoltaic Cells Based on Photoactive Bacteriorhodopsin Proteins, In Proc. SPIE 8615, Microfluidics, BioMEMS, and Medical Microsystems XI, 2013; pp 86150Q−86150Q-9, doi:10.1117/12.2004018. (17) Bertoncello, P.; Nicolini, D.; Paternolli, C.; Bavastrello, V.; Nicolini, C. Bacteriorhodopsin-Based Langmuir-Schaefer Films for Solar Energy Capture. IEEE Trans Nanobioscience 2003, 2, 124−132. The Journal of Physical Chemistry C Article dx.doi.org/10.1021/jp507065u | J. Phys. Chem. C 2014, 118, 23509−2351823516
- 9. (18) Zhang, L.; Zeng, T.; Cooper, K.; Claus, R. O. High-Performance Photovoltaic Behavior of Oriented Purple Membrane Polymer Composite Films. Biophys. J. 2003, 84, 2502−2507. (19) Tan, S. C.; Yan, F.; Crouch, L. I.; Robertson, J.; Jones, M. R.; Welland, M. E. Superhydrophobic Carbon Nanotube Electrode Produces a Near-Symmetrical Alternating Current from Photo- synthetic Protein-Based Photoelectrochemical Cells. Adv. Funct. Mater. 2013, 5556−5563. (20) Trammell, S. A.; Griva, I.; Spano, A.; Tsoi, S.; Tender, L. M.; Schnur, J.; Lebedev, N. Effects of Distance and Driving Force on Photoinduced Electron Transfer between Photosynthetic Reaction Centers and Gold Electrodes. J. Phys. Chem. C 2007, 111, 17122− 17130. (21) Das, R.; et al. Nano Lett. 2004, 4, 1079−1083. (22) Kondo, M.; Nakamura, Y.; Fujii, K.; Nagata, M.; Suemori, Y.; Dewa, T.; Iida, K.; Gardiner, A. T.; Cogdell, R. J.; Nango, M. Self- Assembled Monolayer of Light-Harvesting Core Complexes from Photosynthetic Bacteria on a Gold Electrode Modified with Alkanethiols. Biomacromolecules 2007, 8, 2457−2463. (23) van Grondelle, R.; Dekker, J. P.; Gillbro, T.; Sundstrom, V. Energy Transfer and Trapping in Photosynthesis. Biochim. Biophys. Acta, Bioenerg. 1994, 1187, 1−65. (24) Feher, G. A.; J, P.; Okamura, M. Y.; Ree, D. C. Structure and Function of Bacterial Photosynthetic Reaction Centres. Nature 1989, 339, 111−116. (25) Kirmaier, C.; Holten, D. Primary Photochemistry of Reaction Centers from the Photosynthetic Purple Bacteria. Photosynth. Res. 1987, 13, 225−260. (26) Takshi, A.; Yaghoubi, H.; Jun, D.; Saer, R.; Mahmoudzadeh, A.; Madden, J. D.; Beatty, J. T. Application of Wide Band Gap Semiconductors to Increase Photocurrent in a Protein Based Photovoltaic Device. Mater. Res. Soc. Symp. Proc., 1414, mrsf11-1414- hh07-01, 2012; doi:10.1557/opl.2012.762. (27) Tan, S. C.; Crouch, L. I.; Jones, M. R.; Welland, M. Generation of Alternating Current in Response to Discontinuous Illumination by Photoelectrochemical Cells Based on Photosynthetic Proteins. Angew. Chem., Int. Ed. 2012, 51, 6667−6671. (28) Magis, G. J.; den Hollander, M.-J.; Onderwaater, W. G.; Olsen, J. D.; Hunter, C. N.; Aartsma, T. J.; Frese, R. N. Light Harvesting, Energy Transfer and Electron Cycling of a Native Photosynthetic Membrane Adsorbed onto a Gold Surface. Biochim. Biophys. Acta, Biomembr. 2010, 1798, 637−645. (29) Trammell, S. A.; Spano, A.; Price, R.; Lebedev, N. Effect of Protein Orientation on Electron Transfer between Photosynthetic Reaction Centers and Carbon Electrodes. Biosens. Bioelectron. 2006, 21, 1023−1028. (30) Lebedev, N.; Trammell, S. A.; Spano, A.; Lukashev, E.; Griva, I.; Schnur, J. Conductive Wiring of Immobilized Photosynthetic Reaction Center to Electrode by Cytochrome C. J. Am. Chem. Soc. 2006, 128, 12044−12045. (31) Davis, K. L.; Drews, B. J.; Yue, H.; Waldeck, D. H.; Knorr, K.; Clark, R. A. Electron-Transfer Kinetics of Covalently Attached Cytochrome C/Sam/Au Electrode Assemblies. J. Phys. Chem. C 2008, 112, 6571−6576. (32) Song, S.; Clark, R. A.; Bowden, E. F.; Tarlov, M. J. Characterization of Cytochrome C/Alkanethiolate Structures Prepared by Self-Assembly on Gold. J. Phys. Chem. 1993, 97, 6564−6572. (33) Axelrod, H. L.; Abresch, E. C.; Okamura, M. Y.; Yeh, A. P.; Rees, D. C.; Feher, G. X-ray Structure Determination of the Cytochrome C2: Reaction Center Electron Transfer Complex from Rhodobacter sphaeroides. J. Mol. Biol. 2002, 319, 501−515. (34) Saer, R. G.; Hardjasa, A.; Rosell, F. I.; Mauk, A. G.; Murphy, M. E. P.; Beatty, J. T. Role of Rhodobacter sphaeroides Photosynthetic Reaction Center Residue M214 in the Composition, Absorbance Properties, and Conformations of Ha and Ba Cofactors. Biochemistry 2013, 52, 2206−2217. (35) Jun, D.; Saer, R. G.; Madden, J. D.; Beatty, J. T. Use of New Strains of Rhodobacter sphaeroides and a Modified Simple Culture Medium to Increase Yield and Facilitate Purification of the Reaction Centre. Photosynth. Res. 2013, 1−9. (36) Love, J. C.; Estroff, L. A.; Kriebel, J. K.; Nuzzo, R. G.; Whitesides, G. M. Self-Assembled Monolayers of Thiolates on Metals as a Form of Nanotechnology. Chem. Rev. 2005, 105, 1103−1170. (37) Ünal, B.; Bayliss, S. C. Photovoltaic Effects from Porous Si. J. Phys. D: Appl. Phys. 1997, 30, 2763. (38) Brabec, C. J.; Dyakonov, V.; Parisi, J.; Sariciftci, N. S. Organic Photovoltaics: Concepts and Realization; Springer: Heudelberg, Germany, 2003. (39) Wolak, M. A.; et al. Electronic Structure of Self-Assembled Peptide Nucleic Acid Thin Films. J. Phys. Chem. C 2011, 115, 17123− 17135. (40) Schlaf, R.; Murata, H.; Kafafi, Z. H. Work Function Measurements on Indium Tin Oxide Films. J. Ekectron Spectrosc. 2001, 120, 149−154. (41) Lin, S.; Jiang, X.; Wang, L.; Li, G.; Guo, L. Adsorption Orientation of Horse Heart Cytochrome C on a Bare Gold Electrode Hampers Its Electron Transfer. J. Phys. Chem. C 2011, 116, 637−642. (42) Hobara, D.; Niki, K.; Cotton, T. M. Effect of Surface Modifiers on the Electrode Reactions and Conformation of Cytochrome C3 Adsorbed on a Silver Electrode. Biospectroscopy 1998, 4, 161−170. (43) Hildebrandt, P.; Murgida, D. H. Electron Transfer Dynamics of Cytochrome C Bound to Self-Assembled Monolayers on Silver Electrodes. Bioelectrochemistry 2002, 55, 139−143. (44) Bain, C. D.; Troughton, E. B.; Tao, Y. T.; Evall, J.; Whitesides, G. M.; Nuzzo, R. G. Formation of Monolayer Films by the Spontaneous Assembly of Organic Thiols from Solution onto Gold. J. Am. Chem. Soc. 1989, 111, 321−335. (45) Papadopoulos, S.; Jürgens, K. D.; Gros, G. Protein Diffusion in Living Skeletal Muscle Fibers: Dependence on Protein Size, Fiber Type, and Contraction. Biophys. J. 2000, 79, 2084−2094. (46) Hirota, S.; Ueda, M.; Hayashi, Y.; Nagao, S.; Kamikubo, H.; Kataoka, M. Maintenance of the Secondary Structure of Horse Cytochrome C During the Conversion Process of Monomers to Oligomers by Addition of Ethanol. J. Biochem. 2012, 152, 521−529. (47) Khare, N.; Eggleston, C. M.; Lovelace, D. M.; Boese, S. W. Structural and Redox Properties of Mitochondrial Cytochrome C Co- sorbed with Phosphate on Hematite (A-Fe2O3) Surfaces. J. Colloid Interface Sci. 2006, 303, 404−414. (48) Chen, X.; Ferrigno, R.; Yang, J.; Whitesides, G. M. Redox Properties of Cytochrome C Adsorbed on Self-Assembled Mono- layers: A Probe for Protein Conformation and Orientation. Langmuir 2002, 18, 7009−7015. (49) Millo, D.; Ranieri, A.; Gross, P.; Ly, H. K.; Borsari, M.; Hildebrandt, P.; Wuite, G. J. L.; Gooijer, C.; Zwan, G. v. d. Electrochemical Response of Cytochrome C Immobilized on Smooth and Roughened Silver and Gold Surfaces Chemically Modified with 11-Mercaptounodecanoic Acid. J. Phys. Chem. C 2009, 113, 2861− 2866. (50) Adir, N.; Axelrod, H. L.; Beroza, P.; Isaacson, R. A.; Rongey, S. H.; Okamura, M. Y.; Feher, G. Co-Crystallization and Characterization of the Photosynthetic Reaction Center−Cytochrome C2 Complex from Rhodobacter Sphaeroides. Biochemistry 1996, 35, 2535−2547. (51) Moser, C. C.; Dutton, P. L. Cytochrome C and C2 Binding Dynamics and Electron Transfer with Photosynthetic Reaction Center Protein and Other Integral Membrane Redox Proteins. Biochemistry 1988, 27, 2450−2461. (52) Clark, R. A.; Bowden, E. F. Voltammetric Peak Broadening for Cytochrome C/Alkanethiolate Monolayer Structures: Dispersion of Formal Potentials. Langmuir 1997, 13, 559−565. (53) Prince, R. C.; Baccarini-Melandri, A.; Hauska, G. A.; Melandri, B. A.; Crofts, A. R. Asymmetry of an Energy Transducing Membrane. The Location of Cytochrome C2 in Rhodopseudomonas Spheroides and Rhodopseudomonas Capsulata. Biochim. Biophys. Acta, Bioenerg. 1975, 387, 212−227. (54) Rosen, D.; Okamura, M. Y.; Abresch, E. C.; Valkirs, G. E.; Feher, G. Interaction of Cytochrome C with Reaction Centers of Rhodopseudomonas Sphaeroides R-26: Localization of the Binding The Journal of Physical Chemistry C Article dx.doi.org/10.1021/jp507065u | J. Phys. Chem. C 2014, 118, 23509−2351823517
- 10. Site by Chemical Crosslinking and Immunochemical Studies. Biochemistry 1983, 22, 335−341. (55) Blankenship, R. E. Molecular Mechanisms of Photosynthesis; Blackwell Science: Oxford, U.K., 2002. (56) Davies, J. The Physics of Low-Dimensional Semiconductors; Cambridge University Press: New York, 2006. (57) Wei, J.; Liu, H.; Dick, A. R.; Yamamoto, H.; He, Y.; Waldeck, D. H. Direct Wiring of Cytochrome C’s Heme Unit to an Electrode: Electrochemical Studies. J. Am. Chem. Soc. 2002, 124, 9591−9599. (58) Dimonte, A.; Frache, S.; Erokhin, V.; Piccinini, G.; Demarchi, D.; Milano, F.; Micheli, G. D.; Carrara, S. Nanosized Optoelectronic Devices Based on Photoactivated Proteins. Biomacromolecules 2012, 13, 3503−3509. (59) Terasaki, N.; et al. Bio-Photosensor: Cyanobacterial Photo- system I Coupled with Transistor Via Molecular Wire. Biochim. Biophys. Acta, Bioenerg. 2007, 1767, 653−659. (60) Swainsbury, D. J. K.; Friebe, V. M.; Frese, R. N.; Jones, M. R. Evaluation of a Biohybrid Photoelectrochemical Cell Employing the Purple Bacterial Reaction Centre as a Biosensor for Herbicides. Biosens. Bioelectron. 2014, 58, 172−178. (61) LeBlanc, G.; Winter, K. M.; Crosby, W. B.; Jennings, G. K.; Clifffel, D. E. Integration of Photosystem I with Graphene Oxide for Photocurrent Enhancement. Adv. Energy Mater. 2014, 4, 1301953. (62) Kamran, M.; Delgado, J. D.; Friebe, V.; Aartsma, T. J.; Frese, R. N. Photosynthetic Protein Complexes as Bio-Photovoltaic Building Blocks Retaining a High Internal Quantum Efficiency. Biomacromo- lecules 2014, 15, 2833−2838. (63) Patil, A. V.; Premaruban, T.; Berthoumieu, O.; Watts, A.; Davis, J. J. Enhanced Photocurrent in Engineered Bacteriorhodopsin Monolayer. J. Phys. Chem. B 2011, 116, 683−689. (64) Prasad, M.; Roy, S. Optoelectronic Logic Gates Based on Photovoltaic Response of Bacteriorhodopsin Polymer Composite Thin Films. IEEE Trans. NanoBiosci. 2012, 11, 410−420. (65) Palazzo, G.; Magliulo, M.; Mallardi, A.; Angione, M. D.; Gobeljic, D.; Scamarcio, G.; Fratini, E.; Ridi, F.; Torsi, L. Electronic Transduction of Proton Translocations in Nanoassembled Lamellae of Bacteriorhodopsin. ACS Nano 2014, 8, 7834−7845. (66) Al-Aribe, K. M.; Knopf, G. K.; Bassi, A. S. In Organic Photovoltaic Cells Based on Photoactive Bacteriorhodopsin Proteins, 2013; pp 86150Q−86150Q-9. ■ NOTE ADDED AFTER ASAP PUBLICATION Due to a production error, this paper was published on the Web on October 2, 2014, with none of the author corrections implemented. The corrected version was reposted on October 3, 2014. The Journal of Physical Chemistry C Article dx.doi.org/10.1021/jp507065u | J. Phys. Chem. C 2014, 118, 23509−2351823518