2020.01.06 BMO New Pacific Report
•
0 gefällt mir•74 views

2020.01.06 BMO New Pacific Report

Empfohlen
Weitere ähnliche Inhalte
Mehr von Hindenburg Research
Mehr von Hindenburg Research (20)
Kürzlich hochgeladen
Kürzlich hochgeladen (20)
2020.01.06 BMO New Pacific Report
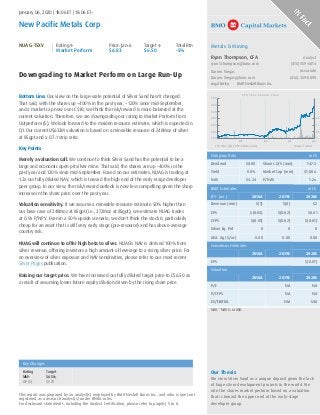
- 1. Key Changes Rating Target Mkt $6.50 OP (S) $5.75 Our Thesis We view Silver Sand as a unique deposit given the lack of large silver development projects in the world. We rate the shares market perform based on a valuation that is toward the upper end of the early-stage developer group. Downgrading to Market Perform on Large Run-Up Bottom Line: Our view on the large-scale potential of Silver Sand hasn't changed. That said, with the shares up ~400% in the past year, ~120% since mid-September, and a market cap now over C$1B, we think the risk/reward is more balanced at the current valuation. Therefore, we are downgrading our rating to Market Perform from Outperform (S). We look forward to the maiden resource estimate, which is expected in Q1. Our current U$633M valuation is based on a mineable resource of 248Moz of silver at 85gpt and a 0.7:1 strip ratio. Key Points Merely a valuation call. We continue to think Silver Sand has the potential to be a large and economic open pit silver mine. That said, the shares are up ~400% in the past year and 120% since mid-September. Based on our estimates, NUAG is trading at 1.2x our fully diluted NAV, which is toward the high end of the early-stage developer peer group. In our view, the risk/reward outlook is now less compelling given the sharp increase in the share price over the past year. Valuation sensitivity. If we assume a mineable resource estimate 50% higher than our base case of 248Moz at 85gpt (i.e., 372Moz at 85gpt), we estimate NUAG trades at 0.9x P/NPV. Even in a 50% upside scenario, we don't think the stock is particularly cheap for an asset that is still very early stage (pre-resource) and has above-average country risk. NUAG will continue to offer high beta to silver. NUAG's NAV is derived 100% from silver revenue, offering investors a high amount of leverage to a rising silver price. For an overview of silver exposure and NAV sensitivities, please refer to our most recent Silver Pages publication. Raising our target price. We have increased our fully diluted target price to C$6.50 as a result of assuming lower future equity dilution driven by the rising share price. January 06, 2020 | 18:06 ET | 18:06 ET~ New Pacific Metals Corp NUAG-TSXV Rating Market Perform Price: Jan-6 $6.83 Target $6.50 Total Rtn -5% Metals & Mining Ryan Thompson, CFA Analyst ryan1.thompson@bmo.com (416) 359-6814 Darren Viegas Associate Darren.Viegas@bmo.com (416) 359-8090 Legal Entity: BMO Nesbitt Burns Inc. 7.00 6.00 5.00 4.00 3.00 2.00 1.00 JanJulJanJul 1.5 1 0.5 0 LHS: Price (C$) / RHS: Volume (mm) Source: FactSet 2YR Price Volume Chart Company Data in C$ Dividend $0.00 Yield 0.0% NAV $4.24 Shares O/S (mm) 147.3 Market Cap (mm) $1,006 P/NAV 1.2x BMO Estimates in C$ (FY- Jun .) 2018A 2019E 2020E Revenue (mm) $(1) $(0) $2 EPS $(0.03) $(0.02) $0.01 CFPS $(0.01) $(0.02) $(0.01) Silver Eq. Prd 0 0 0 AISC Ag ($/oz) 0.00 0.00 0.00 Consensus Estimates 2018A 2019E 2020E EPS $(0.01) Valuation 2018A 2019E 2020E P/E NA NA P/CFPS NA NA EV/EBITDA NM NM NAV: *NAV is in USD This report was prepared by an analyst(s) employed by BMO Nesbitt Burns Inc., and who is (are) not registered as a research analyst(s) under FINRA rules. For disclosure statements, including the Analyst Certification, please refer to page(s) 5 to 8.
- 2. New Pacific Metals Corp - Block Summary Model Income Statement 2018A 2019E 2020E Revenue $(1) $(0) $2 Operating Costs 0 0 0 SG&A 0 0 0 EBITDA $(4) $(3) $(0) Depreciation 0 0 0 Tax (1) (1) (1) Adjusted Net Earnings (4) (2) 1 EPS $(0.03) $(0.02) $0.01 Cash Flow Statement 2018A 2019E 2020E Cash Flow From Operations (1) (3) (1) Cash Flow From Investments (59) (4) (4) Cash Flow From Financing 72 20 16 Free Cash Flow (8) (14) (12) FCF/Share $(0.06) $(0.11) $(0.08) Balance Sheet 2018A 2019E 2020E Cash & Equivalents 15 28 39 Short-term debt 0 0 0 Long-Term Debt 0 0 0 Total Assets 105 124 142 Total Liabilities 2 2 2 Total Shareholders' Equity 103 122 140 Attrib. Production & Cash Costs 2018A 2019E 2020E Silver Sands - Silver Prodn (koz) 0 0 0 Silver Sands - AISC (US$/oz) 0.00 0.00 0.00 Total Silver Prodn (koz) 0 0 0 Total Gold Prodn (koz) 0 0 0 Total Silver Equiv Prodn (koz) 0 0 0 Avg AISC Silver (US$/oz) 0.00 0.00 0.00 Price Assumptions 2018A 2019E 2020E Gold Price (US$/oz) 1,297 1,263 1,491 Silver Price (US$/oz) 16.72 15.00 17.55 Lead Price (US$/lb) 1.10 0.90 0.89 Zinc Price (US$/lb) 1.44 1.20 1.06 USD:MXN 18.729 19.273 19.241 Source: BMO Capital Markets, Company Reports Valuation Our C$6.50 target price is based on a 100% weighting given to a 1.2x P/NAV multiple. Our multiple reflects: the scarcity value of large, potentially economic silver deposits; Silver Sand is still in its early stages with several de-risking activities ahead of it; Silver Sand is not yet financed; and some investors may have a reluctance to invest in Bolivia. Upside Scenario $10.00 Our upside scenario is based on a 1.7x P/NPV multiple. This scenario could play out in a rising silver price environment, coupled with further advancement of the project (resource estimate, PEA) and eventual production. Downside Scenario $2.00 Our downside scenario is based on a 0.3x P/NPV multiple. This scenario could happen in a falling silver price environment or if the company delivers a lower-than- expected resource. The shares would also be pressured if the company fails to expand the land package because of the MPC agreement not being ratified into law. -71% +46%-5% Target Price 6.50 in CAD Current Price 6.83 Downside Scenario 2.00 Upside Scenario 10.00 Key Catalysts Drilling results (ongoing); a resource estimate in Q1/20; a PEA later in 2020; ratification of the MPC into law Company Description New Pacific Metals is a precious metals developer currently progressing the Silver Sand Project in Bolivia. NUAG-TSXV Research Glossary Company Models New Pacific Metals Corp | Page 2 January 6, 2020
- 3. Exhibit 1: NUAG Block Model at BMO Metal Price Assumptions New Pacific Metals NUAG CASH FLOW ANALYSIS - C$M (June Year End) 2018A 2019A 2020E 2021E 2022E Recommendation Mkt Analyst RT Cash Flows From Operating Activities Net Income (4.1) (2.6) 0.8 2.2 (2.1) As at 6-Jan-20 BMO Capital Markets Non-Cash Items 2.0 0.3 (2.1) (0.6) (1.8) Re-invested in Working Capital 1.3 (0.3) 0.3 0.0 0.0 Year End June $6.83 US$/share Share Price $6.83 C$/share $5.26 US$/share Cash Flows From Investing Activities Property and Business Activities 0.0 0.6 5.2 0.0 0.0 Target Price $6.50 C$/share $5.01 US$/share Acq.of Property, Plant and Equip. (6.9) (11.7) (11.2) (7.8) (429.9) Net Present Value 5% $5.50 C$/share $4.24 US$/share Other (52.5) 6.8 1.7 0.0 0.0 0% $9.03 C$/share $6.96 US$/share Cash Flows From Financing Activities Market Cap 973.5 C$M 750.4 US$M Proceeds From Borrowings 0.0 0.0 0.0 150.0 200.0 Ordinary Shares 142.6 M Repayment of Borrowings 0.0 0.0 0.0 0.0 0.0 Options & Warrants 5.6 M Other 71.6 20.1 16.1 300.0 0.9 Net Increase In Cash Held 10.1 13.2 10.9 443.7 (232.9) Cash At Beginning of Year 3.8 14.6 27.8 38.7 482.4 PRICE ASSUMPTIONS - BMO PRICES Cash At End of Year 14.6 27.9 38.7 482.4 249.5 (June Year End) 2018A 2019A 2020E 2021E 2022E Exchange Rate USD/BOB 6.91 6.91 6.91 6.91 6.91 Exchange Rate CAD/USD 0.79 0.76 0.76 0.77 0.78 BALANCE SHEET ANALYSIS - C$M Gold US$/oz 1,297 1,263 1,491 1,475 1,413 (June Year End) 2018A 2019A 2020E 2021E 2022E Silver US$/oz 16.72 15.00 17.55 18.30 17.26 Copper US$/lb 3.06 2.79 2.74 2.90 2.74 Current Assets Zinc US$/lb 1.44 1.20 1.06 1.02 1.07 Cash and Cash Equivalents 14.6 27.8 38.7 482.4 249.5 Oil US$/bbl 58.25 60.73 54.97 56.73 59.37 Other 18.4 11.3 9.5 9.5 9.5 Non-Current Assets Investments 5.8 5.1 2.1 2.1 2.1 FINANCIAL SUMMARY Fixed Assets 65.2 78.1 89.7 97.5 527.4 (June Year End) 2018A 2019A 2020E 2021E 2022E Other 33.7 41.0 50.6 494.3 261.4 NPAT (pre-Abs) (C$M) (3.5) (2.2) 0.9 2.2 (2.1) Current Liabilities ADJUSTED EPS (C$/share) (0.03) (0.02) 0.01 0.01 (0.01) Borrowings 0.0 0.0 0.0 0.0 0.0 PER (x) na na na na na Creditors 1.8 2.0 2.6 2.6 2.6 EBITDA (C$M) -4.1 -2.6 -0.4 -3.0 -3.1 Other 0.0 0.1 0.1 0.1 0.1 EBITDA/share (C$/share) (0.03) (0.02) (0.00) (0.02) (0.02) EV/EBITDA (x) -211.8x -359.5x -2,350x -339.7x -480.8x Non-Current Liabilities Cash Flow (C$M) -0.8 -2.5 -1.0 1.5 -3.9 Borrowings 0.0 0.3 0.0 150.0 350.0 Cash Flow/share (C$/share) (0.01) (0.02) (0.01) 0.01 (0.02) Other 1.9 2.1 2.5 1.9 0.9 P/Cash Flow (x) na na na na na Dividend (C$/share) 0.00 0.00 0.00 0.00 0.00 Shareholders Funds 102.8 121.9 139.8 442.0 439.9 Ordinary Shares (M) 122.1 134.0 145.3 177.3 196.4 Net Debt to Equity -14.2% -22.6% -27.7% -75.2% 22.8% 0% 5% PROFIT AND LOSS STATEMENT - C$M PROJECT NPV NPV SILVER EQ. PRODUCTION (koz) (June Year End) 2018A 2019A 2020E 2021E 2022E US$M US$M 2018A 2019A 2020E 2021E 2022E SILVER SAND (BOLIVIA) 1,187.8 632.7 0 0 0 0 0 Sales Revenue 0.0 0.0 0.0 0.0 0.0 Other Revenue (1.1) (0.0) 2.2 0.0 0.0 Operating Costs 0.0 0.0 0.0 0.0 0.0 Depreciation (0.0) (0.0) (0.0) 0.0 0.0 Interest 0.0 0.0 0.0 (4.1) (18.0) Exploration 0.0 0.0 0.0 (0.8) (0.8) Total Silver Eq. Production 0 0 0 0 0 Corporate (0.3) (0.3) (0.1) 0.0 0.0 Total Silver Eq. Sales 0 0 0 0 0 Other Costs (1.9) (2.0) (2.3) 1.8 15.7 Operating Profit Before Tax (3.3) (2.4) (0.2) (3.0) (3.1) Exploration Credit 0.0 0.0 Income Tax 0.0 0.0 0.5 2.1 6.3 Hedge Book 0.0 0.0 Operating Profit After Tax (3.3) (2.4) 0.3 (0.9) 3.3 Corporate (72.5) (64.9) Minorities 0.0 0.2 0.0 0.0 0.0 Net Cash 38.2 38.2 Net Profit After Tax (3.5) (2.2) 0.9 2.2 (2.1) Investments/Bullion 0.0 0.0 Abnormals (0.9) (0.3) (0.2) 0.0 0.0 Future Equity Financing 248.4 248.4 Tax on Abnormals (0.3) (0.1) (0.1) 0.0 0.0 Total NPV 1,401.8 854.3 Reported Profit (4.1) (2.4) 0.8 2.2 (2.1) Per Share $6.96 $4.24 IRR = 3.4% P/NPV 1.2x New Pacific Metals 2018A 2019A 2020E 2021E 2022E Co-Product Cash Cost (US$/oz) 2018A 2019A 2020E 2021E 2022E Cash Operating Costs US$/oz 0.00 0.00 0.00 0.00 0.00 SILVER SAND (BOLIVIA) 0.00 0.00 0.00 0.00 0.00 Total Cash Costs US$/oz 0.00 0.00 0.00 0.00 0.00 All-In-Sustaining-Costs US$/oz 0.00 0.00 0.00 0.00 0.00 All-In-Costs US$/oz 0.00 0.00 0.00 0.00 0.00 EBIT to Total Assets -2.4% -1.5% -0.1% -0.3% -0.3% NPAT to Shareholders Equity -4.0% -2.0% 0.5% 0.5% -0.5% QUARTERLY SUMMARY Q1/20A Q2/20A Q3/20A Q4/20E ADJUSTED EPS (US$/sh) 0.01 0.00 0.00 0.00 CFPS (US$/sh) 0.00 0.00 0.00 0.00 FCFPS (US$/sh) -0.04 -0.02 -0.02 -0.01 Source: BMO Capital Markets New Pacific Metals Corp | Page 3 January 6, 2020
- 4. Exhibit 2: NUAG Block Model at Spot Metal Prices New Pacific Metals NUAG CASH FLOW ANALYSIS - C$M (June Year End) 2018A 2019A 2020E 2021E 2022E Recommendation Mkt Analyst RT Cash Flows From Operating Activities Net Income (4.1) (2.6) 0.8 2.2 (2.1) As at 6-Jan-20 BMO Capital Markets Non-Cash Items 2.0 0.3 (2.1) (0.6) (1.9) Re-invested in Working Capital 1.3 (0.3) 0.3 0.0 0.0 Year End June $6.83 US$/share Share Price $6.83 C$/share $5.26 US$/share Cash Flows From Investing Activities Property and Business Activities 0.0 0.6 5.2 0.0 0.0 Target Price $6.50 C$/share $5.01 US$/share Acq.of Property, Plant and Equip. (6.9) (11.7) (11.1) (7.8) (432.5) Net Present Value 5% $6.19 C$/share $4.77 US$/share Other (52.5) 6.8 1.7 0.0 0.0 0% $10.09 C$/share $7.77 US$/share Cash Flows From Financing Activities Market Cap 973.5 C$M 750.4 US$M Proceeds From Borrowings 0.0 0.0 0.0 150.0 200.0 Ordinary Shares 142.6 M Repayment of Borrowings 0.0 0.0 0.0 0.0 0.0 Options & Warrants 5.6 M Other 71.6 20.1 16.1 300.0 0.9 Net Increase In Cash Held 10.1 13.2 11.0 443.8 (235.6) Cash At Beginning of Year 3.8 14.6 27.8 38.8 482.6 PRICE ASSUMPTIONS - SPOT PRICES Cash At End of Year 14.6 27.9 38.8 482.6 247.0 (June Year End) 2018A 2019A 2020E 2021E 2022E Exchange Rate USD/BOB 6.91 6.91 6.91 6.91 6.91 Exchange Rate CAD/USD 0.79 0.76 0.77 0.77 0.77 BALANCE SHEET ANALYSIS - C$M Gold US$/oz 1,297 1,263 1,543 1,566 1,566 (June Year End) 2018A 2019A 2020E 2021E 2022E Silver US$/oz 16.72 15.00 17.86 18.15 18.15 Copper US$/lb 3.06 2.79 2.73 2.76 2.76 Current Assets Zinc US$/lb 1.44 1.20 1.04 1.04 1.04 Cash and Cash Equivalents 14.6 27.8 38.8 482.6 247.0 Oil US$/bbl 58.25 60.73 61.35 63.03 63.03 Other 18.4 11.3 9.5 9.5 9.5 Non-Current Assets Investments 5.8 5.1 2.1 2.1 2.1 FINANCIAL SUMMARY Fixed Assets 65.2 78.1 89.6 97.4 529.8 (June Year End) 2018A 2019A 2020E 2021E 2022E Other 33.7 41.0 50.7 494.5 258.9 NPAT (pre-Abs) (C$M) (3.5) (2.2) 0.9 2.2 (2.1) Current Liabilities ADJUSTED EPS (C$/share) (0.03) (0.02) 0.01 0.01 (0.01) Borrowings 0.0 0.0 0.0 0.0 0.0 PER (x) na na na na na Creditors 1.8 2.0 2.6 2.6 2.6 EBITDA (C$M) -4.1 -2.6 -0.4 -3.0 -3.1 Other 0.0 0.1 0.1 0.1 0.1 EBITDA/share (C$/share) (0.03) (0.02) (0.00) (0.02) (0.02) EV/EBITDA (x) -211.8x -359.5x -2,349x -339.9x -480.9x Non-Current Liabilities Cash Flow (C$M) -0.8 -2.5 -1.0 1.5 -4.0 Borrowings 0.0 0.3 0.0 150.0 350.0 Cash Flow/share (C$/share) (0.01) (0.02) (0.01) 0.01 (0.02) Other 1.9 2.1 2.5 1.9 0.9 P/Cash Flow (x) na na na na na Dividend (C$/share) 0.00 0.00 0.00 0.00 0.00 Shareholders Funds 102.8 121.9 139.8 442.0 439.9 Ordinary Shares (M) 122.1 134.0 145.3 177.3 196.4 Net Debt to Equity -14.2% -22.6% -27.8% -75.2% 23.4% 0% 5% PROFIT AND LOSS STATEMENT - C$M PROJECT NPV NPV SILVER EQ. PRODUCTION (koz) (June Year End) 2018A 2019A 2020E 2021E 2022E US$M US$M 2018A 2019A 2020E 2021E 2022E SILVER SAND (BOLIVIA) 1,340.3 731.7 0 0 0 0 0 Sales Revenue 0.0 0.0 0.0 0.0 0.0 Other Revenue (1.1) (0.0) 2.2 0.0 0.0 Operating Costs 0.0 0.0 0.0 0.0 0.0 Depreciation (0.0) (0.0) (0.0) 0.0 0.0 Interest 0.0 0.0 0.0 (4.1) (18.0) Exploration 0.0 0.0 0.0 (0.8) (0.8) Total Silver Eq. Production 0 0 0 0 0 Corporate (0.3) (0.3) (0.1) 0.0 0.0 Total Silver Eq. Sales 0 0 0 0 0 Other Costs (1.9) (2.0) (2.3) 1.8 15.7 Operating Profit Before Tax (3.3) (2.4) (0.2) (3.0) (3.1) Exploration Credit 0.0 0.0 Income Tax 0.0 0.0 0.5 2.1 6.3 Hedge Book 0.0 0.0 Operating Profit After Tax (3.3) (2.4) 0.3 (0.9) 3.3 Corporate (62.6) (58.8) Minorities 0.0 0.2 0.0 0.0 0.0 Net Cash 38.2 38.2 Net Profit After Tax (3.5) (2.2) 0.9 2.2 (2.1) Investments/Bullion 0.0 0.0 Abnormals (0.9) (0.3) (0.2) 0.0 0.0 Future Equity Financing 249.4 249.4 Tax on Abnormals (0.3) (0.1) (0.1) 0.0 0.0 Total NPV 1,565.3 960.5 Reported Profit (4.1) (2.4) 0.8 2.2 (2.1) Per Share $7.77 $4.77 IRR = 4.6% P/NPV 1.1x New Pacific Metals 2018A 2019A 2020E 2021E 2022E Co-Product Cash Cost (US$/oz) 2018A 2019A 2020E 2021E 2022E Cash Operating Costs US$/oz 0.00 0.00 0.00 0.00 0.00 SILVER SAND (BOLIVIA) 0.00 0.00 0.00 0.00 0.00 Total Cash Costs US$/oz 0.00 0.00 0.00 0.00 0.00 All-In-Sustaining-Costs US$/oz 0.00 0.00 0.00 0.00 0.00 All-In-Costs US$/oz 0.00 0.00 0.00 0.00 0.00 EBIT to Total Assets -2.4% -1.5% -0.1% -0.3% -0.3% NPAT to Shareholders Equity -4.0% -2.0% 0.5% 0.5% -0.5% QUARTERLY SUMMARY Q1/20A Q2/20A Q3/20A Q4/20E ADJUSTED EPS (US$/sh) 0.01 0.00 0.00 0.00 CFPS (US$/sh) 0.00 0.00 0.00 0.00 FCFPS (US$/sh) -0.04 -0.02 -0.01 -0.01 Source: BMO Capital Markets New Pacific Metals Corp | Page 4 January 6, 2020
- 5. New Pacific M etals Corp Rating History as of 01/03/2020 C$7 C$6 C$5 C$4 C$3 C$2 C$1 C$0 Apr 2017 Jul 2017 Oct 2017 Jan 2018 Apr 2018 Jul 2018 Oct 2018 Jan 2019 Apr 2019 Jul 2019 Oct 2019 Jan 2020 I:OP:C$3.75 08/13/2019 OP:C$5.50 10/25/2019 OP:C$5.75 12/18/2019 Closing Price Target Price Outperform (OP); Market Perform (Mkt); Underperform (Und); Speculative (S); Suspended (Spd); Not Rated (NR); Restricted (R) Source: FactSet, BMO Capital Markets IMPORTANT DISCLOSURES Analyst's Certification I, Ryan Thompson, hereby certify that the views expressed in this report accurately reflect my personal views about the subject securities or issuers. I also certify that no part of my compensation was, is, or will be, directly or indirectly, related to the specific recommendations or views expressed in this report. Analysts who prepared this report are compensated based upon (among other factors) the overall profitability of BMO Capital Markets and their affiliates, which includes the overall profitability of investment banking services. Compensation for research is based on effectiveness in generating new ideas and in communication of ideas to clients, performance of recommendations, accuracy of earnings estimates, and service to clients. Analysts employed by BMO Nesbitt Burns Inc. and/or BMO Capital Markets Limited are not registered as research analysts with FINRA. These analysts may not be associated persons of BMO Capital Markets Corp. and therefore may not be subject to the FINRA Rule 2241 restrictions on communications with a subject company, public appearances and trading securities held by a research analyst account. Company Specific Disclosures Disclosure 1: BMO Capital Markets has undertaken an underwriting liability with respect to New Pacific Metals Corp within the past 12 months. Disclosure 2: BMO Capital Markets has provided investment banking services with respect to New Pacific Metals Corp within the past 12 months. Disclosure 3: BMO Capital Markets has managed or co-managed a public offering of securities with respect to New Pacific Metals Corp within the past 12 months. Disclosure 4: BMO Capital Markets or an affiliate has received compensation for investment banking services from New Pacific Metals Corp within the past 12 months. Disclosure 6A: New Pacific Metals Corp is a client (or was a client) of BMO Nesbitt Burns Inc., BMO Capital Markets Corp., BMO Capital Markets Limited or an affiliate within the past 12 months: A) Investment Banking Services Disclosure 16: A research analyst has extensively viewed the material operations of New Pacific Metals Corp. Disclosure 17: New Pacific Metals Corp has paid or reimbursed some or all of the research analyst's travel expenses. Methodology and Risks to Target Price/Valuation for New Pacific Metals Corp (NUAG-TSXV) Methodology: Price targets for precious metals developers are set using a 100% weighting assigned to a P/NAV multiple. Risks: Risks to the BMO Research target price include commodity/currency, technical/operating, and litigation/political risks inherent in mining operations, as well as feasibility, permitting, and financing risks related to the development of growth projects. Distribution of Ratings (January 05, 2020) Rating category BMO rating BMOCM US Universe* BMOCM US IB Clients** BMOCM US IB Clients*** BMOCM Universe**** BMOCM IB Clients***** StarMine Universe~ Buy Outperform 45.3 % 23.8 % 55.3 % 47.6 % 57.3 % 57.7% Hold Market Perform 50.6 % 16.4 % 42.7 % 49.1 % 41.9 % 37.5% Sell Underperform 4.2 % 9.1 % 1.9 % 3.2 % 0.8 % 4.8% * Reflects rating distribution of all companies covered by BMO Capital Markets Corp. equity research analysts. New Pacific Metals Corp | Page 5 January 6, 2020
- 6. ** Reflects rating distribution of all companies from which BMO Capital Markets Corp. has received compensation for Investment Banking services as percentage within ratings category. *** Reflects rating distribution of all companies from which BMO Capital Markets Corp. has received compensation for Investment Banking services as percentage of Investment Banking clients. **** Reflects rating distribution of all companies covered by BMO Capital Markets equity research analysts. ***** Reflects rating distribution of all companies from which BMO Capital Markets has received compensation for Investment Banking services as percentage of Investment Banking clients. ~ As of April 1, 2019. Ratings Key (as of October 2016) We use the following ratings system definitions: OP = Outperform - Forecast to outperform the analyst’s coverage universe on a total return basis; Mkt = Market Perform - Forecast to perform roughly in line with the analyst’s coverage universe on a total return basis; Und = Underperform - Forecast to underperform the analyst’s coverage universe on a total return basis; (S) = Speculative investment; Spd = Suspended - Coverage and rating suspended until coverage is reinstated; NR = No Rated - No rating at this time; and R = Restricted - Dissemination of research is currently restricted. BMO Capital Markets' seven Top 15 lists guide investors to our best ideas according to different objectives (CDN Large Cap, CDN Small Cap, US Large Cap, US Small Cap, Income, CDN Quant, and US Quant have replaced the Top Pick rating). Prior BMO Capital Markets Rating System (April 2013 - October 2016) http://researchglobal.bmocapitalmarkets.com/documents/2013/rating_key_2013_to_2016.pdf (January 2010 - April 2013) http://researchglobal.bmocapitalmarkets.com/documents/2013/prior_rating_system.pdf Other Important Disclosures For Important Disclosures on the stocks discussed in this report, please go to https://researchglobal0.bmocapitalmarkets.com/public-disclosure/ or write to Editorial Department, BMO Capital Markets, 3 Times Square, New York, NY 10036 or Editorial Department, BMO Capital Markets, 1 First Canadian Place, Toronto, Ontario, M5X 1H3. Dissemination of Research Dissemination of BMO Capital Markets Equity Research is available via our website https://researchglobal0.bmocapitalmarkets.com/ Institutional clients may also receive our research via Thomson Reuters, Bloomberg, FactSet, and Capital IQ. Research reports and other commentary are required to be simultaneously disseminated internally and externally to our clients. Research coverage of licensed cannabis producers and other cannabis-related companies is made available only to eligible approved North American, Australian, and EU-based BMO Nesbitt Burns Inc., BMO Capital Markets Limited, and BMO Capital Markets Corp. clients via email, our website and select third party platforms. ~ Research distribution and approval times are provided on the cover of each report. Times are approximations as system and distribution processes are not exact and can vary based on the sender and recipients’ services. Unless otherwise noted, times are Eastern Standard and when two times are provided, the approval time precedes the distribution time. BMO Capital Markets may use proprietary models in the preparation of reports. Material information about such models may be obtained by contacting the research analyst directly. There is no planned frequency of updates to this report. For recommendations disseminated during the preceding 12-month period, please visit: https://researchglobal0.bmocapitalmarkets.com/public- disclosure/. General Disclaimer "BMO Capital Markets" is a trade name used by the BMO Investment Banking Group, which includes the wholesale arm of Bank of Montreal and its subsidiaries BMO Nesbitt Burns Inc., BMO Capital Markets Limited in the U.K., Bank of Montreal Europe Plc in Ireland and BMO Capital Markets Corp. in the U.S. BMO Nesbitt Burns Inc., BMO Capital Markets Limited, Bank of Montreal Europe Plc and BMO Capital Markets Corp are affiliates. Bank of Montreal or its subsidiaries ("BMO Financial Group") has lending arrangements with, or provide other remunerated services to, many issuers covered by BMO Capital Markets. The opinions, estimates and projections contained in this report are those of BMO Capital Markets as of the date of this report and are subject to change without notice. BMO Capital Markets endeavours to ensure that the contents have been compiled or derived from sources that we believe are reliable and contain information and opinions that are accurate and complete. However, BMO Capital Markets makes no representation or warranty, express or implied, in respect thereof, takes no responsibility for any errors and omissions contained herein and accepts no liability whatsoever for any loss arising from any use of, or reliance on, this report or its contents. Information may be available to BMO Capital Markets or its affiliates that is not reflected in this report. The information in this report is not intended to be used as the primary basis of investment decisions, and because of individual client objectives, should not be construed as advice designed to meet the particular investment needs of any investor. Nothing herein constitutes any investment, legal, tax or other New Pacific Metals Corp | Page 6 January 6, 2020
- 7. advice nor is it to be relied on in any investment or decision. If you are in doubt about any of the contents of this document, the reader should obtain independent professional advice. This material is for information purposes only and is not an offer to sell or the solicitation of an offer to buy any security. BMO Capital Markets or its affiliates will buy from or sell to customers the securities of issuers mentioned in this report on a principal basis. BMO Capital Markets or its affiliates, officers, directors or employees have a long or short position in many of the securities discussed herein, related securities or in options, futures or other derivative instruments based thereon. The reader should assume that BMO Capital Markets or its affiliates may have a conflict of interest and should not rely solely on this report in evaluating whether or not to buy or sell securities of issuers discussed herein. Additional Matters This report is directed only at entities or persons in jurisdictions or countries where access to and use of the information is not contrary to local laws or regulations. Its contents have not been reviewed by any regulatory authority. BMO Capital Markets does not represent that this report may be lawfully distributed or that any financial products may be lawfully offered or dealt with, in compliance with regulatory requirements in other jurisdictions, or pursuant to an exemption available thereunder. To Australian residents: BMO Capital Markets Limited is exempt from the requirement to hold an Australian financial services licence under the Corporations Act and is regulated by the UK Financial Conduct Authority under UK laws, which differ from Australian laws. This document is only intended for wholesale clients (as defined in the Corporations Act 2001) and Eligible Counterparties or Professional Clients (as defined in Annex II to MiFID II). To Canadian Residents: BMO Nesbitt Burns Inc. furnishes this report to Canadian residents and accepts responsibility for the contents herein subject to the terms set out above. Any Canadian person wishing to effect transactions in any of the securities included in this report should do so through BMO Nesbitt Burns Inc. The following applies if this research was prepared in whole or in part by Colin Hamilton, Alexander Pearce, David Round or Edward Sterck: This research is not prepared subject to Canadian disclosure requirements. This research is prepared by BMO Capital Markets Limited and distributed by BMO Capital Markets Limited or Bank of Montreal Europe Plc and is subject to the regulations of the Financial Conduct Authority (FCA) in the United Kingdom and the Central Bank of Ireland (CBI) in Ireland. FCA and CBI regulations require that a firm providing research disclose its ownership interest in the issuer that is the subject of the research if it and its affiliates own 5% or more of the equity of the issuer. Canadian regulations require that a firm providing research disclose its ownership interest in the issuer that is the subject of the research if it and its affiliates own 1% or more of the equity of the issuer that is the subject of the research. Therefore each of BMO Capital Markets Limited and Bank of Montreal Europe Plc will disclose its and its affiliates’ ownership interest in the subject issuer only if such ownership exceeds 5% of the equity of the issuer. To E.U. Residents: In an E.U. Member State this document is issued and distributed by Bank of Montreal Europe plc which is authorised and regulated in Ireland and operates in the E.U. on a passported basis. This document is only intended for Eligible Counterparties or Professional Clients, as defined in Annex II to “Markets in Financial Instruments Directive” 2014/65/EU (“MiFID II”). Singapore: This disclaimer applies to research reports distributed by the Private Banking unit of Bank of Montreal, Singapore Branch ("BMO SG"), an exempt financial adviser under the Financial Advisers Act (Cap. 110) of Singapore ("FAA") only. This research report is prepared by BMO Capital Markets and distributed by BMO SG pursuant to an arrangement under regulation 32C of the Financial Advisers Regulations of Singapore. This research report is distributed by BMO SG solely to persons who qualify as accredited investors as defined in the FAA only, and is not intended for and may not be circulated to the general public. This report and any information contained in this report shall not be disclosed to any other person. If you are not an accredited investor, please disregard this report. BMO SG does not accept legal responsibility for the contents of the report. Recipients should contact BMO SG at 65-6535 2323 for matters arising from, or in connection with the report. To U.S. Residents: BMO Capital Markets Corp. furnishes this report to U.S. residents and accepts responsibility for the contents herein, except to the extent that it refers to securities of Bank of Montreal. Any U.S. person wishing to effect transactions in any security discussed herein should do so through BMO Capital Markets Corp. To U.K. Residents: In the UK this document is published by BMO Capital Markets Limited which is authorised and regulated by the Financial Conduct Authority. The contents hereof are intended solely for the use of, and may only be issued or passed on to, (I) persons who have professional experience in matters relating to investments falling within Article 19(5) of the Financial Services and Markets Act 2000 (Financial Promotion) Order 2005 (the "Order") or (II) high net worth entities falling within Article 49(2)(a) to (d) of the Order (all such persons together referred to as "relevant persons"). The contents hereof are not intended for the use of and may not be issued or passed on to retail clients. To Israeli residents: BMO Capital Markets is not licensed under the Israeli Law for the Regulation of Investment Advice, Investment Marketing and Portfolio Management of 1995 (the "Advice Law") nor does it carry insurance as required thereunder. This document is to be distributed solely to persons that are qualified clients (as defined under the Advice Law) and qualified investors under the Israeli Securities Law of 1968. This document represents the analysis of the analyst but there is no assurance that any assumption or estimation will materialize. These documents are provided to you on the express understanding that they must be held in complete confidence and not republished, retransmitted, distributed, disclosed, or otherwise made available, in whole or in part, directly or indirectly, in hard or soft copy, through any means, to any person, except with the prior written consent of BMO Capital Markets. Click here for data vendor disclosures when referenced within a BMO Capital Markets research document. New Pacific Metals Corp | Page 7 January 6, 2020
- 8. ADDITIONAL INFORMATION IS AVAILABLE UPON REQUEST BMO Financial Group (NYSE, TSX: BMO) is an integrated financial services provider offering a range of retail banking, wealth management, and investment and corporate banking products. BMO serves Canadian retail clients through BMO Bank of Montreal and BMO Nesbitt Burns. In the United States, personal and commercial banking clients are served by BMO Harris Bank N.A., (Member FDIC). Investment and corporate banking services are provided in Canada and the US through BMO Capital Markets. BMO Capital Markets is a trade name used by BMO Financial Group for the wholesale banking businesses of Bank of Montreal, BMO Harris Bank N.A, (Member FDIC), Bank of Montreal Europe Plc, and Bank of Montreal (China) Co. Ltd. and the institutional broker dealer businesses of BMO Capital Markets Corp. (Member FINRA and SIPC) in the U.S., BMO Nesbitt Burns Inc. (Member Canadian Investor Protection Fund) in Canada, Europe and Asia, Bank of Montreal Europe Plc in Europe, BMO Capital Markets Limited in the U.K. and Australia and BMO Advisors Private Limited in India. “Nesbitt Burns” is a registered trademark of BMO Nesbitt Burns Corporation Limited, used under license. “BMO Capital Markets” is a trademark of Bank of Montreal, used under license. "BMO (M-Bar roundel symbol)" is a registered trademark of Bank of Montreal, used under license. ® Registered trademark of Bank of Montreal in the United States, Canada and elsewhere. TM Trademark Bank of Montreal ©COPYRIGHT 2020 BMO CAPITAL MARKETS CORP. A member of New Pacific Metals Corp | Page 8 January 6, 2020