1. Eco 4100
ProfessorLarryHuckins
HenryNoyes
Carboncap andtrade program
The market can reduce carbon-dioxideemissions,whilepromoting innovationinrenewable
energysources. Greenhouse gasemissionsare adomesticandglobal issue,andthe answertoboth
problems isthrougha marketcap-and-trade program.The questionis implementationand whois
responsible forthe greenhouse gasemissions.
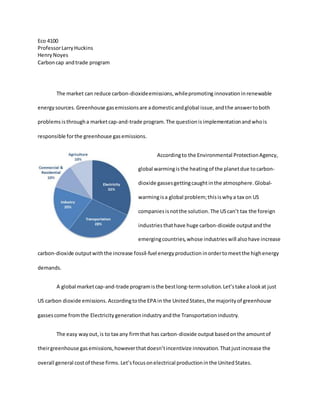
Accordingto the Environmental ProtectionAgency,
global warmingisthe heatingof the planetdue tocarbon-
dioxide gassesgettingcaught inthe atmosphere.Global-
warmingisa global problem;thisiswhya tax on US
companiesisnotthe solution.The UScan’t tax the foreign
industries thathave huge carbon-dioxide outputandthe
emergingcountries,whose industrieswill also have increase
carbon-dioxide outputwiththe increase fossil-fuel energyproduction inordertomeetthe highenergy
demands.
A global marketcap-and-trade programisthe bestlong-termsolution.Let’stake alookat just
US carbon dioxide emissions. Accordingtothe EPA in the UnitedStates,the majorityof greenhouse
gassescome fromthe Electricity generation industry andthe Transportationindustry.
The easy wayout,is to tax any firmthat has carbon-dioxide outputbasedonthe amountof
theirgreenhouse gasemissions,howeverthatdoesn’tincentivize innovation.Thatjustincrease the
overall general costof these firms. Let’sfocusonelectrical productioninthe UnitedStates.
2. The market isdominatedby
coal.A simple carbon-outputtax would
justincrease the coal companiescost,
but due to the sheersize,theycanjust
increase the costof theirelectricityto
coverthe tax burdenand still be more
price-effectivethannon-renewable
energy.
CO2 emissions from U.S. electricity generation by source, 20121
1
Preliminary2012 data.
2
Miscellaneous wastes and from geothermal power generation.
A cap-and-trade wouldhelptodecrease thisprice advantagethatnon-renewableenergyhason
renewable cleanenergy.The solutioniseveryfirmin the 5 industriesthathave carbon-dioxideoutput
shouldbe allocated Greenhouse gas permitsbasedona2 stepprocess.The firststepis allocatingthe
permitsbasedonthe percentage of total carbondioxide output foreachindustry.Electrical wouldget
32%; Transportationwouldbe 28%and so on.Now that you have the allocationperindustry,the
allocationpercompanyinthe industry would be basedonrevenue.The endresultis thatrenewable
energy-providerswouldhave more greenhouse gaspermits (GGPs) then theircompaniesneed,andthe
fossil fuel energy-providerswon’thave enough GGPstocover theircarbon-dioxideemissions.Rightfrom
the start, natural gas and coal will have tobuyor rent(if the othercompaniesare smart) GGPs from the
Source Million Metric Tons Share of Total
Coal 1,514 74%
Natural gas 494 24%
Petroleum 19 1%
Other2
12 1%
Total 2,039
3. cleanenergysources.Thismarketplace,willallow the shiftingof assetsandresourcesfromfossil-fuel
energyproviderstorenewable energy-providers,allowingthe cleanindustrytonotonlyinvesthigherin
researchand development,buttoalsosubsidize costtoconsumers andcompete more effectively.
Thisprogram can alsogenerate additional tax revenue.The renewableenergycompanieswill
pay additional taxesfromthe sale of GGPs.Itwouldalsobe beneficialbotheconomicallyandsocially
beneficial tonotallowcompanieswrite off the expense of buyingorrentingGGPs.Thiswouldkeepthe
fossil-fuelstax revenue relativelythe same andhave the addedbenefitof increasedrevenue fromthe
renewable energysources.
Cap-and-trade isthe bestprogramto incentivize innovation,increase competition,fairerpaid
practices,andlong-termgrowthof renewableenergies. The bestpartisthe marketplace wouldallowfor
companiesindifferentindustriestosubsidize eachother.Thisprogramcanbe easilyadaptedtoglobal
greenhouse gasemissions.Scientistknowshow muchcarbon-dioxideouratmosphere canhandle ina
yearand the cap will make sure that we nevergooverit. The supplyisset,the demandisthere,letthe
“invisible hand”of economicsdowhatitdoesbest,create efficiencyandpromote competition.
4. Sources
1st
Pie graph:Sourcesof Greenhouse Gasemissions.EPA.Gov.Publishedbythe Environmental
ProtectionAgency.<http://epa.gov/climatechange/ghgemissions/sources/industry.html>
2nd
Circle chart:Electricpowertransmission.IBISWorld.com.PublishedbyIBISWorld.
IBISWorld.< http://clients1.ibisworld.com/reports/us/industry/ataglance.aspx?entid=155>
3rd
table:CO2 emissionsfromU.S.electricitygenerationbysource,2012. U.S. EnergyInformation
Administration.<http://www.eia.gov/tools/faqs/faq.cfm?id=77&t=11>