Human-Centred Design & the Business Model Canvas
•
18 likes•3,071 views

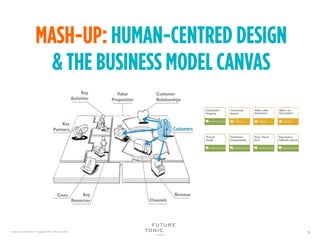
What’s the best way to show how Human-Centred Design (aka Design Thinking) methods could be applied to the Business Model Canvas? By mapping methods onto a specific challenge within a Building Block. Here, I've looked at how to better understand the Customer Segment in order to inform choices about Value Propositions, Channels, Customer Relationships and Revenue Streams.

Recommended
More Related Content
What's hot
What's hot (20)
Viewers also liked
Viewers also liked (20)
Similar to Human-Centred Design & the Business Model Canvas
Similar to Human-Centred Design & the Business Model Canvas (20)
Recently uploaded
Recently uploaded (20)
Human-Centred Design & the Business Model Canvas
- 2. What’s the best way to show how Human-Centred Design (aka Design Thinking) methods could be applied to the Business Model Canvas? First, I looked at whether certain HCD methods could be spatially mapped onto the canvas.
- 3. by the LUMA Institute https://www.luma-institute.com/ As there are hundreds of HCD methods, I looked at the subset of methods that the LUMA Institute included in its framework, which has edited the world of design thinking methods into 36 of the most useful ones, organised into 3 top-level categories: Looking, Understanding, and Making.
- 4. I used the 1-page Business Model Canvas from Alexander Osterwalder and Yves Pigneur’s book on Business Model Generation, which organised the 9 elements comprising a business model into a 1-page canvas showing relationships between the elements (Value Proposition, Customers, Customer Relationships, Channels, Revenue Streams, Key Activities, Key Resources, Key Partners, and Costs). by Osterwalder and Pigneur http://businessmodelgeneration.com/canvas/bmc
- 5. Then I tried to see whether the HCD methods could be mapped onto the canvas….
- 8. The LUMA HCD taxonomy is meant to be more like a periodic table of elements - some elements combine nicely with other elements to give you a useful compound. Thus if you try to map an element on its own, it’s not particularly useful because you lose sight of the relationships among the methods and the value of the ‘output’ or objective you’re trying to achieve by using the methods in combination. That's why it’s best to arrange the methods into method sets that can be applied to a particular problem or situation.
- 9. But what challenge can we apply on the Business Model Canvas? What about applying the methods to tackle challenges within a specific building block of the BMC, such as the Customer Segment? According to Osterwalder and Pigneur understanding customers is critical because it informs choices we'll make on the Value Proposition, Channel, Customer Relationship and Revenue Streams.
- 10. Thus, the challenge I focused on was understanding the customer perspective in order to inform choices about Value Propositions, Channels, Customer Relationships and Revenue Streams.
- 11. To tackle this challenge, I selected a number of HCD methods and arranged them in a sample sequence, organised by 4 top level objectives: • Identify Customer Segments • Under their Needs • Analyse & Humanise • Prioritise
- 12. First, we need to identify the (right) Customer Segments.
- 13. Stakeholder Mapping is a method for diagramming the network of people who have influence on, or are affected by, a product, service or system. It’s a great tool for visualising the different roles and relationships within a system (e.g., a project, a programme of work, etc.). We can use this to not only identify the different types of customers who would be interested in the Value Proposition, but also help identify potential Key Partners and Key Resources Gather an interdisciplinary team and create a stakeholder map to understand: • Who the different stakeholders are and how they relate to one another • Of the stakeholders who are customers, who has the most influence • Who is most likely to buy your value propositionA way of diagramming the network of people who have a stake in a given system.
- 14. Next, we need to understand the customers' needs.
- 15. Contextual Inquiry is one of the best methods to understand customer needs as it involves interviewing AND observing people in their real environments, which is the best way to see unmet needs as well as articulated problems. Find representative customers and conduct a contextual inquiry to understand: • The jobs they need to get done and how your offering could help • The problems they encounter with current solutions, and how they ‘hack’ their environment to make things work better for them • What their daily routine is like, whom they interacting with, in what contexts, to what purpose • What triggers them to search for, buy and use a new product or service An approach to interviewing and observing people in their own environment.
- 16. If it’s not feasible to conduct a contextual inquiry, or if you want to deepen your understanding of customers even more, you could do Walk-a-Mile- Immersion (WAMI), in which you place yourself in the customer’s shoes and see things for their perspective. It’s also one of the best methods for building empathy for customers. Identify a few key jobs your customers want to accomplish. Try to replicate their experience by using the tools they use, in the environments of use, and working under constraints they face to understand: • What it feels like to do the jobs your customers do • The problems they encounter with current solutions A way of building empathy for people through first-hand experience.
- 17. If you've developed your Value Proposition (VP) to the point where you know the different features you could include, and have a rough idea of costs for implementing and supporting those features, then you could conduct Buy-a- Feature with customers to understand what they value, and what trade-offs they make when considering the costs and benefits of different features. Find representative customers and give them fake money or tokens that they can spend on different features. Ask them to think aloud about what features they want to buy to find out: • Which features are more important and why • Whether the cost of the features relates to the perceived value they provide (are some seen as overpriced and others as good deal?) • Trade-off decisions and rationalisations A game in which people use artificial money to express trade-off decisions
- 18. Or, if your VP is still being formulated, you could conduct a What's on Your Radar to understand the relative importance of problems (or solutions) to your customers. Find representative customers have them place topics on the radar diagram according to degree of importance to them. Ask them to explain their mapping to understand which topics are more important and why. An exercise in which people plot items according to personal significance.
- 19. With all that rich data and insights from the Customer Research, we need to analyse it in such a way that we don't lose the human element. Numbers and statistics don't let us understand our customers' needs and motivations and how they might respond to changes in the Value Proposition, Channel, Customer Relationship and Revenue streams. Thus we need tools that help us visualise customer needs so that we can make better design decisions and communicate those need more effectively to others.
- 20. If you’ve conducted a Contextual Inquiry, you can analyse the data from those interviews and observations to create Persona Profiles. Personas bring the data to life and remind your team about the different types of needs and attitudes that customers have, so that you’re less likely to create something based on assumptions of what you think customers want. Create 3 to 5 personas who: • Capture key attitudes and behaviours of customers in a respectful, believable way • Enable your team empathise with the persona’s problems and needs • Empower you team to use them as tools to guide decision making about Value Propositions, Channels, Customer Relationship, and Revenue Streams An informed summary of the mindset, needs and goals typically held by key stakeholders.
- 21. If you’ve conducted a Contextual Inquiry or a Walk-a-Mile-Immersion, you can create an Experience Diagram to show the path through a task as well as the positive experiences and breakpoints, which highlight areas that your VP could address. Create an experience map of the customers’ experience to show: • An overview of the current state (actions, tools, actors, decision points, emotional journey, customer touchpoints) • Critical breakpoints (areas where you can improve the experience) A way of mapping a person’s journey through a set of circumstances or tasks.
- 22. You can quickly codify the data you’ve collected by conducting a Rose, Thorn, Bud analysis. Positive experiences are coded as Roses (on a pink sticky notes), Negatives as Thorns (on a blue sticky notes) and Opportunities as Buds (on green sticky notes). Conduct a Rose, Thorn, Bud on the data you’ve collected to identify: • Positives (to maintain or improve upon, Negatives (to reduce or eliminate), and Opportunities (potential to differentiate) You could conduct an RTB on an Experience Diagram, or with notes from a Contextual Inquiry or Walk-a- Mile-Immersion. A way of mapping a person’s journey through a set of circumstances or tasks.
- 23. Because you have limited resources (people, money) and time, you probably won’t be able to implement all the features or changes to your BMC that you’d like to, based on what you’ve learned from understanding and analysing customer needs. Thus, you need a way to prioritise.
- 24. Prioritisation can be tricky because people often conflate two criteria: the importance of an issue and the effort required to address the issue. The Importance/Difficulty matrix pulls those criteria apart, allowing us rank the relative importance of problems (or needs) against the cost (or difficulty) of making and delivering different solutions (or features. Gather an interdisciplinary team to rank the needs/opportunities in terms of perceived importance to the customer segment and degree to which your current Value Proposition meets the needs, in order to identify the areas of: • Core Alignment (important customer needs that will be met your Value Proposition) • Pivot Points (important customer needs that will not be met by current Value Proposition) • Considerations (less important customer needs that your Value Proposition will meet) • Luxuries/Distractions (less important customer needs that your Value Proposition won’t meet) A quad chart for plotting items by relative importance and difficulty.
- 25. I've adapted the Importance/Difficulty matrix so that you can use it to sense-check a Value Proposition (and 'pivot' if warranted). It can be used to rank customer needs in terms of relative importance (from the customers' point of view--which problems/needs are more important) and the degree to which the (currently envisioned) Value Proposition meets those needs. The matrix can help prioritise or re-direct effort to areas of High-Importance, and de-escalate lower importance ones.
- 26. I’ve labelled the quadrants according to the relationship of the Customer Needs to the Value Proposition. High importance needs that the VP is meeting to high degree are considered Core Alignment needs, meaning that effort should be directed towards ensuring that the VP continues to meet them.
- 27. Less Important needs that the VP is meeting to a high degree are Considerations (i.e., depending on the degree of effort needed to implement them should be considered but not to the detriment of the Core Alignment areas).
- 28. Low Importance needs that the VP is not meeting or only partially meeting, are Luxuries. It’s probably not worth the effort to adjust the VP to meet the lower priority needs.
- 29. High Importance needs that the VP is not meeting or only partially meeting, are Pivot Points (opportunities to adjust the VP). The Pivot Points represent important customer needs that will not be fully met by your current Value Proposition—thus it’s worth exploring what it would take to pivot the VP to meet these important customer needs.
- 30. Of course there are many other methods that could be used to tackle the challenge, depending on knowns, unknowns, timelines, budgets and many other factors. This was just an initial effort to see how I could map some HCD methods to the BMC. Any (constructive) feedback or suggestions are welcome!
- 32. Text and image • Lorem ipsum dolor sit amet, consectetur adipiscing elit. Proin id purus mi, nec ornare est. Phasellus nec lorem nisl. Mauris hendrerit porttitor consequat. • This text is Arial 24 pt.