1. May 2015 Jobs Report Observations
As hasbecome customary,myjobsreportcommentsstayaway fromthe headline dataandtalk only to those data
pointsthatI findinteresting. Commentsinvolve threebroadtopics:(i) the numberof jobs;(ii) the quality of the jobs;
and (iii) wages.
1. Numberof Jobs
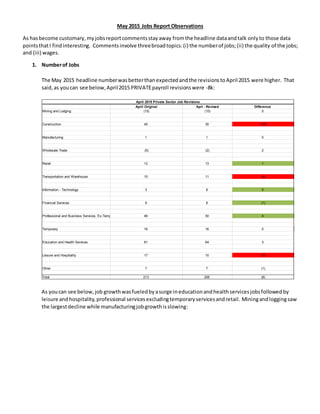
The May 2015 headline numberwasbetterthanexpectedandthe revisionstoApril 2015 were higher. That
said,as youcan see below,April2015 PRIVATEpayroll revisionswere -8k:
As youcan see below,job growthwasfueledbyasurge ineducationandhealthservicesjobsfollowedby
leisure andhospitality,professional servicesexcludingtemporaryservicesandretail. Miningandloggingsaw
the largestdecline while manufacturingjobgrowthisslowing:
April Original Aprl - Revised Difference
Mining and Lodging (15) (15) 0
Construction 45 35 (10)
Manufacturing 1 1 0
Wholesale Trade (5) (2) 2
Retail 12 13 1
Transportation and Warehouse 15 11 (4)
Information - Technology 3 8 5
Financial Services 9 8 (1)
Professional and Business Services, Ex-Temp 46 50 4
Temporary 16 16 0
Education and Health Services 61 64 3
Leisure and Hospitality 17 10 (7)
Other 7 7 (1)
Total 213 206 (8)
April 2015 Private Sector Job Revisions
2. We make a fewcommentsabouta few of the highlightedsectorsbelow:
a. Education and Health: ambulatoryhealthcare servicesandhospitalemployeesare leadingthe surge
b. Leisure and Hospitality: performingarts,spectatorsports,amusementparks,gambling,accommodation,
and restaurantsare seeingthe growth
c. Miningand Logging: No one issurprisedthese jobs are decliningbut the decline has almost nothingto
do with oil and gas extraction and is beingfeltonlyin support activitiesfor mining. Focusing on the oil
and gas extractionjob sub-sector,we can see job losshas beenminimal here:
May June July August September October November December January February March April May Total
Mining and Lodging 2 5 9 2 6 2 1 1 (7) (14) (12) (15) (18) (38)
% of total -1.2%
Construction 9 8 30 17 18 16 30 44 41 31 (9) 35 17 287
% of total 9.0%
Manufacturing 15 21 24 3 20 24 45 19 17 3 0 1 7 199
% of total 6.2%
Wholesale Trade 6 13 3 5 3 8 8 14 12 10 10 (2) 4 95
% of total 3.0%
Retail 12 35 21 (4) 40 33 61 (0) 35 23 25 13 31 326
% of total 10.2%
Transportation and Warehouse 17 13 21 11 7 13 26 38 (13) 9 8 11 13 175
% of total 5.5%
Information - Technology (6) 11 10 14 3 (6) 7 6 6 7 0 8 (3) 57
% of total 1.8%
Financial Services 8 19 15 12 14 4 28 7 19 9 7 8 13 163
% of total 5.1%
Professional and Business Services, Ex-Temp 43 55 34 28 43 32 65 51 28 53 22 50 43 547
% of total . 17.2%
Temporary 15 15 16 21 23 19 31 21 (8) (4) 13 16 20 197
% of total 6.2%
Education and Health Services 58 48 37 50 35 44 51 54 42 61 35 64 74 653
% of total 20.5%
Leisure and Hospitality 45 21 10 26 47 60 42 56 24 61 (6) 10 57 453
% of total 14.2%
Other 4 (5) 3 11 0 5 19 8 5 11 2 7 3 73
% of total 2.3%
Total 227 260 233 197 259 254 414 319 202 261 95 206 262 3,187
Average 245
Private Job Detail (May 2014-May 2015), Revised
3. This contrasts with the decline inthe rig count:
As a result,oil and gas extractionjobs per rig is now approaching all time highs:
100
120
140
160
180
200
220
240
260
280
2/1/1972
10/1/1973
6/1/1975
2/1/1977
10/1/1978
6/1/1980
2/1/1982
10/1/1983
6/1/1985
2/1/1987
10/1/1988
6/1/1990
2/1/1992
10/1/1993
6/1/1995
2/1/1997
10/1/1998
6/1/2000
2/1/2002
10/1/2003
6/1/2005
2/1/2007
10/1/2008
6/1/2010
2/1/2012
10/1/2013
Oil and Gas Extraction Jobs, Level Data
Oil and Gas Extraction Jobs, Level Data
100
600
1,100
1,600
2,100
2,600
1/1/1991
1/1/1992
1/1/1993
1/1/1994
1/1/1995
1/1/1996
1/1/1997
1/1/1998
1/1/1999
1/1/2000
1/1/2001
1/1/2002
1/1/2003
1/1/2004
1/1/2005
1/1/2006
1/1/2007
1/1/2008
1/1/2009
1/1/2010
1/1/2011
1/1/2012
1/1/2013
1/1/2014
1/1/2015
Baker Hughes Rig Count
Baker Hughes Rig Count
6. Perhapsnoone wants a job:
98
100
102
104
106
108
110
6/1/2009
9/1/2009
12/1/2009
3/1/2010
6/1/2010
9/1/2010
12/1/2010
3/1/2011
6/1/2011
9/1/2011
12/1/2011
3/1/2012
6/1/2012
9/1/2012
12/1/2012
3/1/2013
6/1/2013
9/1/2013
12/1/2013
3/1/2014
6/1/2014
9/1/2014
12/1/2014
3/1/2015
Civilian Labor Force versus Total People Employed
(Household Survey) versus Non-Farm Payrolls
(Establishment Survey) - June 2009 to Present Where
June 2009 = 100
Civilian Labor Force Total People Employed (Household Survey)
Non-Farm Payrolls (Establishment Survey)
7. 2. Quality of Jobs
At a highlevel,jobgrowthisnottranslatingintoGDPgrowth,at leastnotat levelswe are accustomedto
seeing:
29.0%
30.0%
31.0%
32.0%
33.0%
34.0%
35.0%
36.0%
1/1/1994
10/1/1994
7/1/1995
4/1/1996
1/1/1997
10/1/1997
7/1/1998
4/1/1999
1/1/2000
10/1/2000
7/1/2001
4/1/2002
1/1/2003
10/1/2003
7/1/2004
4/1/2005
1/1/2006
10/1/2006
7/1/2007
4/1/2008
1/1/2009
10/1/2009
7/1/2010
4/1/2011
1/1/2012
10/1/2012
7/1/2013
4/1/2014
1/1/2015
Not In Labor Force AND Do NOT Want a Job/Civilian
Non-Institutional Population
Not In Labor Force AND Do NOT Want a Job
9. Relative tothe size of the laborforce,full time jobs remainwell below pre-recessionlevels:
Part-time jobsdiddeclineBUTONLY BECAUSE OF DECINESIN THOSE WORKINGPART-TIME FORNON-
ECONOMICREASONS (blue line). THOSEWORKING PART-TIME BECAUSE OF SLACK ECONOMICCONDITIONS
(redline) AND BECAUSE THE PERSON COULD NOT FIND FULL TIME WORK(greenline) ACTUALLY
INCREASED:
80%
81%
81%
82%
82%
83%
83%
84%
1/1/2000
9/1/2000
5/1/2001
1/1/2002
9/1/2002
5/1/2003
1/1/2004
9/1/2004
5/1/2005
1/1/2006
9/1/2006
5/1/2007
1/1/2008
9/1/2008
5/1/2009
1/1/2010
9/1/2010
5/1/2011
1/1/2012
9/1/2012
5/1/2013
1/1/2014
9/1/2014
5/1/2015
Full Time Employees/Total Labor Force
(2000-Present)
Full Time Employees/Total Labor Force (2000-Present)
10. If those working part time because they cannot find full time were back at pre-recessionlevels,the full
time work force would be almost 1.2m workers greater than current levels.
3. Wages
Average hourlywage growthhasbrokenoutof itsmulti-yearrange:
50.0
60.0
70.0
80.0
90.0
100.0
110.0
120.0
130.0
140.0
6/1/2009
9/1/2009
12/1/2009
3/1/2010
6/1/2010
9/1/2010
12/1/2010
3/1/2011
6/1/2011
9/1/2011
12/1/2011
3/1/2012
6/1/2012
9/1/2012
12/1/2012
3/1/2013
6/1/2013
9/1/2013
12/1/2013
3/1/2014
6/1/2014
9/1/2014
12/1/2014
3/1/2015
Part Time Workers By Reason (June 2009 =
100 For Each Category)
Non-Economic Reasons Slack Business Conditions Can Only Find Part Time Work
11. But 80% of the workforce isnot sharingin this trend:
Lookingbelow,we see thattwoof the three fastestgrowingjobssectors(greenhighlightsinleftcolumn) have
wagesgrowingfasterthanthe y/yaverage wage growthrate. That said,twoof these three sectorshave overall
average hourlywagesbelowthe average hourlywage (onanunweightedbasis):
1.50%
2.00%
2.50%
3.00%
3.50%
4.00%
Average Hourly Wages Nominal, Y/Y
Ave ra ge Hourly Wag es, Y /Y
0.0%
2.0%
4.0%
6.0%
8.0%
10.0%
1965-01-01
1967-01-01
1969-01-01
1971-01-01
1973-01-01
1975-01-01
1977-01-01
1979-01-01
1981-01-01
1983-01-01
1985-01-01
1987-01-01
1989-01-01
1991-01-01
1993-01-01
1995-01-01
1997-01-01
1999-01-01
2001-01-01
2003-01-01
2005-01-01
2007-01-01
2009-01-01
2011-01-01
2013-01-01
2015-01-01
Average Hourly Earnings of Production and
NonsupervisoryEmployees, Private Sector,
Y/Y
Average Hourly Earnings of Production and Nonsupervisory Employees, Private Sector,
Y/Y
12. Overall,thisisthe chart thatmust be reconciled. Eitherspendingmustaccelerateorrevisionstothe jobsdata
mightjustbe meaningfullynegative:
For those interested,beloware the chartsof the average hourlywagesbyjobsector. Six sectorsare growing
above average andfive sectorsare growingbelow average. Wholesale trade saw the markedacceleration:
Type % of Overall Growth Average Wage Growth, y/y Average Hourly Wage Growth, 3 Month Annual % of Labor Force Average Hourly Wage
Leisure and Hospitality 14.2% 3.6% 3.6% 10.2% $14.32
Financial Services 5.1% 3.0% 3.0% 4.1% $31.52
Construction 9.0% 2.7% 2.7% 4.3% $27.34
Professional and Business Services, Ex-Temp 17.2% 2.6% 2.6% 14.8% $29.98
Retail 10.2% 2.5% 2.5% 10.5% $17.41
Wholesale Trade 3.0% 2.4% 2.4% 4.0% $28.73
Information - Technology 1.8% 2.2% 2.2% 1.9% $34.63
Other 2.3% 2.2% 2.2% 3.8% $22.36
Education and Health Services 20.5% 2.1% 2.1% 14.8% $25.19
Manufacturing 6.2% 1.8% 1.8% 8.3% $25.16
Mining and Lodging -1.2% 0.6% 0.6% 0.5% $31.02
Temporary 6.2% 2.0%
Transportation and Warehouse 5.5% 3.2%
Average 7.7% 2.4% 2.9% $26.15
Private Sector Job Growth, May 2014 - May 2015
0.0%
2.0%
4.0%
6.0%
8.0%
10.0%
12.0%
14.0%
PersonalConsumption Expenditures, Nominal
Deflated by Non-Farm Payrolls
Personal Consumption Expenditures, Nominal Deflated by Non-Farm Payrolls Average