Quarterly investment Outlook Q3 2015
•
1 like•240 views

Market Outlooks We leverage a global network of investment consultants and researchers to deliver industry specific knowledge and dynamic tools, which allows our clients to make informed strategic investment decisions.

Recommended
More Related Content
What's hot
What's hot (20)
Viewers also liked
Similar to Quarterly investment Outlook Q3 2015
Similar to Quarterly investment Outlook Q3 2015 (20)
More from Graeme Cross
More from Graeme Cross (20)
Recently uploaded
Recently uploaded (20)
Quarterly investment Outlook Q3 2015
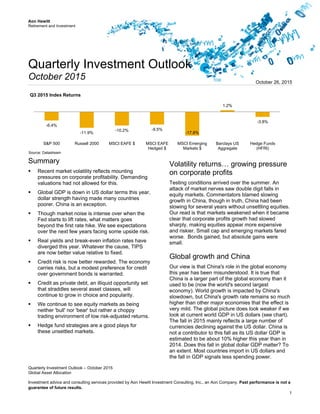
- 1. Aon Hewitt Retirement and Investment Quarterly Investment Outlook – October 2015 Global Asset Allocation Investment advice and consulting services provided by Aon Hewitt Investment Consulting, Inc., an Aon Company. Past performance is not a guarantee of future results. 1 Quarterly Investment Outlook October 2015 Summary Recent market volatility reflects mounting pressures on corporate profitability. Demanding valuations had not allowed for this. Global GDP is down in US dollar terms this year, dollar strength having made many countries poorer. China is an exception. Though market noise is intense over when the Fed starts to lift rates, what matters goes beyond the first rate hike. We see expectations over the next few years facing some upside risk. Real yields and break-even inflation rates have diverged this year. Whatever the cause, TIPS are now better value relative to fixed. Credit risk is now better rewarded. The economy carries risks, but a modest preference for credit over government bonds is warranted. Credit as private debt, an illiquid opportunity set that straddles several asset classes, will continue to grow in choice and popularity. We continue to see equity markets as being neither 'bull' nor 'bear' but rather a choppy trading environment of low risk-adjusted returns. Hedge fund strategies are a good plays for these unsettled markets. Volatility returns… growing pressure on corporate profits Testing conditions arrived over the summer. An attack of market nerves saw double digit falls in equity markets. Commentators blamed slowing growth in China, though in truth, China had been slowing for several years without unsettling equities. Our read is that markets weakened when it became clear that corporate profits growth had slowed sharply, making equities appear more expensive and riskier. Small cap and emerging markets fared worse. Bonds gained, but absolute gains were small. Global growth and China Our view is that China's role in the global economy this year has been misunderstood. It is true that China is a larger part of the global economy than it used to be (now the world's second largest economy). World growth is impacted by China's slowdown, but China's growth rate remains so much higher than other major economies that the effect is very mild. The global picture does look weaker if we look at current world GDP in US dollars (see chart). The fall in 2015 mainly reflects a large number of currencies declining against the US dollar. China is not a contributor to this fall as its US dollar GDP is estimated to be about 10% higher this year than in 2014. Does this fall in global dollar GDP matter? To an extent. Most countries import in US dollars and the fall in GDP signals less spending power. -6.4% -11.9% -10.2% -9.5% -17.8% 1.2% -3.8% S&P 500 Russell 2000 MSCI EAFE $ MSCI EAFE Hedged $ MSCI Emerging Markets $ Barclays US Aggregate Hedge Funds (HFRI) Q3 2015 Index Returns Source: Datastream October 26, 2015
- 2. Aon Hewitt Retirement and Investment Quarterly Investment Outlook – October 2015 Global Asset Allocation Investment advice and consulting services provided by Aon Hewitt Investment Consulting, Inc., an Aon Company. Past performance is not a guarantee of future results. 2 Commodity exporters are the largest fallers - Australia, Canada, Russia and Latin America are poorer now, dampening spending by their citizens and companies on foreign goods and services. Global economy worries are longer- term… less about 2015 Our bigger concerns about the global economy have a more long-term focus. Though activity has slowed recently, the key problems are the fade in the longer-term contributions from the key growth drivers of demographic expansion and labor productivity. Population ageing has already slowed growth potential in many countries; more importantly, labor productivity growth has stalled globally since the financial crisis, for reasons that are not fully understood. China's slowdown as it re-orients its economy away from external to home demand has dampened growth, but it is these longer-term factors that better explain weakness in Europe and lackluster growth in the US. Tell-tale indicators of the long-term growth malaise are persistently low inflation and interest rates being stuck at near zero in the developed world seven years after the financial crisis ended. Fed fund rate expectations may have been pushed down too far The recent push-back on interest rate rises by the Federal Reserve has created confusion on the timing of lift-off. Opinion is divided between a first move in December (the dominant view among economists) and one in March (derivative pricing). As we know, the timing of the first rate rise is trivial when set against the trajectory of rate rises over the next few years. Timing speculation simply creates market noise. What is clear is that the repeated push-back of rate rises in the 2013-15 period has impacted the US yield curve to a point where only a few and ultra-gradual interest rate rises are signaled. Currently the US Treasury curve suggests that the Fed funds rate will not even reach 2% by 2020. Even with our view of subdued growth, risks to such a path would appear to be on the upside. US yields: Break-even and real yields diverging? US Treasury yields fell markedly last year, and though they are up marginally this year to date, it is clear that yields have been at far lower levels than almost all projections over this period, and have also substantially undershot forward rates derived from the yield curve at the start of 2014 and this year This year's bond market moves also show a divergence between the two yield components of 'real' yields and inflation. Real yields on 30 year TIPS have been on a mild upward trend this year, whereas break-even inflation (the gap with fixed interest treasuries of the same maturity) has been on a downtrend (see chart). To us the relative firmness of real yields suggests that the market is less worried about growth weakness whereas particularly low break-even inflation suggests the market is more concerned about sustained low inflation. TIPS are cheaper for those looking to hedge inflation risk Is this creating an opportunity? Current break-even inflation rates imply the Federal Reserve not meeting its inflation target almost permanently. While not impossible, such systematic Fed failure is unlikely. This anomaly presents an opportunity for shifting some fixed treasury bonds into TIPS for return enhancement and cheaper inflation hedging. 95 100 105 110 2011 2012 2013 2014 2015 World real GDP (local currency) World nominal GDP (US dollars)Source: IMF Global economy does look weak in US dollars (2011 = 100)
- 3. Aon Hewitt Retirement and Investment Quarterly Investment Outlook – October 2015 Global Asset Allocation Investment advice and consulting services provided by Aon Hewitt Investment Consulting, Inc., an Aon Company. Past performance is not a guarantee of future results. 3 Global monetary easing still suppressing the US 'term premium' The extension of global monetary easing – the postponement of US interest rate rises, a recent hint of more aggressive monetary easing from the European Central Bank, interest rate cuts in China and many other emerging and developed markets have continued to push down the front end of many countries' yield curves. In turn, this has suppressed the so-called term premium – the element of longer- term bond yields that captures the risk taken by investors in longer-term interest rates and inflation. US data show that the term premium for 10 year duration US Treasury bonds has fallen significantly over the past year. US investment grade is looking better value …high yield a bit better too Our view is that US credit is more attractive after a rise in spreads this year triggered by large supply and problems in the energy sector. Current spreads over US Treasuries are now slightly above our fair value estimates, with long credit spreads (at above 2%) looking more attractive than intermediate durations. That said, there clearly are some economic risks which warrant caution, so spread attractions need to be weighed up in that context. So long as a major economic slowdown is avoided, we see a modest preference for credit over US treasuries to be reasonable. It is obviously harder, given still low yields, to make this a positive call on absolute returns, however. Much the same can be said for high yield where return prospects are modestly better after a pronounced sell-off. Credit as 'private debt' – a growing opportunity set The multi-year bank deleveraging driven by regulatory change continues to allow pension funds to pick up return by providing finance for expansion in a wide variety of sectors. This heterogeneous and growing set of investment opportunities, termed 'private debt', straddles standard asset class boundaries of bonds, infrastructure, property and private equity. The return pick-up in private debt reflects specific attributes that bypasses some of the market challenges faced by conventional asset classes. Equities: Why upside is limited Though equity markets fell over the summer, declines were not large enough to open an obvious buying opportunity. Market upside is still constrained by two factors. First, high valuations in the all- important US equity market remain. Profits had been cushioned from lackluster sales by expanding profit margins, but this is no longer with us (see chart), pinching earnings. Second, weaker global growth and limited scope to stimulate growth given the level of interest rates, is raising market risk. Low and more volatile returns rather than a bear market… We do not see the ingredients for a 'bear' market of large falls either. Though slowdown could turn to recession, an obvious trigger for large market falls, this is a low probability. China's slowdown and weak commodity prices are not recessionary. Importantly, low yields sustain equities' long-term appeal given dividends and (limited) capital growth. Low returns in a more volatile trading environment are more likely. …some opportunities from trend reversal? Some good relative value opportunities could boost returns; a few strong trends could be overshooting now before a reversal – the strength of defensive sectors for example or large US outperformance over emerging markets. Active managers positioned to take advantage should benefit. 0 2 4 6 8 10 0 0.5 1 1.5 2 2005 2006 2007 2008 2009 2010 2011 2012 2013 2014 2015 % US non-financial profit margins (RHS) S&P 500 Forward Price/Sales ratioSource: Datastream US proft margins vs valuations
- 4. Aon Hewitt Retirement and Investment Quarterly Investment Outlook – October 2015 Global Asset Allocation Investment advice and consulting services provided by Aon Hewitt Investment Consulting, Inc., an Aon Company. Past performance is not a guarantee of future results. 4 Hedge funds: appropriate for these market conditions These are the times when hedge fund allocations, appropriately structured, make their value most felt. Our return expectations from different hedge fund approaches have moved a little lower recently reflecting managers' greater difficulty in adding value. This has not changed our view that this investment style is well matched for unsettled market conditions. We prefer strategies less dependent on rising markets.
- 5. Aon Hewitt Retirement and Investment Quarterly Investment Outlook – October 2015 Global Asset Allocation Investment advice and consulting services provided by Aon Hewitt Investment Consulting, Inc., an Aon Company. Past performance is not a guarantee of future results. 5 Appendix: Index Definitions S&P 500 Index – The market-cap-weighted index includes 500 leading companies and captures approximately 80% of available market capitalization. Russell 2000 Index - The Russell 2000 Index measures the performance of the small-cap segment of the U.S. equity universe. The Russell 2000 Index is a subset of the Russell 3000® Index representing approximately 10% of the total market capitalization of that index. It includes approximately 2000 of the smallest securities based on a combination of their market cap and current index membership. The Russell 2000 is constructed to provide a comprehensive and unbiased small-cap barometer and is completely reconstituted annually to ensure larger stocks do not distort the performance and characteristics of the true small-cap opportunity set. MSCI EAFE Index $ - The MSCI EAFE Index is designed to measure the performance of the large and mid-cap segments of developed European Australasian and Far East Markets. The index covers approximately 85% of the free float-adjusted market capitalization and is measured in USD dollar terms. MSCI EAFE Index (Hedged) - The MSCI EAFE hedged Index is designed to measure the performance of the large and mid-cap segments of developed European Australasian and Far East Markets. The index covers approximately 85% of the free float-adjusted market capitalization and is measured in hedged dollar terms. MSCI Emerging Markets Index – The MSCI Emerging Markets Index captures large and mid-cap representation across Emerging Markets (EM) countries. The index covers approximately 85% of the free float-adjusted market capitalization in each country and is measured in USD terms. Barclays Capital Aggregate Index - The Barclays U.S. Aggregate Index represents securities that are SEC- registered, taxable, and dollar denominated. The index covers the U.S. investment grade fixed rate bond market, with index components for government and corporate securities, mortgage pass-through securities, and asset- backed securities. HFRI: The Hedge Fund Research, Inc. Monthly Indices (HFRI) are fund-weighted (equal-weighted) indices. Unlike asset-weighting, the equal-weighting of indices presents a more general picture of performance of the hedge fund industry. Any bias towards the larger funds potentially created by alternative weightings is greatly reduced, especially for strategies that encompass a small number of funds. All single-manager HFRI Index constituents are included in the HFRI Fund Weighted Composite, which accounts for over 2000 funds listed on the internal HFR Database.
- 6. Aon Hewitt Retirement and Investment Quarterly Investment Outlook – October 2015 Global Asset Allocation Investment advice and consulting services provided by Aon Hewitt Investment Consulting, Inc., an Aon Company. Past performance is not a guarantee of future results. 6 Contact Information Tapan Datta Head of Global Asset Allocation Aon Hewitt Limited +44 (0)20 7086 9076 tapan.datta@aonhewitt.com Legal Disclosures and Disclaimers Investment advice and consulting services provided by Aon Hewitt Investment Consulting, Inc. (“AHIC”). The information contained herein is given as of the date hereof and does not purport to give information as of any other date. The delivery at any time shall not, under any circumstances, create any implication that there has been a change in the information set forth herein since the date hereof or any obligation to update or provide amendments hereto. This document is not intended to provide, and shall not be relied upon for, accounting, legal or tax advice or investment recommendations. Any accounting, legal, or taxation position described in this presentation is a general statement and shall only be used as a guide. It does not constitute accounting, legal, and tax advice and is based on AHIC’s understanding of current laws and interpretation. This document is intended for general information purposes only and should not be construed as advice or opinions on any specific facts or circumstances. The comments in this summary are based upon AHIC’s preliminary analysis of publicly available information. The content of this document is made available on an “as is” basis, without warranty of any kind. AHIC disclaims any legal liability to any person or organization for loss or damage caused by or resulting from any reliance placed on that content. AHIC. reserves all rights to the content of this document. No part of this document may be reproduced, stored, or transmitted by any means without the express written consent of AHIC. © Aon plc 2015. All rights reserved. About Aon Hewitt Investment Consulting, Inc. Aon Hewitt Investment Consulting, Inc., an Aon plc company (NYSE:AON), is an SEC-registered investment adviser. We provide independent, innovative solutions to address the complex challenges of over 480 clients in North America with total client assets of approximately $1.7 trillion as of June 30, 2014. More than 270 investment consulting professionals in the U.S. advise institutional investors such as corporations, public organizations, union associations, health systems, endowments, and foundations with investments ranging from $3 million to $310 billion. AHIC is a federally registered investment advisor with the U.S. Securities and Exchange Commission. AHIC is also registered with the Commodity Futures Trade Commission as a commodity pool operator, and is a member of the National Futures Association. The AHIC ADV Form Part 2A disclosure statement is available upon written request to: Aon Hewitt Investment Consulting, Inc. 200 E. Randolph Street Suite 1500 Chicago, IL 60601 ATTN: AHIC Compliance Officer