IIHS crash tests and safety ratings
•Als PPTX, PDF herunterladen•
1 gefällt mir•934 views

Global NCAP Annual Meeting, November 2015

Empfohlen
Weitere ähnliche Inhalte
Was ist angesagt?
Was ist angesagt? (20)
Andere mochten auch
Ähnlich wie IIHS crash tests and safety ratings
Ähnlich wie IIHS crash tests and safety ratings (20)
Mehr von Global NCAP
Mehr von Global NCAP (20)
Kürzlich hochgeladen
Kürzlich hochgeladen (20)
IIHS crash tests and safety ratings
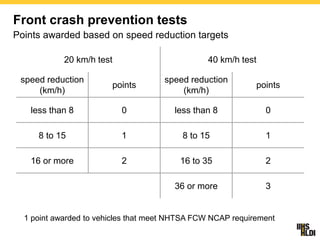
- 1. Front crash prevention tests Points awarded based on speed reduction targets 20 km/h test 40 km/h test speed reduction (km/h) points speed reduction (km/h) points less than 8 0 less than 8 0 8 to 15 1 8 to 15 1 16 or more 2 16 to 35 2 36 or more 3 1 point awarded to vehicles that meet NHTSA FCW NCAP requirement
- 2. iihs.org Update on Vehicle Safety Testing Plans at IIHS Global NCAP Annual Meeting Brasilia, Brasil November 2015 Adrian Lund, President, IIHS & HLDI
- 4. Front small overlap, beginning 2012 IIHS crashworthiness tests Front moderate overlap, beginning 1995 Side impact, beginning 2003 Rear crash (whiplash mitigation), beginning 2004 Roof strength, beginning 2009
- 5. Crash protection ratings by model year Improvements beginning in 1995 0% 20% 40% 60% 80% 100% 1995 1997 1999 2001 2003 2005 2007 2009 2011 2013 2015 0% 20% 40% 60% 80% 100% 1995 1997 1999 2001 2003 2005 2007 2009 2011 2013 2015 0% 20% 40% 60% 80% 100% 1995 1997 1999 2001 2003 2005 2007 2009 2011 2013 2015 0% 20% 40% 60% 80% 100% 1995 1997 1999 2001 2003 2005 2007 2009 2011 2013 2015 Moderate overlap front Roof strength 0% 20% 40% 60% 80% 100% 1995 1997 1999 2001 2003 2005 2007 2009 2011 2013 2015 Small overlap front Side impact Head restraints and seats poor marginal acceptable good
- 6. Death and injury reductions Good versus poor in IIHS tests Front offset with moderate overlap test – Fatality risk in head-on crashes is 46 percent lower Side impact crash test – Fatality risk in side impact crashes 70 percent lower – In addition to the benefit of adding side airbag protection for the head Rear impact test (seat only) – Neck injury risk in rear crashes is 15 percent lower – Risk of neck injury requiring 3+ months treatment is 35 percent lower
- 7. Front crash prevention testing and rating
- 8. Autobrake performance tests 12 mph 24 mph Volvo S60 with City Safety Subaru Outback with Eyesight
- 9. Front crash prevention ratings vehicles without forward collision warning or autobrake; or vehicles equipped with a system that doesn’t meet NHTSA or IIHS criteria vehicles earning 1 point for forward collision warning or 1 point in either 20 or 40 km/h test vehicles with autobrake that achieve 2-4 points for forward collision warning and/or performance in autobraking tests vehicles with autobrake that achieve 5-6 points for forward collision warning and/or performance in autobraking tests
- 10. Front crash prevention releases Update of FCP ratings May 2014 24 additional models evaluated 79 million Inaugural FCP ratings September 2013 74 models evaluated Estimated audience – 58 million
- 11. Front crash prevention ratings 2013 – 2015 models (as of October 2015) 137 39 11 10 113 51 28 19 81 56 39 33 0 20 40 60 80 100 120 140 160 Not qualified/not available Basic Advanced Superior 2013 2014 2015
- 12. Front crash prevention systems are preventing crashes reported to insurers Systems intended to prevent front to rear crashes 10 percent reduction, on average, in property damage liability claims for vehicles with forward collision warning 14 percent reduction, on average, in PDL claims when FCW includes emergency autobrake 19 percent reduction in bodily injury claims for vehicles with FCW and autobrake If every vehicle had had FCW with autobrake in 2014, we estimate there would have been more than 700 thousand fewer PDL claims and more than 200 thousand fewer injury claims.
- 14. Hyundai Super Bowl advertisement
- 15. Ten manufacturers have committed to making automatic braking standard on new vehicles Joint IIHS & NHTSA announcement, September 11, 2015
- 16. All major auto manufacturers are now represented in the AEB standard fitment working group Late January target for agreement
- 17. Automaker working group for standard fitment of autonomous emergency braking (AEB) Work plan Document what is known about the benefits of AEB Choose a test protocol (or a group of protocols) from existing test protocols that can be used to verify the presence of the AEB functionality Determine what would constitute standardization of AEB – e.g. define the classes of vehicle to which AEB functionality would apply – e.g. by setting a minimum percent of a manufacturer’s fleet) Agree a timeframe for implementation of AEB functionality across the light vehicle fleet
- 18. Top Safety Pick and Top Safety Pick Plus TSP/TSP+
- 19. TSP and TSP+ criteria change to reflect market Higher bar encourages improvement 2013 models (effective Dec. 2012) – TSP required good ratings in moderate front, side, rear and rollover evaluations – TSP+ required at least acceptable performance in small overlap test 2014 models (effective Dec. 2013) – Acceptable rating in small overlap added to TSP – TSP+ required basic or better ratings for FCP 2015 models (effective Dec. 2014) – TSP requirement unchanged – Advanced or Superior FCP rating required for TSP+ 2016 models (effective Dec. 2015) – Rating of Good in all 5 crashworthiness tests for TSP – TSP+ also requires Advanced or Superior front crash prevention rating
- 21. Driver/passenger small overlap crash performance Driver-side impact Passenger-side impact 2015 Honda CRV 2015 Toyota RAV4 2013 Honda CRV 2013 Toyota RAV4 G M P G A P G P Upcoming test vehicles 2015 Mazda CX-5 2015 Subaru Forester 2015 Buick Encore 2015 Nissan Rogue 2016 Hyundai Tucson
- 22. Ratings for vehicles with 2013 side impact fatalities Not rated 3,680 69% Rating split by optional SAB fitment 170 3% Good 706 13% Acceptable 182 4% Marginal 161 3% Poor 422 8% Rated 1,471 28%
- 23. Detailed analysis of real-world side impact cases Vehicles with good IIHS rating NASS-CDS or CIREN side impacts Any occupant with AIS≥3 injury or fatality Included both near- and far-side occupants 109 total occupants found (2005-12 calendar years) These were evaluated and categorized based on injury- producing factors Estimated relevance of specific potential changes to the IIHS side impact test
- 24. 0% 10% 20% 30% 40% 50% 60% 70% Forward impact location Increased severity Adjust injury criteria (or use different dummy) Include far-side dummy Increase severity and forward impact location Increase severity and include far-side dummy Caseoccupantsaffected Driver sustained fatal injuries from contact with right door Driver sustained skull fracture, possibly from contact with window sill through or under the curtain AB. Driver sustained right-side skull fracture from contact with head of unbelted passenger 73 year old passenger sustained serious chest injuries Passenger sustained fatal chest injuries; ~20 cm more crush than test Relevance of specific IIHS side test changes 56 year-old driver with AIS 3 chest injuries
- 25. Next steps Reproduce some of the cases with crash tests, possibly including different dummies Priorities (won’t necessarily cover all of them): 1. Cases with striking vehicle aligned forward of B-pillar 2. Cases with larger and/or faster striking vehicle and forward alignment 3. Cases with far-side occupant
- 27. relevance in percent insurance claims reductions in percent multi-vehicle all crashes all injury Collision PDL BIL front crash prevention 20 29 16 2A 10A 15A 3B 14B 19B lane departure prevention 3 2 3 1C (1)C (38)C side view assist (blind spot) 7 10 5 2 10 16 adaptive headlights 2 <1 7 1 5 8 Theoretical relevance and insurance claim frequency reduction for 4 crash avoidance technologies Pooled estimates across vehicle models C = Mercedes & Mazda LDW only A = FCW without autobrake B = FCW with autobrake
- 28. Headlight testing – November 2015
- 29. Motivation for headlight evaluation program 20,181 annual crash deaths in dark/unlit and dark/lit conditions (2013 FARS) Insurance claims data point to benefits for curve adaptive headlights (2012 HLDI analyses of Mazda, Acura, Mercedes, Volvo claims) Human factors experiments have established link between detection performance and improved lighting FMVSS 108 does not establish identical real-world performance
- 30. Dynamic headlight test setup Vehicle approaches: – 150 m radius left and right curves at 65 km/h – 250 m radius left and right curves at 80 km/h – Straightaway at 65 km/h Record illuminance readings for: – Visibility—edges of road at 25 cm above ground – Glare—center of oncoming lane (1.1 m height) 250 m radius 150 m radius
- 31. Sample data: straightaway 3 different approaches for same vehicle 0 1 2 3 4 5 6 7 8 9 10 50 60 70 80 90 100 110 120 130 140 150 luxonRedgeofroad Distance (m)
- 32. 30 35 40 45 50 55 60 65 70 75 2014 Mercedes GLK 2014 BMW X5 2014 Cadillac CTS 2014 Mazda 3 HID 2014 BMW 535 2014 Acura RLX 2014 Dodge Durango R/T 2013 Mazda 3 HID 2014 Mercedes E350 2014 Infiniti Q50 2013 Mazda 3 Halogen Distanceat5lx(m) AFS on AFS off Observations: 1. AFS always helps 2. Wide range in performance between different vehicles (even with AFS) 3. Some headlights are better statically than others when swiveling Low beam 4 curve average Right edge of road
- 33. 0 20 40 60 80 100 120 140 2014 Mercedes GLK 2014 BMW X5 2014 Cadillac CTS 2014 Mazda 3 HID 2014 BMW 535 2014 Acura RLX 2014 Dodge Durango R/T 2013 Mazda 3 HID 2014 Mercedes E350 2014 Infiniti Q50 2013 Mazda 3 Halogen Distanceat5lx(m) Straight L side Straight R side Observations: 1. Very wide range of performance! Demonstrates how need for headlight rating system goes beyond improved curve illumination. 2. All systems better on R side, but some have bigger R vs L differences than others (narrower beam pattern) Low beam Straightaway measurements
- 34. Headlight evaluation program Vehicles will be tested dynamically and rated based on: – Straightaway visibility – Curve visibility – High and low beams – Acceptable glare Dynamic tests allow assessment of curve-adaptive systems Visibility metric is distance at which 5 lux illumination is achieved 25 cm above the road Glare threshold is pass/fail based on illumination at eye location of oncoming drivers Midsize sedans will be first test group; testing begins November 2
- 35. Next steps in front crash prevention testing
- 36. Vehicle and pedestrian movement Single-vehicle pedestrian crashes, front of passenger vehicle crashes 63% 29% 4% deaths 72% 4% 16%
- 37. Vehicle and cyclist pre-crash movement scenarios Most likely to result in death of cyclist crashes 9% 29% 3% 22% deaths 45% 22% 6% 2%
- 39. iihs.org More information and links to our YouTube channel and Twitter feed at iihs.org
Hinweis der Redaktion
- Timeline is still being developed but both groups will set specific performance criteria for manufacturers to meet their commitment. Audi BMW Ford General Motors Mazda Mercedes-Benz Tesla Toyota Volkswagen Volvo
- Timeline is still being developed but both groups will set specific performance criteria for manufacturers to meet their commitment. Below is a list of companies in the group: >BMW >Fiat-Chrysler >Ford >General Motors >Honda >Hyundai-Kia >Jaguar Land-Rover >Mazda >Mercedes-Benz >Mitsubishi >Nissan >Subaru >Tesla >Toyota >Volkswagen/Audi >Volvo
- Updated Sept 2015 – No Honda in blind spot FCP: -Warning: Honda, Mercedes, Volvo -Autobrake: Acura, Mercedes, Mazda, Subaru, Volvo AHL: Acura, Mazda, Mercedes, Volvo LDW: Mercedes, Mazda Blind spot: Acura, Mazda, Mercedes, Volvo