Indice Case-Shiller Marzo 2012
•
0 likes•255 views

Informe sobre la evolución de los precios de las viviendas por una de las instituciones mas relevantes del mercado americano.

Recommended
Recommended
More Related Content
Similar to Indice Case-Shiller Marzo 2012
Similar to Indice Case-Shiller Marzo 2012 (20)
More from WEB FINANCIAL GROUP INTERNATIONAL SL
More from WEB FINANCIAL GROUP INTERNATIONAL SL (20)
Recently uploaded
Recently uploaded (20)
Indice Case-Shiller Marzo 2012
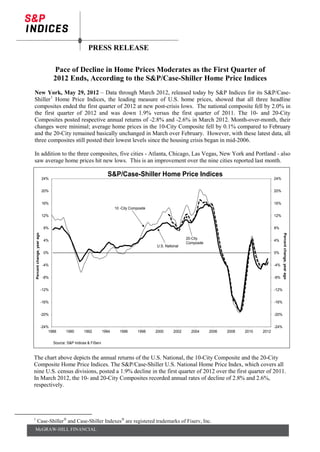
- 1. PRESS RELEASE Pace of Decline in Home Prices Moderates as the First Quarter of 2012 Ends, According to the S&P/Case-Shiller Home Price Indices New York, May 29, 2012 – Data through March 2012, released today by S&P Indices for its S&P/Case- Shiller 1 Home Price Indices, the leading measure of U.S. home prices, showed that all three headline composites ended the first quarter of 2012 at new post-crisis lows. The national composite fell by 2.0% in the first quarter of 2012 and was down 1.9% versus the first quarter of 2011. The 10- and 20-City Composites posted respective annual returns of -2.8% and -2.6% in March 2012. Month-over-month, their changes were minimal; average home prices in the 10-City Composite fell by 0.1% compared to February and the 20-City remained basically unchanged in March over February. However, with these latest data, all three composites still posted their lowest levels since the housing crisis began in mid-2006. In addition to the three composites, five cities - Atlanta, Chicago, Las Vegas, New York and Portland - also saw average home prices hit new lows. This is an improvement over the nine cities reported last month. S&P/Case-Shiller Home Price Indices 24% 24% 20% 20% 16% 16% 10 -City Composite 12% 12% 8% 8% Percent change, year ago Percent change, year ago 4% 20-City 4% Composite U.S. National 0% 0% -4% -4% -8% -8% -12% -12% -16% -16% -20% -20% -24% -24% 1988 1990 1992 1994 1996 1998 2000 2002 2004 2006 2008 2010 2012 Source: S&P Indices & FiServ The chart above depicts the annual returns of the U.S. National, the 10-City Composite and the 20-City Composite Home Price Indices. The S&P/Case-Shiller U.S. National Home Price Index, which covers all nine U.S. census divisions, posted a 1.9% decline in the first quarter of 2012 over the first quarter of 2011. In March 2012, the 10- and 20-City Composites recorded annual rates of decline of 2.8% and 2.6%, respectively. 1 Case-Shiller and Case-Shiller Indexes are registered trademarks of Fiserv, Inc. McGRAW-HILL FINANCIAL
- 2. “While there has been improvement in some regions, housing prices have not turned,” says David M. Blitzer, Chairman of the Index Committee at S&P Indices. “This month’s report saw all three composites and five cities hit new lows. However, with last month’s report nine cities hit new lows. Further, about half as many cities, seven, experienced falling prices this month compared to 16 last time. “The National Composite fell by 2.0% in the first quarter alone, and is down 35.1% from its 2nd quarter 2006 peak, in addition to recording a new record low. The 10- and 20-City Composite mimic these results; also down about 35% from their relative peaks and hit new lows. “There are some better numbers: Only three cities – Atlanta, Chicago and Detroit – saw annual rates of change worsen in March. The other 17 cities and both composites saw improvement in this statistic, even though most are still showing a negative trend. Moreover, there are now seven cities – Charlotte, Dallas, Denver, Detroit, Miami, Minneapolis and Phoenix – where the annual rates of change are positive. This is what we need for a sustained recovery; monthly increases coupled with improving annual rates of change. Once we see this on a broader level we will be able to say the market has turned around. “The regions showed mixed results for March. Twelve of the cities saw average home prices rise in March over February, seven saw prices fall and one – Las Vegas – was flat. The Composites were largely unchanged with the 10-City down only 0.1% and the 20-City unchanged. After close to six consecutive months of price declines across most cities, this is relatively good news. We just need to see it happen in more of the cities and for many months in a row. Since we are entering a seasonal buying period, it becomes very important to look at both monthly and annual rates of change in home prices in order to understand the broader trend going forward.” Source: S&P Indices and Fiserv McGRAW-HILL FINANCIAL
- 3. The chart on the previous page shows the index levels for the U.S. National Home Price Index, as well as its annual returns. As of the first quarter of 2012, average home prices across the United States are back at their mid-2002 levels. With this report, the National Index level hit a new low, down 2.0% over the first quarter of 2012 and 1.9% below the first quarter of 2011. Source: S&P Indices and Fiserv The chart above shows the index levels for the 10-City and 20-City Composite Indices. As of March 2012, average home prices across the United States are back to the levels where they were in late 2002 for the 20-City Composite and early 2003 levels for the 10-City Composite. Measured from their June/July 2006 peaks, the decline for both Composites is approximately 35% through March 2012. For both Composites, March’s levels are new lows in the current housing cycle. In March 2012, 12 MSAs posted monthly gains, seven declined and one remained unchanged. Phoenix posted the largest annual rate of change, +6.1%, while home prices in Atlanta fell the most over the year, down 17.7%. Atlanta, Cleveland, Detroit and Las Vegas were the four cities where average home prices were below their January 2000 levels. With an index level of 102.77 Chicago is not far behind. McGRAW-HILL FINANCIAL
- 4. The table below summarizes the results for March 2012. The S&P/Case-Shiller Home Price Indices are revised for the 24 prior months, based on the receipt of additional source data. More than 25 years of history for these data series is available, and can be accessed in full by going to www.homeprice.standardandpoors.com 2012 Q1 2012 Q1/2011 Q4 2011 Q4/2011 Q3 Level Change (%) Change (%) 1-Year Change (%) U.S. National Index 123.33 -2.0% -3.9% -1.9% March 2012 March/February February/January Metropolitan Area Level Change (%) Change (%) 1-Year Change (%) Atlanta 82.53 -0.9% -2.5% -17.7% Boston 145.92 -0.2% -1.1% -1.0% Charlotte 109.40 1.2% -0.4% 0.4% Chicago 102.77 -2.5% -2.5% -7.1% Cleveland 94.65 0.4% -1.4% -2.4% Dallas 114.49 1.6% 0.0% 1.5% Denver 123.66 1.5% -0.9% 2.6% Detroit 66.66 -4.4% -0.8% 2.3% Las Vegas 89.87 0.0% -0.4% -7.5% Los Angeles 159.73 0.1% -0.8% -4.8% Miami 140.76 0.9% 0.6% 2.5% Minneapolis 109.21 -0.9% -1.0% 3.3% New York 157.87 -0.9% -1.0% -2.8% Phoenix 106.38 2.2% 1.2% 6.1% Portland 129.01 -0.5% -0.3% -2.8% San Diego 149.68 0.4% 0.2% -2.7% San Francisco 125.94 1.0% -0.7% -3.0% Seattle 131.23 1.7% -0.8% -1.3% Tampa 125.49 1.3% -0.2% -1.0% Washington 176.48 1.0% -1.3% -0.6% Composite-10 146.61 -0.1% -0.9% -2.8% Composite-20 134.10 0.0% -0.8% -2.6% Source: S&P Indices and Fiserv Data through March 2012 McGRAW-HILL FINANCIAL
- 5. Since its launch in early 2006, the S&P/Case-Shiller Home Price Indices have published, and the markets have followed and reported on, the non-seasonally adjusted data set used in the headline indices. For analytical purposes, S&P Indices publishes a seasonally adjusted data set covered in the headline indices, as well as for the 17 of 20 markets with tiered price indices and the five condo markets that are tracked. A summary of the monthly changes using the seasonally adjusted (SA) and non-seasonally adjusted (NSA) data can be found in the table below. 2012 Q1/2011 Q4 2011 Q4/2011 Q3 NSA SA NSA SA US National -2.0% 1.1% -3.9% -1.7% March/February Change (%) February/January Change (%) Metropolitan Area NSA SA NSA SA Atlanta -0.9% -0.4% -2.5% -2.0% Boston -0.2% 0.7% -1.1% 0.0% Charlotte 1.2% 0.6% -0.4% 0.2% Chicago -2.5% -0.6% -2.5% -0.7% Cleveland 0.4% 0.7% -1.4% -0.2% Dallas 1.6% 1.4% 0.0% 0.6% Denver 1.5% 1.1% -0.9% 0.3% Detroit -4.4% -2.1% -0.8% 0.1% Las Vegas 0.0% 0.5% -0.4% 0.1% Los Angeles 0.1% 0.4% -0.8% 0.0% Miami 0.9% 1.9% 0.6% 1.4% Minneapolis -0.9% 0.8% -1.0% 1.2% New York -0.9% -0.2% -1.0% -0.4% Phoenix 2.2% 2.7% 1.2% 2.2% Portland -0.5% 0.0% -0.3% 0.6% San Diego 0.4% 0.1% 0.2% 0.6% San Francisco 1.0% 0.7% -0.7% 1.1% Seattle 1.7% 1.9% -0.8% -0.4% Tampa 1.3% 1.6% -0.2% 0.8% Washington 1.0% 1.6% -1.3% -0.4% Composite-10 -0.1% 0.1% -0.9% 0.1% Composite-20 0.0% 0.1% -0.8% 0.2% Source: S&P Indices and Fiserv Data through March 2012 McGRAW-HILL FINANCIAL
- 6. About S&P Indices S&P Indices, a leading brand of the McGraw-Hill Companies (NYSE:MHP), maintains a wide variety of investable and benchmark indices to meet an array of investor needs. Over $1.45 trillion is directly indexed to our indices, which includes the S&P 500, the world's most followed stock market index, the S&P/Case- Shiller Home Price Indices, the leading measure of U.S. home prices, the S&P Global BMI, an index with approximately 11,000 constituents, the S&P GSCI, the industry's most closely watched commodities index, and the S&P National AMT-Free Municipal Bond Index, the premier investable index for U.S. municipal bonds. For more information, please visit: www.standardandpoors.com/indices. It is not possible to invest directly in an index. S&P Indices does not sponsor, endorse, sell, or promote any S&P index-based investment product. This document does not constitute an offer of services in jurisdictions where S&P Indices or its affiliates do not have the necessary licenses. S&P Indices receives compensation in connection with licensing its indices to third parties. For more information: Dave Guarino Communications S&P Indices dave_guarino@standardandpoors.com 212-438-1471 David Blitzer Managing Director and Chairman of the Index Committee S&P Indices david_blitzer@standardandpoors.com 212-438-3907 S&P Indices has introduced a new blog called HousingViews.com. This interactive blog delivers real-time commentary and analysis from across the Standard & Poor’s organization on a wide-range of topics impacting residential home prices, homebuilding and mortgage financing in the United States. Readers and viewers can visit the blog at www.housingviews.com, where feedback and commentary is certainly welcomed and encouraged. The S&P/Case-Shiller Home Price Indices are published on the last Tuesday of each month at 9:00 am ET. They are constructed to accurately track the price path of typical single-family homes located in each metropolitan area provided. Each index combines matched price pairs for thousands of individual houses from the available universe of arms-length sales data. The S&P/Case-Shiller National U.S. Home Price Index tracks the value of single-family housing within the United States. The index is a composite of single-family home price indices for the nine U.S. Census divisions and is calculated quarterly. The S&P/Case-Shiller Composite of 10 Home Price Index is a value-weighted average of the 10 original metro area indices. The S&P/Case-Shiller Composite of 20 Home Price Index is a value-weighted average of the 20 metro area indices. The indices have a base value of 100 in January 2000; thus, for example, a current index value of 150 translates to a 50% appreciation rate since January 2000 for a typical home located within the subject market. These indices are generated and published under agreements between S&P Indices and Fiserv, Inc. The S&P/Case-Shiller Home Price Indices are produced by Fiserv, Inc. In addition to the S&P/Case- Shiller Home Price Indices, Fiserv also offers home price index sets covering thousands of zip codes, counties, metro areas, and state markets. The indices, published by S&P Indices, represent just a small subset of the broader data available through Fiserv. For more information about S&P Indices, please visit www.standardandpoors.com/indices. McGRAW-HILL FINANCIAL