1. Abstract
The human population increase on the California
Channel Islands is expected to have an adverse
effect on the health of the surrounding marine
ecosystem due to increased runoff and pollution.
Our investigations took place near Avalon Bay,
Catalina Island, CA. This study examines the impact
of human pollution at locations 1 and 2 miles from
the bay. We hypothesized that waters closer to
shore would exhibit stronger indications of
contamination than those farther from shore. Field
measurements and sample collection from 4
locations at equal depths along the coast provided
data on levels of nitrate, ammonium, chlorophyll,
total microorganisms, and fecal coliform bacteria.
Higher levels of biomass were found as the distance
increased from the population center at Avalon,
suggesting that depressed biomass near the bay was
due to the human caused pollution. This is
supported by increased levels of ammonium and
high abundances of fecal coliform bacteria. Our
findings indicate that waters closer to the bay are
more negatively impacted by factors associated with
human influence than waters farther from the bay.
In future work we hope to include the effects of
local currents on parameters in the water column.
IMPACT OF HUMAN ACTIVITY ON WATER QUALITY IN
AVALON BAY OFF THE COAST OF CATALINA ISLAND, CA
Dennis Su1, Kevin Kim1, Jordan Hoese1, Alexander Gregath1, Elaine Krebs1, Lillian But, Emily Chug, Johanna B. Holm, Karla B. Heidelberg, Wiebke Ziebis
Methods & Results
NRDC Annual Beach Report: Closing and Advisory Days Hit Second-Highest Level in Decades. Natural
Resources Defense Council. Natural Resources Defense Council, 29 June 2011. Web. 8 June 2012.
<NRDC Annual Beach Report: Closing and Advisory Days Hit Second-Highest Level in Decades>.
Dickinson G, Lim KY, Jiang SC. Quantitative Microbial Risk Assessment of Pathogenic Vibrios in Marine
Recreational Waters of Southern California. Appl Environ Microbiol 79(1): 294-302, 2013.
Francisco DE, Mah RA, Rabin AC. Acridine orange-epifluorescence technique for counting bacteria in
natural waters. T Am Microsc Soc 92 (3): 416-421, 1973.
McQuaig S, Griffith J, Harwood V. Association of fecal indicator bacteria with human viruses and
microbial source tracking markers at coastal beaches impacted by nonpoint source pollution. Appl
Environ Microbiol 78(18): 6423-6432, 2012.
Boehm A, Fuhrman J, Mrse R, et al. Tiered approach for identification of a human fecal pollution source
at a recreational beach: case study at Avalon Bay, Catalina Island, California. Environ Sci Technol 37(4):
673-680, 2003.
Fuhrman JA, Eppley RW, Hagstrom A, et al. Diel variations in bacterioplankton, phytoplankton, and
related parameters in the Southern California bight. Mar Ecol Prog Ser 27: 9-20, 1985.
Hecky RE, Kilham P. Nutrient limitation of phytoplankton in freshwater and marine environments: a
review of recent evidence on the effects of enrichment. Limnol Oceanogr, 33(4, part 2): 796-822, 1988.
John DE, Lopez-Diaz JM, Cabrera A, et al. A day in the life in the dynamic marine environment: how
nutrients shape diel patterns of phytoplankton photosynthesis and carbon fixation gene expression in the
Mississippi and Orinoco River plumes. Hydrobiologia 679: 155-173, 2012.
Grasshoff K, Ehrhardt M, Kremling K. Methods of Seawater Analysis. Weinheim: Verlag Chemie, 1983.
Epstein SS, Rossel J. Enumeration of sandy sediment bacteria: search for optimal protocol. Mar Ecol
Prog Ser 117: 289-298, 1995.
Jones MN. Nitrate reduction by shaking with cadmium. Water Res 18(5): 643-646, 1985.
Hall POJ, Aller RC. Rapid, small volume,flow injection analysis for CO2 and NH4+ in marine and fresh
waters. Limnol Oceanogr 37(5): 1113-1119, 1992.
Ameel J, Ruzycki E, Alder P. Analytical chemistry and quality assurance procedures of natural water
samples (ed 6). Central Analytical Laboratory, NRRI Tech. Rep, 1998.
Ryther JH, Dunstan WM. Nitrogen, phosphorus, and eutrophication in the Coastal Marine Environment.
Science 171(3975): 1008-1013, 1971.
Welschmeyer NA. (1994). Fluorometric analysis of chlorophyll a in the presence of chorophyll b and
pheopigments. Limnol Oceanogr 39(8): 1985-1992, 1994.
Vives-Rego, J. Guindulain, T. Vazquez-Dominguez, E, et al. Assessment of the effects of nutrients and
pollutants on coastal bacterioplankton by flow cytometry and SYTO-13 staining. Microbios 98: 71-85,
1999.
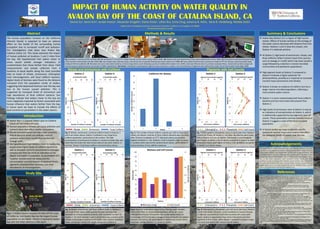
Fig 1. Catalina Island is located 20 miles off the coast
of California, and Avalon Bay has the largest human
population on the island. Station 2 represents Avalon
Bay with the other stations a mile apart.
Department of Biological Sciences, University of Southern California, Los Angeles, CA 90089
1Contributed equally to poster
Fig 6: Biomass levels were measured by filtering water samples
onto a GF/F filter to retrieve phytoplankton, while cell counts
reflected the fraction of microbes seen under epifluorescence
microscopy. Cell Counts were averaged across all depths per station.
Biomass and cell counts were highest at Station 4 as shown above,
and lower among Stations 1-3, closer to Avalon.
Acknowledgements
Avalon Bay (Station 2) is a region of high human
impact. Effects of human activity on the ecology of
the water column decrease with distance from this
station. Stations 1 and 3 show less impact, and
Station 4 is relatively pristine.
At Station 2, high levels of ammonium, nitrate, and
fecal coliforms reflect nutrient input from sources
such as sewage or runoff, which may have caused a
surge followed by a decline in marine microbial
communities and planktonic populations.
High pigment levels at Station 2 compared to
Station 4 indicate a higher potential for
photosynthesis, possibly as a response to increased
nutrient input (ammonium and nitrate).
Station 4 shows no evidence of coliform but has a
larger marine microbial population, reflecting a
more pristine water column.
Station 1 is more contaminated with fecal coliform
bacteria and has more total cells present than
Station 3.
High levels of ammonium seen at Station 2 may be
an indication of eutrophication at Station 3, which
is additionally supported by low pigments and cell
counts. These parameters and low biomass levels at
Station 3 suggest a crash of the local microbial
population.
In future studies we hope to identify specific
sources of nutrient input and currents that affect
the biological health of waters near the bay.
References
Summary & Conclusions
A B C D
Study Site
0
5
10
15
20
25
30
35
40
1 2 3 4
NumberofColiformColonies
Station
Coliforms Per Station
Fig. 5: The number of fecal coliform colonies per 100 mL from each
station are shown. Colonies of fecal coliform bacteria were counted
after 36 hours incubation at 37°C. Bacterial colony counts were
highest at Station 2 – 5m. Stations 1 and 3 showed a slight increase
in numbers with more at the southernmost station, while Station 4
lacked evidence of any coliform presence.
Introduction
Avalon Bay is a popular tourist spot on Catalina
Island off the California coast.
Human population centers can cause pollution and
nutrient input that affect marine ecosystems.
Nitrate and ammonium are two major nutrients
that at elevated levels can indicate input of
polluted waters from runoff after rainfall and
sewage spills.
We hypothesized that stations closer to Avalon Bay
would show higher levels of coliform bacteria as
well as elevated nutrient concentrations (nitrogen
compounds) that can serve as indicators of the
degree and extent of pollution. As parameters of a
’healthy’ environment we measured the
concentration and distribution of photosynthetic
pigments, phytoplankton biomass, and total
abundances of microorganisms.
0
0.2
0.4
0.6
0.8
1
1.2
0
10
20
30
40
50
60
70
80
90
100
1 2 3 4
CellspermL(inmillions)
Biomass(mg)
Stations
Biomass and Cell Counts
Biomass (mg) Cell Count
E
Nitrate and Ammonium with Coliform Pigments with Cell Counts
Fig. 4: Nitrate, ammonium, and fecal coliform levels at Stations 1
and 3 are shown above. Both stations showed relatively low
abundances of fecal coliform bacteria, with increased numbers at
Station 1. For both Stations 1 and 3, ammonium was constant while
nitrate concentration increased with depth. Both stations exhibited
lower ammonium values with depth compared to Station 2.
0 4 8 12
0
5
10
15
20
25
30
0 10 20 30 40
Number of Coliform Colonies
Depth(m)
Concentration (µM)
Station 1
0 4 8 12
0
5
10
15
20
25
30
0 10 20 30 40
Number of Coliform Colonies
Depth(m)
Concentration (µM)
Station 3
Nitrate Ammonium Fecal Coliform
Fig. 8: Chlorophyll a, pheophytin, and cell count data from Stations
1 and 3 are shown. Stations 1 and 3 exhibited an overall increase
in pigment concentrations and total microbial cell counts with
depth. Station 3 appeared to have more chlorophyll and other
pigments at the surface, while Station 1 appeared to have a larger
microbial population than Station 3 at all depths.
0 0.5 1 1.5 2
0
5
10
15
20
25
30
0 20 40 60
Cell Counts in Millions
Depth(m)
Pigment Concentration (µg/mL)
Station 1
0 0.5 1 1.5 2
0
5
10
15
20
25
30
0 20 40 60
Cell Counts in Millions
Depth(m)
Pigment Concentration (µg/mL)
Station 3
PheophytinChlorophyll a Cell Count
Fig. 3: Nitrate, ammonium, and fecal coliform levels at Stations 2
and 4 are shown above. Station 2 exhibited a very large fecal
coliform population, particularly at the surface. The high
concentration of ammonium at Station 2, closest to Avalon Bay, was
more than ten times the next closest value at any other station. In
contrast, Station 4 had lower coliform and ammonium values.
0 4 8 12
0
5
10
15
20
25
30
0 10 20 30 40
Number of Coliform Colonies
Depth(m)
Concentration (µM)
Station 2
0 4 8 12
0
5
10
15
20
25
30
0 10 20 30 40
Number of Coliform Colonies
Depth(m)
Concentration (µM)
Station 4
Nitrate Ammonium Fecal Coliform
Fig. 7: Chlorophyll a, pheophytin, and cell count data from Stations
2 and 4 are shown. At Station 2, microbial abundances were lower
than at Station 4 across all depths. Chlorophyll a concentrations
were higher at Station 2 for all depths compared to Station 4, while
pheophytin levels were higher at Station 4 for all depths compared
to Station 2 as shown above.
0 0.5 1 1.5 2
0
5
10
15
20
25
30
0 20 40 60
Cell Counts In Millions
Depth(m)
Pigment Concentration (µg/mL)
Station 2
0 0.5 1 1.5 2
0
5
10
15
20
25
30
0 20 40 60
Cell Counts in Millions
Depth(m)
Pigment Concentration (µg/mL)
Station 4
PheophytinChlorophyll a Cell Count
F
N 33°22.400
W 118°20.796
N 33°21.715
W 118°19.981
AVALON BAY
N 33°21.047
W 118°19.389
N 33°20.390
W118°18.723
Fig. 2 provides a summary of the methods. 2A: We sampled at 5, 10, and 25 m depth intervals at each station using a Niskin bottle. 2B: Nitrate levels were determined using a spectrophotometer (Jones 1985). 2C: Ammonium levels were detected using
a flow injection method (Hall and Aller 1992). 2D: Live samples were collected using a vertical tow net to quantify total biomass levels (Ameel et al 1998). 2E: Fecal coliform bacteria were cultured on media at 37°C for 36 hours and enumerated using
ColiQuant MF kits (LaMotte). 2F: Microbial cell counts were determined by acridine orange direct counts following a protocol modified after Epstein et al. (1995). Cells were filtered onto 0.2 µm black nuclepore filters, stained with acridine orange and
counted using an epifluorescence microscope at 1000x magnification. Not shown: Chlorophyll and pheophytin pigments were extracted in acetone, and concentrations of pigments were determined using a Turner fluorometer (Vives-Rego 1999).