Healthcare IT Services Insights - January 2016
•
1 gefällt mir•783 views

The document discusses healthcare information technology M&A activity in the second half of 2015. Some key points: - 209 HCIT deals were announced in 2015, similar to the 198 announced in 2014. Acquirers sought solutions for electronic health records, meaningful use, and issues affecting revenue cycles. - Strategic buyers represented 93% of deals, with financial buyers representing the remaining 7%. - Approximately 25% of M&A activity involved cloud-based solutions for areas like EHRs, imaging storage, and billing due to their lower costs and elasticity. - The largest deal was the $2.7 billion acquisition of MedAssets by Pamplona Capital Management, expected to close in late January

Empfohlen
Empfohlen
Weitere ähnliche Inhalte
Was ist angesagt?
Was ist angesagt? (20)
Ähnlich wie Healthcare IT Services Insights - January 2016
Ähnlich wie Healthcare IT Services Insights - January 2016 (20)
Mehr von Duff & Phelps
Mehr von Duff & Phelps (20)
Kürzlich hochgeladen
Kürzlich hochgeladen (20)
Healthcare IT Services Insights - January 2016
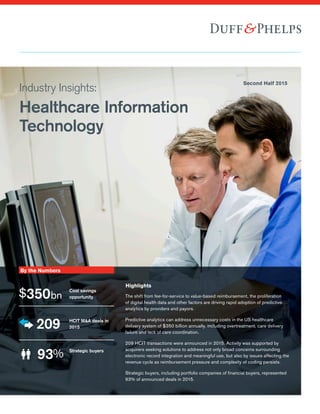
- 1. Industry Insights: Healthcare Information Technology Second Half 2015 By the Numbers Highlights $350bn Cost savings opportunity 209 HCIT M&A deals in 2015 93% Strategic buyers The shift from fee-for-service to value-based reimbursement, the proliferation of digital health data and other factors are driving rapid adoption of predictive analytics by providers and payors. Predictive analytics can address unnecessary costs in the US healthcare delivery system of $350 billion annually, including overtreatment, care delivery failure and lack of care coordination. 209 HCIT transactions were announced in 2015. Activity was supported by acquirers seeking solutions to address not only broad concerns surrounding electronic record integration and meaningful use, but also by issues affecting the revenue cycle as reimbursement pressure and complexity of coding persists. Strategic buyers, including portfolio companies of financial buyers, represented 93% of announced deals in 2015.
- 2. Duff & Phelps 2 Duff & Phelps - Healthcare Information Technology - Second Half 2015 Duff & Phelps 2 What’s Driving M&A Activity in Predictive Analytics for Healthcare? In recent years awareness of the power of predictive analytics has swelled. It has been the focal point of reporting by news outlets such as CNN and CBS and is at the core of the trading strategies that generated billions of dollars of profits discussed in the best-selling books Flash Boys and Dark Pools. Algorithms which lie at the center of predictive modeling are being used increasingly in the healthcare industry to reduce costs and improve outcomes for patients and populations. The shift from fee-for-service to value-based reimbursement, the proliferation of digital health data and other factors are driving rapid adoption of predictive analytics by providers and payors. Venture capital funding of predictive analytics companies has ballooned since 2011. More recently, M&A activity in the sector has increased. Given the industry’s supernormal growth and high level of fragmentation, we expect M&A to accelerate in 2016 and beyond. A More Robust Assessment than Traditional Healthcare Predictive analytics is the process of learning from historical data in order to make predictions about the future (or any unknown).1 It relies on applications driven by algorithms that recognize patterns in vast amount of data. In healthcare, predictive analytic applications draw inferences about the probability of patients developing certain conditions or the worsening of existing conditions. Deployment of predictive analytics in healthcare is still in its early stages and it differs in many ways from traditional healthcare protocols. In traditional healthcare, the patient is diagnosed utilizing a deterministic model and medical treatment is prescribed based on molecular data. Predictive analytics can deliver a more robust diagnosis by leveraging a probabilistic model that uses more comprehensive data for decision making – including molecular, demographic, social, administrative, clinical and patient generated/ reported information. Shift from Fee-For-Service to Value-Based Healthcare The application of predictive analytics has accelerated due to the emphasis on value-based reimbursement enshrined in the Patient Protection and Affordable Care Act (ACA) coupled with the abundance of digital data now being collected in Electronic Health Records (EHRs). In January 2015 the Centers for Medicare and Medicaid (CMS), the largest payor in the U.S., announced a goal of transitioning 85% of Medicare fee-for- service reimbursement into fee-for-value payments by the end of 20162 , with value including lowering costs, improving outcomes and creating a better patient experience3 . Commercial payors are following CMS’ lead by doing the same through capitation, bundled payments and similar reimbursement models. Rapid Growth of Big Data The amount of healthcare data captured and stored digitally is expected to grow at a CAGR of 63.1% catapulting from 500 petabytes in 2012 to 25,000 petabytes by 2020.1 This explosion in data is fueled in part by the financial incentives and penalties embedded in Health Information Technology for Economic and Clinical Health Act (HITECH Act) of 2009 which set standards for the certification of EHRs and the use of structured data in EHRs. For example by the end of 2015, providers must incorporate 55% of all laboratory tests as structured data within their EHR in order to continue to receive incentive payments and not incur Medicare reimbursement cuts.4 Shift Facilitated by: The Affordable Care Act RevenueMix Time Revenue Transition Period Value-Based Reimbursement Fee for Service Source: Health Catalyst, Harvard Business School 500 25,000 2012 2020 63.1% CAG R 0 5,000 10,000 15,000 20,000 25,000 30,000 Source: Rock Health, 2014 Expected Growth in Healthcare Data, 2012-2020 (petabytes)
- 3. Duff & Phelps 3 This is a leap forward as one of the biggest issues in analytics is data consistency. Obtaining timely data remains a challenge as it may take a provider several months to receive claims data detailing prior healthcare services and prescriptions filled by another provider due to reluctance to share data. As structured electronic health data grows and timeliness improves the ability to use predictive analytics expands dramatically. Huge Opportunity for Cost Savings Predictive analytics can address three categories that unnecessarily cost the healthcare delivery system in the U.S. approximately $350 billion annually: overtreatment, care delivery failure and lack of care coordination. Overtreatment due to the incentives created by the fee-for-service reimbursement model is estimated to cost $192 billion, failures of care delivery where patients do not receive appropriate medical treatment by the provider costs approximately $128 billion and lack of care coordination where, post discharge, patients are not properly cared for costs $35 billion.5 Diverse, Long-Term Drivers of Demand Payors have been applying predictive analytic tools for years using claims data to assess risk pools and determine insurance premiums. Under value based reimbursement, providers are now bearing increased levels of financial responsibility for outcomes causing them to turn to predictive analytics to stratify risks, prevent/lower readmissions, model for anomalies, more effectively manage patients with chronic diseases and fill care gaps.6 Risk stratification: Few healthcare providers did health forecasting until value based reimbursement increased their financial exposure. Today, providers can use predictive analytics to more reliably forecast the cost of care using risk stratification to compare forecasted costs to capitation payments from payors or, if the provider is reimbursed through payment bundling, episodes of care.7 Under the fee-for-value model, Accountable Care Organizations (ACOs) that meet thresholds on 33 value measures and reduce costs by more than a minimum amount qualify for highly attractive incentive payments. These payments can equal up to 50% of the amount the provider saves CMS above a benchmark related to their historical performance.8 In addition, after three years ACOs face financial penalties if they do not meet performance thresholds. Use of predictive analytics facilitates meeting these measures by ACOs. Readmission prevention and care gaps: CMS imposes financial penalties on hospitals with high rates of patient readmissions for a growing number of conditions. By combining predictive analytics and work flow automation tools, providers are able to identify patients with care gaps enabling case managers to connect with more patients in ways ranging from high-touch case management to telemedicine and web based education and coaching. Lowering care gaps and improving care during the 30 day transition away from the hospital reduces readmission rates. Chronic disease management: While financial forecasting and readmission prevention currently drive predictive modeling by providers, many believe the most important use of predictive analytics will be in population health management as chronic diseases account for as much as 75% of healthcare costs.9 Catastrophic costs: Because the health risk of individuals is always changing, a few outliers have been known to create catastrophic costs. Predictive analytics assists in factoring in these anomalies. Duff & Phelps - Healthcare Information Technology - Second Half 2015 ■ Overtreatment ■ Failures of Care Delivery ■ Lack of Care Coordination $350 Billion in Cost Savings Opportunities What’s Driving M&A Activity in Predictive Analytics for Healthcare? (continued) Source: Provider–Led Population Health Management, 2015
- 4. What’s Driving M&A Activity in Predictive Analytics for Healthcare? (continued) Duff & Phelps 4 Venture Capital and M&A Activity in the Sector Since 2011, venture funding of healthcare predictive analytics companies has grown at a CAGR 72.6%, with over $1.9 billion invested from 2011 through Q3 2014. The most active investors include Khosla Ventures, Merck Global Health Innovation Fund, Northwest Venture Partners, Sequoia Capital and Social Capital Partnership.10 The overwhelming majority of M&A deals in healthcare predictive analytics over the last two years have been by strategic acquirers (90%) such as IBM (NYSE:IBM), Welltok, ZirMed, Telligen and Millennium Health with the balance comprised of add-on acquisitions by financial buyers. M&A in this industry has been growing with 17 announced deals in 2015 (42% more than the 12 deals in 2014).11 Two notable transactions include IBM’s expansion into the space through simultaneously announced acquisitions of Phytel, Inc. and Explorys, Inc. on April 13, 2015. Another notable deal is the acquisition of Predilytics by Welltok to create the healthcare industry’s first analytics-driven consumer enterprise platform that not only identifies which consumers to target, but also engages them with the most relevant health improvement resources and incentives.12 Predictive analytics in healthcare is a young and rapidly advancing application with many venture backed companies that could become acquisition targets in the near future such as GingerJo, KYRUUS, RedBrick Health, Health Catalysts and SVBio. Even with IBM’s active M&A foray, dominant players have not yet emerged. The field remains highly fragmented. M&A activity will likely accelerate in 2016 and beyond as venture funds seek exits and industry players vie for market share, scale and marketplace power. Duff & Phelps - Healthcare Information Technology - Second Half 2015 $201M $300M $520M $902M 72.6% CAGR 2011 2012 2013 Q3 2014 $0 $100 $200 $300 $400 $500 $600 $700 $800 $900 $1,000 Source: Rock Health Predictive Analytics and Funding Database (includes deals >$2M), American Medical Informatics Association Venture Funding Announced Predictive Analytics M&A 2014-2015 90% 10% ■ Strategic Buyers ■ Financial Buyers Sources: 1. Rock Health, 2014 2. Centers for Medicare and Medicaid Services 3. Health Catalyst, Harvard Business School 4. Journal of Hospital Administration, 2013 5. Rock Health Predictive Analytics and Funding Database (includes deals >$2M), American Medical Informatics Association 6. Provider–Led Population Health Management, 2015 7. Health Catalyst, Harvard Business School 8. Provider–Led Population Health Management, 2015 9. Provider–Led Population Health Management, 2015 10. Rock Health Predictive Analytics and Funding Database (includes deals >$2M), American Medical Informatics Association 11. Capital IQ 12. Welltok, press release Source: S&P Capital IQ
- 5. Duff & Phelps 5 Duff & Phelps - Healthcare Information Technology - Second Half 2015 1. Matt, congratulations on a productive year at Arlington Capital Partners (Arlington) – the firm made three new platform investments, closed an add-on acquisition and exited from three portfolio companies. How does Arlington differentiate itself from similar sized private equity firms, few of which achieved this level of activity in 2015? Arlington is focused on investing in a core set of regulated industry verticals including healthcare, aerospace and defense and government contracting. My partners and I have worked together in these regulated industries for approaching 15 years. Our industry focus and thesis-driven investment strategy enables us to identify growth trends and companies of interest in advance of a transaction, and move quickly to complete transactions efficiently and with certainty. The majority of our transactions, including our recent Healthcare IT investment Ontario Systems, are recapitalizations in partnership with founding management. We believe that founders and senior management, who are retaining a significant ongoing ownership stake in their businesses, are looking for partners such as Arlington that are industry focused and can bring to bear value add through our domain expertise and breadth of industry relationships. 2. How has Arlington managed to find value in making new investments in what has been characterized as a seller’s market in 2015? Two of our three platform investments in 2015 were healthcare investments - Avalign Technologies and Ontario Systems. Both companies operate in segments of the broader healthcare industry that Arlington has been proactively pursuing investment opportunities within for several years - Avalign in the outsourced medical device manufacturing industry and Ontario in the revenue cycle management (RCM) software industry. Given our advanced knowledge of these healthcare segments and their strategic landscapes, we were well positioned to evaluate the investments efficiently and expeditiously identify opportunities for value creation. Both companies possess strong incumbent management teams that we are pleased to partner with as we look to continue growing the businesses. And in both cases, Arlington diligenced the opportunities in partnership with operating executives from our network that have subsequently joined the board of directors of the companies to support strategic growth initiatives. 3. As you mentioned, in September Arlington acquired Ontario Systems, a market leading provider of RCM software and solutions to healthcare providers, outsourced RCM and accounts receivable management (ARM) firms and government clients. What aspects of the business attracted you to Ontario Systems? Ontario Systems is benefiting from strong underlying growth trends in the healthcare payments marketplace. Over the last four years consumer payments to healthcare providers have grown approximately 200%, making patients the third largest payor to hospitals after Medicare and Medicaid. Ontario’s software products provide critical workflow and compliance solutions to healthcare providers, including six of the top ten hospital systems in the U.S. The company has an attractive recurring revenue model and is experiencing strong top line and profitability growth. Recently, Ontario has garnered several large hospital client wins and is well positioned to continue to increase its strong market position. 4. Is Ontario Systems purely an organic growth story for Arlington or can we expect to see it be an active acquirer too? Given the strong market growth opportunity available to Ontario, and the company’s leadership position, we plan to prioritize organic growth in the business. There are several areas of additional development within the company’s product portfolio that we are currently pursuing. However, at the same time, we continue to evaluate strategic acquisitions that would expand the company’s software solutions with complementary technology offerings. Within Arlington’s broader portfolio, add-on acquisitions have been a significant source of accretive growth for our companies. We have averaged approximately three add-on acquisitions per investment platform. Four Questions with Matt Altman of Arlington Capital Partners Sell Side Advisor majority owned by an investment group led by Oxford Financial Group Ltd., has been acquired by Arlington Capital Partners
- 6. 209 HCIT transactions were announced in 2015, as compared to 198 transactions announced in 2014. Activity in the sector was supported by acquirers seeking solutions to address not only broad concerns surrounding electronic record integration and meaningful use, but also by issues affecting the revenue cycle as reimbursement pressure and complexity of coding persists. Strategic buyers, including portfolio companies of financial investors, represented 93% of activity with new platform acquisitions by financial investors representing the remaining 7% of announced deals. Healthcare IT MA activity Due to the ever increasing amount of data being created, healthcare organizations have had a need to increase the amount of computation and storage of data within their infrastructure. The lower cost and elasticity of cloud based options as a solution to this problem has been clearly evident with approximately 25% of MA activity being related to cloud based solutions for a range of HCIT products including EHR’s, digital image storage, billing services among many others, according to SP Capital IQ. The passing of the Cybersecurity Act of 2015 including its nine legislative pages related to healthcare cybersecurity has also driven an increased focus on cybersecurity measures with a particular focus on cloud based solutions and is expected to drive further MA activity in the future. The largest transaction announced in the second half of 2015 was the $2.7 billion sale of MedAssets, Inc. (NasdaqGS:MDAS) to Pamplona Capital Management, which was announced in November and is expected to close by the end of January 2016. Pamplona intends to split MedAssets rolling the RCM business into its portfolio company, Precyse Solutions. The remaining operations, group purchasing and consulting, will be sold to the VHA-UHC Alliance. Dr. Jeremy Gelber, a partner at Pamplona who moved the firm into the healthcare space when he was hired in 2013 noted that “When you put that whole thing together, you’re giving the CFO accountability across the revenue cycle,”…“Marrying in clinical and financial information, that’s really important in the value-based world.” Other notable transactions in the seconf half of 2015 included the acquisition of Altegra Health by Change Healthcare (formerly known as Emdeon, Inc.) and the acquisition of Merge Healthcare by IBM. Source: SP Capital IQ 2012 - 2015 Healthcare IT MA Activity Duff Phelps 6 2015 HCIT MA Activity 0 50 100 150 200 250 2012 2013 2014 2015 163 44 13 138 58 21 110 74 14 135 59 15 2015 Transactions by Acquirer Type 7.2% 28.2% 64.6% ■ Strategic Buyers ■ Financial Buyer Add-On Acquisitions ■ Financial Buyer Platform Acquisitions ■ Strategic Buyers ■ Financial Buyer Add-On Acquisitions ■ Financial Buyer Platform Acquisitions Source: SP Capital IQ Duff Phelps - Healthcare Information Technology - Second Half 2015
- 7. On July 26 Change Healthcare (Emdeon) announced their acquisition of Altegra Health for approximately $910 million. “We are thrilled to welcome Altegra Health to Emdeon,” said Neil de Crescenzo, president and chief executive officer for Emdeon. “The powerful combination of our people and solutions will allow us to further leverage our Intelligent Healthcare Network, as we expand our customer relationships and help them thrive in the world of value-based healthcare. Altegra Health has created leading end-to-end solutions that provide health plans and other risk- bearing organizations with the data, insights and related services they need to expertly manage care, ensure appropriate reimbursement and engage individuals in improving their use of the healthcare system. Together, we can bring tremendous value to the markets, organizations and individuals we serve.” As the single largest financial and administrative network in the United States healthcare system, Change Healthcare’s Intelligent Healthcare Network reaches 750,000 physicians, 105,000 dentists, 60,000 pharmacies, 5,000 hospitals, 600 vendors, 450 laboratories and 1,200 government and commercial payers and processed approximately 8.1 billion transactions in 2014. The addition of Altegra will greatly increase the product offerings. On August 6, IBM announced its $995 million acquisition of Merge Merge Healthcare provides medical image handling and processing technology. “Merge will become part of IBM’s new Watson Health business unit, bolstering IBM clients’ ability to analyze and cross- reference medical images against 315 billion data points already in the Watson Health Cloud, including lab results, electronic health records, genomic tests, clinical studies, and other health-related data sources. Merge’s clients could compare new medical images with a patient’s medical history as well as populations of similar patients to detect changes and anomalies” IBM said in announcing the deal. “Insights generated by Watson could then help healthcare providers and researchers to pursue more personalized approaches to diagnosis, treatment, and monitoring of patients.” Merge’s technology platforms are used at more than 7,500 U.S. healthcare sites, as well as many of the world’s leading clinical research institutes and pharmaceutical firms to manage a growing body of medical images. IBM noted that, “It is anticipated that these organizations will look to use the Watson Health Cloud to surface new insights from a consolidated, patient-centric view of current and historical images, electronic health records, consumer contributed data from wearable devices and other related medical data, in a HIPAA-enabled cloud environment.” On September 16, Ontario Systems announced its acquisition by Arlington Capital Partners. Ontario Systems is a leading revenue cycle management (RCM) and accounts receivable management (ARM) technology and services provider. Michael Wolfe, Chief Technology Officer with Ontario Systems said, “Partnering with Arlington Capital was a natural step in our growth… …They bring a great deal of experience to the table in growing software companies. That expertise will help us accelerate our existing product strategy and deepen our ongoing commitment to innovation in the cloud for our customers.” Matt Altman, a Partner at Arlington Capital said, “Ontario Systems’ software serves as the primary workflow engine for its customers’ mission-critical RCM and ARM activities. With its dual focus on both optimal performance and robust compliance, OS solutions have led the industry and driven strong growth at the Company. We look forward to partnering with the Ontario Systems team to support the Company’s strategic growth trajectory in the healthcare RCM, ARM and government verticals.” After rejection of a bid to buy Accretive Health (OTCPK: ACHI) in July, Ascension Health Alliance, through its principal investment arm Ascension Ventures, teamed with TowerBrook Capital Partners to form an investment vehicle, which entered into a definitive agreement to invest $200 million in Accretive, according to the press release. The transaction is expected to be completed in the first quarter of 2016. Emad Rizk, M.D., President and Chief Executive Officer of Accretive Health, said, “Ascension has been a valued partner of Accretive Health for many years, and we are very excited to have the opportunity to deepen and extend our strategic alliance and expand Accretive’s business substantially. Over the last eighteen months, we have strengthened our infrastructure and operations, and we believe Ascension chose Accretive for its differentiated software and services model, scalable infrastructure and performance. We look forward to deepening our investments in our technology and service capabilities to further position Accretive to meet the needs of all healthcare providers as they adapt to the rapidly evolving healthcare landscape.” Dr. Rizk also stated, “We are confident that we can appropriately scale our model for the significant growth our agreement with Ascension provides.” Duff Phelps 7 MA Activity – HCIT Trends Duff Phelps - Healthcare Information Technology - Second Half 2015
- 8. IPO activity in the second half of 2015 continued to lag the bumper crop year of 2014 with only two IPOs priced in Q3 and Q4: Jayex Healthcare Limited (ASX:JHL) and Teladoc (NYSE: TDOC). PointClickCare, a Canadian cloud-based EHR for the senior care industry has filed an F-1 for IPO in early 2016. Jayex Healthcare, a microcap Australian company formerly known as Express Rx Limited, operates across a number of platforms including patient management, workflow solutions, pharmaceutical delivery and pharmaceutical dispensing systems to the healthcare and pharmacy industries in Australia and internationally. Jayex Healthcare raised $5.8 million USD in a deal priced on December 17, 2015 at $0.21/share and has traded in the range of $0.25 to $0.22 since the offering. Teladoc, Inc. is a provider of telehealth services via mobile devices, internet, video and phone to physicians and behavioral health professionals. TelaDoc raised $156.7 million in its IPO. The deal was priced on July 1, 2015 at $19.00 per share closing at $28.50 on the first day and has traded in the range of $15.61 to $34.82 since the offering and closed at $17.96 on December 31. TelaDoc’s lock-up period ended on December 28. Its owners include Cardinal Partners (13.3%), HLM Venture Partners (13.3%), Kleiner Perkins Caufield Byers (8.9%) and Icon Ventures (5.3%) Duff Phelps 8 HCIT IPO Activity* HCIT Index Quarterly LTM EBITDA Multiples Q4 2012 – Q4 2015 (1) (2) Historical Median 20.1x ■ Public Company Aggregate ■ Public Company Aggregate ■ Historical Median ■ Historical Median Consumer Driven Health and Wellness Quarterly LTM EBITDA Multiples Q2 2014 – Q4 2015 (1) (2) (1) EBITDA multiples greater than 100.0x are deemed not meaningful. (2) Multiples calculated based on the average daily LTM EBITDA multiple for the preceding fiscal quarter. As such, the multiples presented herein differ from the multiples presented elsewhere in this report. Source: SP Capital IQ (1) EBITDA multiples greater than 100.0x are deemed not meaningful. (2) Multiples calculated based on the average daily LTM EBITDA multiple for the preceding fiscal quarter. As such, the multiples presented herein differ from the multiples presented elsewhere in this report. Source: SP Capital IQ Historical Median 23.7x Duff Phelps - Healthcare Information Technology - Second Half 2015 *Source: SEC filings, Capital IQ, MergerMarket, Company Press Releases, and various news sources (e.g. NY Times Dealbook, the Deal, Wall Street Journal, etc.)
- 9. Consumer Driven Health and Wellness companies underperformed the broader market. In 2015, both the HCIT and Consumer Driven Health and Wellness (“CDHW”) indices underperformed the SP 500 index year-over-year. The HCIT index underperformed the SP 500 by 3%, while the CDHW index underperformed the SP 500 by 22%. In the second half of 2015, athenahealth (NasdaqGS:ATHN) was the leading performer in the HCIT index, gaining 40.5% closely followed by MedAssets with a 40.3% gain, and WebMD(NasdaqGS:WBMD) was the leading performer in the CDHW index, gaining 9.1%. Connecture (NasdaqGM:CNXR), Castlight Health (NYSE:CSLT) and Everyday Health (NYSE:EVDY) were the lowest performers in the CDHW index with Connecture, the lowest performer in the second half of the year, losing 68.5% in Q3 and Q4, despite a stronger start to the year. Castlight Health suffered a 47.5% decline since the end of Q2 despite meeting earnings expectations, continuing its downward trend from the start of the year with a total drop in 2015 of 64.7% due to future earnings expectations. Everyday Health also posted a significant drop of 52.9% in the second half, after missing Q3 earnings estimates and significantly revising down guidance for Q4 earnings. Valuations are coming under pressure. The median LTM EV/EBITDA multiple for the HCIT companies in the index decreased 15.6% from 20.3x at 6/30/2015 to 17.1x at 12/31/2015. The median LTM EV/EBITDA multiple for CDHW companies decreased 20.4% from 21.3x at 6/30/2015 to 16.2x at 12/31/2015 due to lower expectations of future performance of several companies driving down EV’s within the sector. Duff Phelps 9 Selected Publicly Traded Companies Stock Price Index (January 1, 2015 – December 31, 2015) Source: SP Capital IQ Note: Excludes TelaDoc as they IPO’ed in the second half of 2015 Stock Price Change (July 1, 2015 – December 31, 2015) Source: SP Capital IQ Consumer Driven Health and Wellness HCIT SP 500 Duff Phelps - Healthcare Information Technology - Second Half 2015
- 10. LTM Multiples Price % Change as of 12/31/2015 as of 6/30/2015 Change in Multiples Company Name Ticker 12/31/2015 06/30/2015 Rev EBITDA Rev EBITDA Rev EBITDA HCIT Allscripts Healthcare Solutions, Inc. MDRX $15.38 12.4% 2.5x 35.9x 2.2x 48.1x 13.0% (25.3%) athenahealth, Inc. ATHN 160.97 40.5% 7.3x 94.2x 5.8x 74.4x 25.8% 26.7% Cerner Corporation CERN 60.17 (12.9%) 5.1x 18.3x 6.7x 23.7x (24.8%) (22.6%) Computer Programs Systems Inc. CPSI 49.75 (6.9%) 2.8x 14.9x 2.8x 11.5x 0.3% 29.3% Craneware plc CRW 11.76 13.7% 6.6x 22.0x 5.5x 18.7x 18.5% 17.8% Evolent Health, Inc. EVH 12.11 (37.9%) 5.2x NM 10.4x NM (49.6%) NA Healthstream Inc. HSTM 22.00 (27.7%) 2.8x 17.1x 5.1x 29.4x (45.3%) (42.0%) HMS Holdings Corp. HMSY 12.34 (28.1%) 2.4x 13.1x 3.5x 18.0x (31.1%) (26.8%) Inovalon Holdings, Inc. INOV 17.00 (39.1%) 5.3x 15.6x 9.8x 27.5x (46.3%) (43.2%) MedAssets, Inc. MDAS 30.94 40.3% 3.4x 12.1x 3.0x 10.2x 15.7% 18.3% Medidata Solutions, Inc. MDSO 49.29 (9.3%) 7.0x 67.1x 8.4x 74.7x (16.3%) (10.2%) National Research Corp. NRCI.B 35.82 8.5% 4.2x 14.6x 3.9x 12.9x 9.2% 12.8% Premier, Inc. PINC 35.27 (8.3%) 1.5x 4.2x 1.1x 3.3x 27.4% 28.8% Press Ganey Holdings, Inc. PGND 31.55 10.0% 5.9x 64.4x 6.5x 20.3x (9.3%) 218.0% Quality Systems Inc. QSII 16.12 (2.7%) 1.7x 15.2x 1.8x 17.1x (1.6%) (10.8%) Streamline Health Solutions, Inc. STRM 1.41 (49.6%) 1.2x NM 2.4x NM (49.1%) NA The Advisory Board Company ABCO 49.61 (9.3%) 3.6x 35.9x 4.8x 68.3x (26.1%) (47.4%) Mean (6.2%) 4.0x 29.6x 4.9x 30.5x (18.1%) (2.9%) Median (8.3%) 3.6x 17.1x 4.8x 20.3x (26.1%) (15.6%) Market Capitalization Weighted (4.0%) 4.9x 33.4x 5.7x 34.5x (14.0%) (3.2%) Consumer Driven Health and Wellness (1) Benefitfocus, Inc. BNFT $36.39 (17.0%) 6.0x NM 8.0x NM (24.7%) NA Castlight Health, Inc. CSLT 4.27 (47.5%) 3.8x NM 10.9x NM (65.5%) NA Connecture, Inc. CNXR 3.61 (65.8%) 1.3x 25.1x 2.9x NM (56.3%) NA Everyday Health, Inc. EVDY 6.02 (52.9%) 1.3x 13.7x 2.5x 28.6x (49.0%) (52.3%) HealthEquity, Inc. HQY 25.07 (21.8%) NM 42.2x NM 66.1x NA (36.1%) Healthways Inc. HWAY 12.87 7.4% 0.9x NM 0.9x 14.1x 0.1% NA IMS Health Holdings, Inc. IMS 25.47 (16.9%) 4.4x 17.0x 5.1x 21.3x (13.4%) (20.4%) Teladoc, Inc. TDOC 17.96 NA 8.4x NM NA NA NA NA WebMD Health Corp. WBMD 48.30 9.1% 3.2x 15.3x 3.1x 15.4x 3.6% (0.4%) Mean (25.7%) 3.7x 22.7x 4.8x 29.1x (23.4%) (22.2%) Median (19.4%) 3.5x 17.0x 3.1x 21.3x 11.6% (20.4%) Market Capitalization Weighted (17.2%) 3.9x 16.2x 4.6x 22.7x (14.7%) (28.7%) Source: SP Capital IQ Note: Revenue multiples greater than 11.0x and EBITDA multiples greater than 100.0x are deemed not meaningful. (1) TelaDoc (NYSE:DOC) IPO’ed during the second half of 2015. Selected Publicly Traded Companies – Continued Duff Phelps 10 Duff Phelps - Healthcare Information Technology - Second Half 2015 Definitions PEG Ratio: Price Earnings to Growth EBITDA: Earnings Before Interest, Taxes, Depreciation, and Amortization EPS: Earnings Per Share Enterprise Value: Market Capitalization + Total Debt + Preferred Equity + Minority Interest – Cash and Short-Term Investments LTM: Last Twelve Months
- 11. For more information please visit: www.duffandphelps.com About Duff Phelps Duff Phelps is the premier global valuation and corporate finance advisor with expertise in complex valuation, dispute and legal management consulting, MA, restructuring, and compliance and regulatory consulting. The firm’s more than 2,000 employees serve a diverse range of clients from offices around the world. MA advisory and capital raising services in the United States are provided by Duff Phelps Securities, LLC. Member FINRA/SIPC. Pagemill Partners is a Division of Duff Phelps Securities, LLC. MA advisory and capital raising services in the United Kingdom and Germany are provided by Duff Phelps Securities Ltd., which is authorized and regulated by the Financial Conduct Authority. Duff Phelps Copyright © 2016 Duff Phelps LLC. All rights reserved. Contact Us: Brooks Dexter Head of Healthcare MA, Los Angeles +1 424 249 1646 brooks.dexter@duffandphelps.com Jordan Lampos Vice President +1 424 249 1668 jordan.lampos@duffandphelps.com Laca Wong-Hammond Managing Director, New York +1 212 871 3915 laca.wong-hammond@duffandphelps.com West Clark Vice President +1 212 871 9739 west.clark@duffandphelps.com