SlideShare a Scribd company logo
1 of 100
A
Project Report on
7 P’s of Marketing in Special Reference to FMCG
Industry in India
Submitted in Partial Fulfillment for the Degree of
Bachelor of Business Administration
S.S. Jain Subodh PG (Autonomous) College
2019-20
SUBMITTED BY : SUBMITTED TO :
Deepak Kewlani (1841040) Dr. Tapasya Julka
Dharhohar Yadav (1841041) Head, Deptt. of Bus. Admn.
Dheeraj Agarwal (1841042)
Dhruv Kumar (1841043)
Dimple Faujdar (1841042)
BBA VI SEM.
CERTIFICATE
This is to certify that the Project Report entitled “7 P’s of Marketing in
Special Reference to FMCG Industry in India” is a record of project
work done by Dheeraj Agarwal student of BBA Sem VI under my
guidance and supervision and that it has not previously formed the basis
for the award of any degree, fellowship or associate ship.
Dr. Tapasya Julka
Head, Deptt. of Bus. Admn.
S.S. Jain Subodh P.G. (Autonomous) College
Jaipur
DECLARATION
Dheeraj Agarwal student of BBA Sem VI hereby declare that the project
work presented in this report is their own work and has been carried out
under the supervision of Dr. Tapasya Julka Head, Deptt. of Bus. Admn.
of S.S Jain Subodh P.G(Autonomous) College.
This work has not been previously submitted to any other university for
any examination.
Dheeraj Agarwal
S.S. Jain Subodh P.G. (Autonomous) College
Jaipur
ACKNOWLEDGEMENT
It is not often in life that you get a chance of appreciating and expressing
your feelings in black and white to thank the people who have been a
crucial part of your successes, your accomplishments, and your being what
you are today. I take this opportunity to first of all thank the Faculty at S.S.
Jain Subodh P.G.(Autonomous) College, especially Prof. K.B.Sharma,
Principal, and Dr. Chitra Rathore, Head, Department of BBA for
inculcating and instilling me the knowledge, learning, will-power, values
and the competitiveness and professionalism required by me as a
management student.
I would like to give special thanks to Dr. Tapasya Julka Head, Deptt. of
Bus. Admn. for educating me silver lining in every dark cloud. Her
enduring efforts, guidance, patience and enthusiasm have given a sense of
direction and purposefulness to this project and ultimately made it a
success.
I express my sincere and heartiest thanks to everyone who has contributed
towards the successful completion of the Project.
Last but not the least; I would like to thank my family: my parents for
supporting me spiritually throughout my life.
The errors and inconsistencies remain my own.
Dheeraj Agarwal
CONTENT PAGE NO.
CHAPTER 1: INTRODUCTION…………………………………..1-20
1.1 Introduction of FMCG…………………………………………………………...01
1.2 Overview of Marketing…………………………………………….……………02
1.3 7 P’s of Marketing…………………………………………………...…………..05
1.4 Key features of Marketing Mix……………………...………………….………..14
1.5 Developing a Marketing Mix……………………………………...……………..15
1.6 SWOT analysis of 7 P’s…………………………………………………………16
1.7 Buyers Behaviour………………………………………………………………. 17
CHAPTER 2: COMPANY PROFILE………………………….…21-31
2.1 Company Background……………………………………..…………………….21
2.2 Study of HUL Bath soap…………………………………………..……………..23
2.3 SWOT analysis of HUL………………………………………………….………28
2.4 Competitors analysis…………………………………………………………….29
2.5 Market share of HUL Bath soap product………………………………..………..30
CHAPTER 3: REVIEW OF LITERATURE…………...…….…..32-39
3.1 From National and International Journals, Books & Newspapers…………..…....32
CHAPTER 4: RESEARCH METHODOLOGY………………...40-44
4.1 Title………………………………………………………………………..…….40
4.2 Objectives of the study…………………………………………………….…….40
4.3 Research Design…………………………………………………………………41
4.4 Collection of Data………………………………………………………………..42
4.5 Sampling………………………………………………………………………...43
4.6 Limitations of Study…………..……………………………………………...….44
CHAPTER 5: ANALYSIS AND INTERPRETATION……….....45-75
5.1 Respondents Personal Profile…………….……………………...……..………..45
5.2 Analysis of Buyer’s Behaviour…………………………………………………..68
5.3 Retailers Data Analysis…………………………...…...…………………...……73
CHAPTER 6: SUMMARY OF FINDINGS……...……………….76-82
6.1 Findings………………………………………………………………….………76
6.2 Conclusion…………...………………………………………………………….77
6.3 Recommendations...……………………………………………………………..78
6.4 Scope of Further Study…………………………………………………………..82
APPENDIX………………………………..………………………..83-87
Bibliography……………………………………………………………………….....83
Questionnaire………………………………………………………………………...85
CHAPTER 1
INTRODUCTION
OF THE TOPIC
1
1.1 INTRODUCTION OF FMCG
Meaning of FMCG -
FMCG refers to Fast Moving Consumer Goods, requirement for daily or frequent use.
Typically, a consumer buys these goods at least once a month. The sector covers a wide
gamut of products such as detergents, toilet soaps, toothpastes shampoos, creams,
powders, food products, confectioneries, beverages, cigarettes. Typical characteristics
of FMCG products.
Fast-moving consumer goods (FMCG), also called consumer packaged goods (CPG),
refer to products that are highly in-demand, sold quickly, and affordable. Such items
are considered “fast-moving” as they are quick to leave the shelves of a store or
supermarket because consumers use them on a regular basis.
The goods are divided into two distinct categories. One is Consumer Durable Goods
which have longer life and used for a long time. E.g. Washing machine, Ovens,
Automobile Cars, Two wheelers etc. The fast-moving consumer goods are the goods
which are quickly sold and comparatively low cost. These fast-moving consumer goods
include toiletries, drugs, processed foods etc. “The Fast-Moving Consumer Goods
industry covers the household items that you buy when shopping in the supermarket or
a pharmacy. Fast moving‟ implies that the items are quick to leave the shelves and also
tend to be high in volume but low in cost items. The products are ones that are essential
items we use day in and day out”.
Emergence of Fast-Moving Consumer Goods
The fast-moving consumer goods (FMCG) industry has been shaped over the past five
decades. This industry is the foundation of the Indian economy. It encompasses every
aspect of human life. This FMCG market in India is fragmented. Almost 50 per cent of
the market opts for non-branded homemade products. The remaining is being served by
the branded products. Because fast-moving consumer goods have such a high turnover
rate, the market is not only very large, it is also very competitive. Some of the world's
largest companies compete for market share in this industry including Dole, Coca-
Cola, Unilever, Procter & Gamble, Nestlé, Kellogg's, and General Mills. Companies
like these need to focus their efforts on marketing fast-moving consumer goods to entice
2
and attract consumers to buy their products. That's why packaging is a very important
factor in the production process. The logistics and distribution systems often require
secondary and tertiary packaging to maximize efficiency. The unit pack or primary
package is critical for product protection and shelf life, and also provides information
and sales incentives to consumers. FCMGs are sold in large quantities, so they are
considered a reliable source of revenue. This high volume of sales also offsets the
low profit margins on individual sales as well. As investments, FMCG stocks generally
promise low-growth but are safe bets with predictable margins, stable returns, and
regular dividends.
Characteristics of FMCG Products:
 Individual items are of small value. But all FMCG products put together account
for a significant part of the consumer's budget.
 The consumer keeps limited inventory of these products and prefers to purchase
them frequently, as and when required. Many of these products are perishable.
 The consumer spends little time on the purchase decision. Rarely does he/she
look for technical specifications (in contrast to industrial goods). Brand loyalties
or recommendations of reliable retailer/dealer drive purchase decisions.
 Trial of a new product i.e. brand switching is often induced by heavy
advertisement, recommendation of the retailer or neighbors/friends.
 These products cater to necessities, comforts as well as luxuries. They meet the
demands of the entire cross section of population. Price and income elasticity of
demand varies across products and consumers.
1.2 INTRODUCTION OF MARKETING
In simple words marketing means exchange of goods and services for some
consideration. In the primitive period in the absence of any currency goods were
exchanged for goods or services which are referred to as Barter system.
Marketing is a process through which goods and services move from concept to the
customer. It includes the coordination of four elements called the 4 P's of marketing:
(1) Product identification and development.
(2) Price determination,
(3) Distribution channel selection to reach the customer's Place, and
3
(4) Formulation and execution of a Promotional strategy.
Customer needs and satisfaction are the basis of marketing.
According to Theodore C. Levitt, retired Professor from Harvard University
Marketing and selling are two different concepts. "Selling concerns itself with the
tricks and techniques of getting people to exchange their cash for your product
According to Rd. Philip Kotler,2 the Marketing Guru, “Marketing is the science and
art of exploring, creating, and delivering value to satisfy the needs of a target market at
a profit. Marketing identifies unfulfilled needs and desires. It defines measures and
quantifies the size of the identified market and the profit potential. It pinpoints which
segments the company is capable of serving best and it designs and promotes the
appropriate products and services.”
“Marketing’s key processes are:
(1) opportunity identification,
(2) new product development,
(3) customer attraction,
(4) customer retention and loyalty building, and
(5) order fulfilment
A company that handles all of these processes well will normally enjoy success. But
when a company fails at any one of these processes, it will not survive.”
American Marketing Association defines marketing as “the performance of business
activities that direct the flow of goods and services from producer to consumer or use”.
Marketing encompasses identifying and translating consumers‟ need and desires that
the consumer expects from the product. Creation of demand for the products and
services for the consumers is also a part of marketing effort.
In order to achieve the set goal, the management has to formulate a strategy for the
targeted market. It is in this context necessary to understand what is strategy.
Strategy:
According to Business Dictionary, Strategy is:
“A method or plan chosen to bring about a desired future, such as achievement of a goal
or solution to a problem.”
4
The Marketing Mix
Before discussing about these Ps, one must note that all the Ps is interrelated. A decision
to make change in one of them affects the rest. Suppose the company wants to launch
low- priced product, the promotion has to follow suit and the same channels where
premium products are sold cannot be used to provide access to this segment of
customers. Second, each element of marketing mix contains countless variables. Third,
the 4Ps of marketing have been the key areas where marketing managers allocate scarce
corporate resources to achieve the business objectives. Fourth, to show the differences
between services and physical products, Booms and Bitner suggested the extension of
the 4Ps framework to include three additional factors: People, Physical evidence and
Process. Services have unique characteristics: intangibility, heterogeneity,
inseparability and perish ability, and thus, require a different marketing mix. Fifth, we
are considered of the view that whether it is products marketing or services marketing,
marketing mix must include all the 7Ps. Finally, the marketing mix will vary from
industry to industry and organisation to organisation because of different offerings.
A study by Rafiq and Ahmed (1995) found that there is a high degree of dissatisfaction
with the 4Ps, however, 4Ps is thought to be most relevant for introductory marketing
and consumer marketing. The result also suggests that the 7Ps framework has already
achieved a high degree of acceptance as a generic marketing mix among our sample of
respondents. Rafiq and Ahmed (1995) also highlighted the strengths and weaknesses of
the 4Ps and 7Ps mixes.
The discipline of marketing is split into four umbrella categories which we call the
“4ps”: Price, Product, Place and Promotion (McCarthy, 1960). Service based
organisations sometimes add three other “PS”: People, Process and Physical evidence
to the four 4ps.
5
Table 1.1 Strengths and Weakness of 7 P’s & 4 P’s
7 P’S 4 P’S
STRENGTHS
 More comprehensive
 More detailed
 More refined
 Broader perspective
 Includes participants/
people
 and process
 It is a model
 Standardisation
 Signals marketing theory
 Simplicity and ease of
 Understanding
 Easy to memorise
 Good pedagogic tool,
especially for
 introductory marketing
 Useful conceptual
framework
 Ability to adapt to various
problems
WEAKNESSES
 More complicated
 Extra elements can be
 incorporated in 4Ps
 Controllability of the three
new elements
 Too simple, not broad
enough
 Lacking people,
participants and process
 Physical evidence
 Relationship marketing
Service
 Lack of
connection/integration
between variables
 Static nature of 4Ps
1.3 7 P's OF MARKETING
The marketing mix is the tactical or operational part of a marketing plan. The
marketing mix is also called the 4Ps and the 7Ps. The 4Ps are price, place., product
and promotion.
The services marketing mix is also called the 7Ps and includes the addition of process,
people and physical evidence.
The marketing mix is the set of controllable tactical marketing tools — product,
price, place and promotion — that the firm blends to produce the response it wants
in the target market.
- Kotler and Armstrong (2010).
6
PRODUCT
Product means the goods-and-services combination the company offers to the target
market.
-Kotler and Armstrong (2010).
For many a product is simply the tangible, physical item that we buy or sell. You can
also think of the product as intangible i.e. a service.
A product offering has three independent elements (Kotler et al call it as 5 product
levels). The first level is the core product – consisting of core benefit (a fundamental
benefit – a tyre for a car). The second level comprises of supplemental features (Kotler
calls them as expected and augmented product levels).
Products can be consumer products and business products. Consumer goods can be
classified as fast moving (soap, shampoo, etc.) and durables (washing machine, TV,
microwave, etc.); and Convenience products (relatively inexpensive, frequently bought,
with limited efforts, and not much fussy about brand — salt, bread, etc.), Shopping
products (bought after investing some time and effort – furniture, washing machine,
fridge, TV, camera, shoes etc), Speciality products (bought after spending considerable
time and effort — Mont Blanc pen, expensive men’s suit, jewellery, first new car, an
apartment, etc.), and unsought goods (consumers are unaware of, or aware but do not
want to buy now, and solving sudden problems – video telephone, Encyclopedias
Britannica, and nearest mechanic when car gets punctured).
Fig. 1.2 Product Life Cycle
7
Table 1.2 Product Life Cycle
Stage 1: Introduction
Introducing a new product where it’s unknown and products are small. The price is
often higher as distribution is limited, and promotion is personalized.
Stage 2: Growth
Here, the product is being bought and with volume, the price declines. Distribution
increases and promotion focuses on product benefits
Stage 3: Maturity
Here, the product competes with alternatives and pricing drops. Distribution becomes
intense (it’s available everywhere) and promotion focuses on the differences to
competitors’ products.
Stage 4: Decline
The product is reaching the end of its life and faces fewer competitors. The price may
rise and distribution has become selective as some distributors have dropped the
product. Promotion aims to remind customers of its existence.
8
With regard to new product development, a 7 steps process has to be followed – idea
generation, screening, concept testing, business analysis, product development, test
marketing, and commercialization.
PRICE
Price is the amount the consumer must exchange to receive the offering.
-Solomon et al (2009).
Pricing is one of the most important elements of the marketing mix, as it is the only
mix, which generates a turnover for the organisation. The remaining 3p's are the
variable cost for the organisation. Price must support these elements of the mix. Pricing
is difficult and must reflect supply and demand relationship. Pricing a product too high
or too low could mean a loss of sales for the organisation.
Price is an important element in marketing mix, because it directly relates to revenue
generation. Price is the one, which creates sales revenue – all other parts of marketing
mix are costs. Pricing has to be done whenever a new product is launched, its variant is
launched, a product is launched in new geographies, to counter inflationary trends, or
company bids for industrial customers.
Pricing Factors
Pricing should take into account following factors:
1. Fixed and variable cost
2.Competition
3. Company objectives
4. Proposed positioning strategies
5. Target group and willingness to pay
Table 1.3 Pricing Strategies
PRICING
STRATEGIES DEFINATION
Penetration Pricing
Here the organisation sets a low price to increase sales
and market share. Once market share has been captured
the firm may well then increase their price.
9
Skimming Pricing
The organisation sets an initial high price and then
slowly lowers the price to make the product available
to a wider market. The objective is to skim profits of
the market layer by layer.
Competition Pricing
Setting a price in comparison with competitors. In
reality a firm has three options and these are to price
lower, price the same or price higher than competitors.
Product Line Pricing
Pricing different products within the same product
range at different price point
Premium Pricing
The price is set high to indicate that the product is
"exclusive"
Psychological Pricing
The seller here will consider the psychology of price
and the positioning of price within the market place.
Optional Pricing
The organisation sells optional extras along with the
product to maximise its turnover.
Cost Plus Pricing
The price of the product is production costs plus a set
amount ("mark up") based on how much profit (return)
that the company wants to make. Although this method
ensures the price covers production costs it does not
take consumer demand or competitive pricing into
account which could place the company at a
competitive disadvantage.
Cost Based Pricing
This is similar to cost plus pricing in that it takes costs
into account but it will consider other factors such as
market conditions when setting prices.
Value Based Pricing
This pricing strategy considers the value of the product
to consumers rather than the how much it cost to
produce it. Value is based on the benefits it provides to
the consumer e.g. convenience, well being, reputation.
10
PLACE
Place includes company activities that make the product available to target
consumers.
-Kotler and Armstrong (2010).
Place is concerned with making available the products at a place where (s) he demands.
Thus, it is concerned with the store where the goods shall be displayed and sold, the
channels of distribution and logistics management through which goods will flow from
marketer to consumers.
Chain or path or route in the channels may be marketer to consumer (through factory
outlet or internet or company owned stores, or mail order business or door to door sales,
or multilevel marketing as done by Amway), or marketer to retailer to consumer, or
marketer to wholesaler (also referred to as distributors) to retailer to consumer, or agent
to wholesaler to retailer to consumer. The organisations between the marketer and the
consumers are known as intermediaries. Each one of them has an important role to play.
Fig. 1.4 Channel of Distribution
A Retailer is an important bridge with the consumers as he has much stronger personal
relationship with the consumer, holds a variety of products, offers consumers credit,
promote and merchandise products, prices the final product, and builds retailer ‘brand’
in the high street.
11
Type of Marketing Channel:
1. Intensive distribution:
Used commonly to distribute low priced or impulse purchase products eg chocolates,
soft drinks.
2. Selective distribution:
Only a few outlets in an area are to distribute a product. It is most suitable for shopping
products which include consumer durables.
3. Exclusive distribution:
Only one outlet in a bigger geographical area is used to sell the product. Exclusive
distribution is used for costly, fashionable items whose sale is limited.
Major Types of Retail Stores:
The Major Types of Retail Stores found in India are listed below:
 Department Stores
 Discount Stores
 Supermarket
 Mom and Pop Store (also called Kirana Store in India)
 Convenience Stores
 Television Shopping
 Vending Machine
PROMOTION
Promotion includes all of the activities marketers undertake to inform
consumers about their products and to encourage potential customers to buy
these products.
-Solomon et al (2009).
Promotion is self explained and encompasses all promotional activity such as
Advertising, PR and Sales. As you study further you will learn more about the subject
of marketing communication and the strategies that evolve from that appellation. The
tactics, or media chosen, will depend on resources but also what the objective of the
strategy is. For example is the objective was to raise awareness the media chosen will
12
focus more on mass exposure. If the strategy is to solicit a sale then the communication
channel will be more targeted.
The three basic objectives of promotion are :
I. To present product information to targeted consumers and business
customers.
II. To increase demand among the target market.
III. To differentiate a product and create a brand identity.
Fig. 1.5 Factors affecting Promotional Mix
A marketer may use advertising, public relations, personal selling, direct marketing,
and sales promotion to achieve these objectives. A promotional mix shall depend on
nature of the product market, promotional budget, costs and availability of promotional
methods, overall marketing strategy, buyer readiness stage and product life stage.
A promotional plan can have a wide range of objectives, including: sales increases, new
product acceptance, creation of brand equity, positioning, competitive retaliations, or
creation of a corporate image.
Promotion strategy may be ‘push'(use of a company’s sales force and trade promotion
activities to create consumer demand for a product), ‘Pull’ (high spending on
advertising and consumer promotion to build up consumer demand for a product).
13
PEOPLE
People are all human actors who play a part in service delivery and thus
influence the buyers' perceptions; namely, the firm's personnel, the customer,
and other customers in the service environment.
- Zeithand et al (2008).
Right people, properly trained, is a must for obtaining competitive advantage. It is the
interaction with people consumers perceive of quality of service. The people should
have appropriate interpersonal skills, aptitude and service knowledge to deliver
expected service. The students perceive of their college on the basis of teaching and
non-teaching staff attitudes.
PROCESS
Process is the actual procedures, mechanisms, and flow of activities by which the
service is delivered — this service delivery and operating systems.
-Zeithami et al (2008).
Process is the delivery and operating systems of procedures, mechanisms and flow of
activities which services are consumed. To deliver products or services, systems or
processes have to be in place, to avoid any discretion. Imagine you get in McDonalds
and order a burger and get it within 2 minutes. Such an efficient service will earn
customer loyalty and repeat visits. Every business must have processes, like, processes
for handling customer complaints, processes for handling order etc.
PHYSICAL EVIDENCE
Physical evidence is the environment in which the service is delivered, and where
the firm and customer interact, and any tangible components that facilitate
performance or communication of the service.
-Zeithaml et al (2008)
Physical evidence refers to the environment in which the service is delivered, and the
tangibles that help to communicate and perform the service. If you walk in a grocer’s
shop and find rats, insects and flies, what will be your perception? The young generation
prefers to go to malls instead of street shop is the physical ambience.- the cleanliness,
air conditioning, parking facility, facility to touch, etc.
14
1.4 KEY FEATURES OF MARKETING MIX
1. Interdependent variables
The marketing mix is made up of four unique variables. These four variables are
interdependent and need to be planned in conjunction with one another to ensure
that the action plans within all four are complimentary and aligned.
2. Help Achieve Marketing Targets
Through the use of this set of variables, the company can achieve its marketing
targets such as sales, profits, and customer retention and satisfaction.
3. Flexible Concept
The marketing mix is a fluid and flexible concept and the focus on any one variable
may be increased or decreased given unique marketing conditions and customer
requirements.
4. Constant Monitoring
It is vital to keep an eye on changing trends and requirements, within the company
as well as in the market to ensure that the elements in marketing mix stays relevant
and updated.
5. Role of Marketing Manager
A mature, intelligent and innovative marketing manager needs to be at the helm of
the marketing mix. This pivotal role means that this manager is responsible for
achieving desired results through the skill manipulation of these variables.
6. Customer as a focal point
A vital feature of the marketing mix is that the customer is the focal point of the
activity. The value of the product is determined by customer perceptions and the
goal is to achieve a satisfied and loyal customer.
15
1.5 DEVELOPING A MARKETING MIX
To ensure a marketing mix that is based in research and combines facts with innovation,
a manager should go through the following systematic process:
Step 1
The first item on the marketing manager's agenda should be to define what the product
has to offer or its unique selling proposition (USP). Through customer surveys or focus
groups, there needs to be an identification of how important this USP is to the consumer
and whether they are intrigued by the offering. It needs to be clearly understood.
Step 2
The second step is to understand the consumer. The product can be focused by
identifying who will purchase it. All other elements of the marketing mix follow from
this understanding.
Step 3
The next step is to understand the competition. The prices and related benefits such as
discounts, warranties and special offers need to be assessed. An understanding of the
subjective value of the product and a comparison with its actual manufacturing
distribution cost will help set a realistic price point.
Step 4
At this point the marketing manager needs to evaluate placement options to understand
where the customer is most likely to make a purchase and what are the costs associated
with using this channel. Multiple channels may help target a wider customer base and
ensure east of access.
Step 5
Based on the audience identified and the price points established, the marketing
communication strategy can now be developed. Whatever promotional methods are
finalized need to appeal to the intended customers and ensure that the key features and
benefits of the product are clearly understood and highlighted.
Step 6
A step back needs to be taken at this point to see how all the elements identified and
planned for relate to each other. All marketing mix variables are interdependent and
rely on each other for a strong strategyThe marketing plan can be finalized once it is
16
ensured that all four elements are in harmony and there are no conflicting messages,
either implicit or explicit.
1.6 SWOT ANALYSIS
SWOT analysis is a tool for auditing an organization and its environment. SWOT
analysis is the first stage of planning and helps marketers to focus on key issues.
SWOT stands for strengths, weaknesses, opportunities, and threats. Strengths and
weaknesses are internal SWOT factors. Opportunities and threats are external SWOT
factors. A strength is a positive internal factor. A weakness is a negative internal factor.
An opportunity is a positive external factor. A threat is a negative external factor. We
should aim to turn our weaknesses into strengths, and our threats into opportunities.
Then finally, SWOT will give managers options to match internal strengths with
external opportunities. SWOT is that simple. The outcome should be an increase in
'value' for customers — which hopefully will improve our competitive advantage.
The main purpose of SWOT analysis has to be to add value to our products and
services so that we can recruit new customers, retain loyal customers, and extend
products and services to customer segments over the long-term. If undertaken
successfully, we can then increase our Return On Investment (ROI).
A SWOT STRENGTH COULD BE:
 Your specialist marketing expertise.
 A new, innovative product or service.
 Location of your business.
 Quality processes and procedures.
 Any other aspect of your business that adds value to your product or service.
A SWOT WEAKNESS COULD BE:
 Lack of marketing expertise.
 Undifferentiated products or services (i.e. in relation to your competitors).
 Location of your business.
 Poor quality goods or services.
 Damaged reputation.
17
A SWOT OPPORTUNITY COULD BE:
 A developing market such as the Internet.
 Mergers, joint ventures or strategic alliances.
 Moving into new market segments that offer improved profits.
 A new international market.
A SWOT THREAT COULD BE:
 A new competitor in your home market.
 Price wars with competitors.
 A competitor has a new, innovative product or service.
 Competitors have superior access to channels of distribution.
 Taxation is introduced on your product or service.
1.7 BUYER BEHAVIOR
The aim of marketing is to meet and satisfy target customers‘ needs and wants. The
field of consumer behavior studies how individuals, groups, and organizations select,
buy, use, and dispose of goods, services, ideas, or experiences to satisfy their needs and
desires. Understanding consumer behavior is never simple, because customers may say
one thing but do another. They may not be in touch with their deeper motivations, and
they may respond to influences and change their minds at the last minute.
Fig. 1.5 Marketing stimuli affecting buyer’s decision
18
Factors Influencing Buyer Behavior
As this model indicates, a consumer‘s buying behavior is influenced by cultural, social,
personal, and psychological factors.
1. Cultural Factors Influencing Buyer Behavior
Culture, subculture, and social class are particularly important influences on
consumer buying behavior
2. Social Factors Influencing Buyer Behavior
In addition to cultural factors, a consumer‘s behavior is influenced by such social
factors as reference groups, family, and social roles and statuses.
3. Personal Factors Influencing Buyer Behavior
Cultural and social factors are just two of the four major factors that influence
consumer buying behavior. The third factor is personal characteristics, including
the buyer‘s age, stage in the life cycle, occupation, economic circumstances,
lifestyle, personality, and self-concept.
4. Personal Factors Influencing Buyer Behavior
Cultural and social factors are just two of the four major factors that influence
consumer buying behavior. The third factor is personal characteristics, including
the buyer‘s age, stage in the life cycle, occupation, economic circumstances,
lifestyle, personality, and self-concept.
1.8 The Stages of the Buying Decision Process
Consumer buying decision process is the processes undertaken by consumer in regard
to a potential market transaction before, during and after the purchase of a product or
service.
19
Fig. 1.6 Consumer decision making process generally involves five stages:
Need Recognition
Purchase decision making process begins when a buyer becomes aware of an
unsatisfied need or problem. This is the vital stage in buying decision process, because
without recognizing the need or want, an individual would not seek to buy goods or
service.
There are several situations that can cause problem recognition, these include:
 Non availability of particular brand
 Dissatisfaction with Quality
 Price Changes
 Change in Financial Situation
Information Search
After the consumer has recognized the need, he / she will try to find the means to solve
that need. First he will recall how he used to solve such kind of a problem in the past,
this is called nominal decision making. Secondly, a consumer will try to solve the
problem by asking a friend or goes to the market to seek advice for which product will
best serve his need, this is called limited decision making.
Sources of information include:
 Personal sources
 Commercial Sources
 Public sources
 Personal experience
Need
Recognition
Search
Evaluation of
Alternatives
Purchase
Decision
Post
Purchase
Behavior
20
Evaluation of Alternatives
Consumers evaluates criteria refer to various dimension; features, characteristics and
benefits that a consumer desires to solve a certain problem. Product features and its
benefit is what influence consumer to prefer that particular product. The consumer will
decide which product to buy from a set of alternative products depending on each
unique feature that the product offers and the benefit he / she can get out of that feature.
Fig. 1.7 Evaluation of different brands of bath soap
Purchase Decision
This stage involves selection of brand and the retail outlet to purchase such a product.
Retail outlet image and its location are important. Consumer usually prefers a nearby
retail outlet for minor shopping and they can willingly go to a far away store when they
purchase items which are of higher values and which involve higher sensitive purchase
decision. After selecting where to buy and what to buy, the consumer completes the
final step of transaction by either cash or credit.
Post-purchase Behavior
Consumer favourable post-purchase evaluation leads to satisfaction. Satisfaction with
the purchase is basically a function of the initial performance level expectation and
perceived performance relative to those expectations. Consumer tends to evaluate their
wisdom on the purchase of that particular product. This can result to consumer
experiencing post purchase dissatisfaction. If the consumer’s perceived performance
level is below expectation and fail to meet satisfaction this will eventually cause
dissatisfaction, and so the brand and/ or the outlet will not be considered by the
consumer in the future purchases.
Total Set
Dyan
Nirma
Godrej No. 1
Santooe
Lux
Awarness Set
Nirma
Godrej No.1
Santoor
Lux
Consideration
Set
Godreg No. 1
Santoor
Lux
Choice Set
Santoor
Lux
Decision
Lux
CHAPTER 2
PROFILE OF THE
COMPANY
21
2.1 COMPANY’S BACKGROUND
Hindustan Unilever Limited (HUL) is India's largest Fast Moving Consumer Goods
Company, touching the lives of two out of three Indians with over 20 distinct
categories in Home & Personal Care Products and Foods & Beverages. They endow
the company with a scale of combined volumes of about 4 million tonnes and sales of
Rs.10,000 crores, Hindustan Unilever Limited (abbreviated to HUL), formerly
Hindustan Lever Limited, is INDIAs largest consumer products company and was
formed in 1933 as Lever Brothers India Limited. It is currently headquartered in
Mumbai, India and its 41,000 employees are headed by Harish Manwani, the non-
executive chairman of the board. HUL is the market leader in Indian products such as
tea, soaps, detergents, as its products have become daily household name in India.
The Anglo-Dutch company Unilever owns a majority stake in Hindustan Unilever
Limited.
The company was renamed in late June 2007 as "Hindustan Unilever Limited".
The mission that inspires HUL's over 15,000 employees, including over 1,300
managers, is to "add vitality to life." HUL meets everyday needs for nutrition, hygiene,
and personal care with brands that help people feel good, look good and get more out o
HUL's brands - like Lifebuoy, Lux, Surf Excel, Rin, Wheel, Fair & Lovely, Pond's,
Sunsilk, Clinic, Pepsodent, Close-up, Lakme, Brooke Bond, Kissan, Knorr-Annapurna,
Kwality Wall's – are household names across the country and span many categories -
soaps, detergents, personal products, tea, coffee, branded staples, ice cream and
culinary products. They are manufactured over 40 factories across India. The operations
involve over 2,000 suppliers and associates. HUL's distribution network comprising
about 4,000 redistribution stockists, covering 6.3 million retail outlets reaching the
entire urban population, and about 250 million rural consumers.
22
MISSION
Unilever's mission is to add Vitality to life. We meet everyday needs for nutrition,
hygiene and personal care with brands that help people feel good, look good and get
more out of life.
Our deep roots in local cultures and markets around the world give us our strong
relationship with consumers and are the foundation for our future growth. We will bring
our wealth of knowledge and international expertise to the service of local consumers.
Our long-term success requires a total commitment to exceptional standards of
performance and productivity, to working together effectively, and to a willingness to
embrace new ideas and learn continuously.
To succeed also requires, we believe, the highest standards of corporate behavior
towards everyone we work with, the communities we touch, and the environment on
which we have an impact. This is our road to sustainable, profitable growth, creating
long-term value for our shareholders, our people, and our business partners.
HUL’s key focus in the exports business is on two broad categories. It is a sourcing
base for Unilever brands in Home & Personal Care (HPC) and Food and Beverages
(F&B) for supplies to other Unilever companies. It also focuses on becoming a
preferred supplier to both non-Unilever and Unilever clients in three categories in
which India, as a country, has competitive advantage – Branded Rice, Marine
Products and Castor and its Derivatives. HUL enjoys international recognition
within Unilever and outside for its quality, reliability and speed of customer
service.
HUL's Exports geography comprises, at present, countries in Europe, Asia, Middle
East, Africa, Australia, and North America etc.
 HUL’s products touches two out of three Indian everyday
 Reach 80% Households
 Direct Coverage of 1mln outlets
 2000 Suppliers and Associates
 71 Manufacturing locations
 15000 Employees
 1100 managers
 Shelf availability 84% outlets in India
23
2.2 STUDY OF HUL’S BATH SOAP BRANDS IN RESPECT
TO 7 P’S OF MARKETING MIX
1. PRODUCT LINE
Fig. 2.1 Product Line of HUL
A) HOME AND PERSONAL CARE:
1) Personal wash 2) Laundry 3) Skin Care
Lux Surf Excel Fair and lovely
Breeze Rin Pond’s
Lifebuoy Wheel Aviance
Dove
Liril
Pears
Hamam
Rexona
4) Hair care 5) Oral care 6) Deodorants
Sunsilk naturals Pepsodent Axe
Clinic Close up Rexona
7)Colour Cosmetics 8)Ayurvedic Personal and health care
Lakme Ayush
24
B) FOODS
1) Tea 2) Coffee 3) Foods 4) Ice cream
Brooke Bond Brooke Bond Bru Kissan Kwality walls
Lipton Knor
Annapurna
C) WATER PURIFIER :
Pureit
PRICE
If price is too high then a company may never sell a single item of it. If price is too low
then one can lose money on every sale once all of costs of doing business are
considered. Therefore the key is to price it in such way that it appears attractive to the
customer as well as profitable to the company. HUL seems to have mastered this idea.
Prices of HUL are considered the most competitive in Indian market. The main fact for
this huge success story is the strategic pricing decision the company has adopted from
time to time.
HUL always gives value for money to their consumers. It is known for its competitive
pricing. It has the advantage of quoting a reasonable price due to its economies of scale.
HUL also can quote a very competitive price due to its superior technology and
optimum utilization of inventory. It has the product range that meets the needs of all
classes of consumers. It has the products that are categorized as premium and mass
products. HUL matches its prices with the competitor who is operating in the same
category. HUL also gives price offs on its products to reward consumers who are using
it for a long time and also to attract new consumers.
The price of the premium segment products is twice that of economy segment products.
The economy and popular segments are 4/5ths of the entire soaps market.
Price segments of bath soaps
Segment Price Weight
Premium Above Rs. 20 75 gm
Popular Rs 13 to Rs. 20 75 gm
Economy Rs. 8 to Rs. 12 75 gm
25
However, recently HUL has been forced to hike its price by one rupee, to Rs17 (for 100
gm), giving in to the pressures of inflation. This paves the way for competing soap
makers like Godrej Consumer Products (GCPL) to take price increases.
Table 2.2 Price of HUL soaps
Premium (> 20 Rs.)
Popular (> 13 Rs. &
< 20 Rs.)
Economy (< Rs. 12)
Brand
Price
(Rs.) for
75 gm
Brand
Price
(Rs.) for
75 gm
Brand
Price
(Rs.) for
75 gm
Dove 33Rs. Lux 18 Rs. Breeze 10Rs
Pears 26Rs. Liril 19Rs. Lifebuoy 10Rs
Moti 23Rs. Rexona 17Rs.
Hamam 18Rs.
The bath soaps are available in different sizes - 75 gms. 100 gms, 125 gms. and 150
gms. The popular sizes are 75 gms. and 100 gms.
PLACE
HUL‘s distribution network is recognized as one of its key strengths -- that which helps
reach out its products across the every retail outlets. The need for a strong distribution
network is imperative, since HUL‘s corporate purpose is ―to meet the everyday needs
of people everywhere.‖
At Hindustan Unilever Limited, distribution network is one of the key strengths that
help them reach their products across the length and breadth of this vast country. It has
2000+ suppliers and associates 7,000 stockiest and direct coverage in over 1 million
retail outlets across India.
To meet the ever-changing needs of the consumer, HUL has set up a distribution
network that ensures availability of all their products, in all outlets, at all times. This
includes, maintaining favorable trade relations and providing innovative incentives to
retailers. HUL boasts of placing a product across the country in less than 72 hrs.
26
The first phase of the HUL distribution network had wholesalers placing bulk orders
directly with the company.
Today, the goods are transferred from the factory to the company warehouses and are
sent to the distributor from there on a daily basis. From the distributor, the stock reaches
the market through daily sales. Typically, these include the salesman registering the
order of a retail outlet and delivering the goods the next day.
In addition to the ongoing commitment to the traditional grocery trade, HUL is building
a special relationship with the small but fast emerging modern trade. HUL'sscale
enables it to provide superior customer service including daily servicing, improving
their range availability whilst reducing inventories. HUL is using the opportunity of
interfacing more directly with consumers in this retail environment through specially
designed communication and promotions. This is building traffic into the stores while
yielding high growth for the business.
PROMOTION
The great Indian brand wagon started nearly four decades ago. Great brands sometimes
outlast their ambassadors as proven by Lux which celebrated its 75th anniversary in
India.
The first ambassador, Leela Chitnis featured in a Lux advertisement which flagged off
the Lux wagon. She gave way to a galaxy of stars which includes Madhubala, Nargis,
Meena Kumari, Mala Sinha, Sharmila Tagore, Waheeda Rehman, Saira Banu, Hema
Malini, Zeenat Amaan, Juhi Chawla, Madhuri Dixit, Sridevi, Aishwarya Rai, Kareena
Kapoor and Priyanka Chopra. The last frontier for most actors aspiring to stardom is
becoming a Lux ambassador. The brand has outlasted much soap. From the beginning,
Lux became a household name across the country.
All top actresses at their time were the brand ambassador of the Lux soap. They
launched the Shahrukh Khan as a first male brand ambassador for the LUX and
Abhishekh Bacchan was the second male brand ambassador for the Lux. They also
promote the brand through sponsoring the shows such as ―LUX PERFECT BRIDE.‖,
sales promotion schemes like ―LUX GOLD COIN OFFER‖, ―Buy 3 Get 1 Free‖. As
a promotional activity window display is also run by the company.
27
Table 2.3 A List of Some offers During the Period (2017 - 2020)
Brand Size Offers
Pears 75gm 5 Rs. OFF
Pears 75gm
Buy 1, get 2 sachets
Sunsilk shampoo free
worth Rs.5
Lux 75gm Gold Coin Offer
Lux 75gm Save 9 Rs.
Breeze 75gm, Buy 2 Get 1 Free
Breeze 125 gm Buy 2 Get 1 Free
Dove 100gm Buy 3 Save Rs 10.
Lux Honey 75gm Rs. 2 Off
PEOPLE
People refer to the staff and salespeople who work for your business, including yourself.
When you provide excellent customer service, you create a positive experience for your
customers, and in doing so market your brand to them. In turn, existing customers may
spread the word about your excellent service and you can win referrals.
Give your business a competitive advantage by recruiting the right people, training
your staff to develop their skills, and retaining good staff.
Right people, properly trained, is a must for obtaining competitive advantage. It is the
interaction with people consumers perceive of quality of service. The people should
have appropriate interpersonal skills, aptitude and service knowledge to deliver
expected service. The students perceive of their college on the basis of teaching and
non-teaching staff attitudes.
HUL has over 18000 employees, including over 1500 managers
Board of directors
Mr. Harish Manwani – Chairman
Mr. Sanjiv Mehta - CEO and Managing Director
Mr. R. Sridhar - Chief Financial Officer
28
Process
Process refers to the HUL processes involved in delivering your products and services
to the customer. It is also about being 'easy to do business with'.
Having good process in place ensures that you:
 repeatedly deliver the same standard of service to your customers
 save time and money by increasing efficiency.
Physical evidence
Physical evidence refers to everything your customers see when interacting with your
business. The HUL physical evidence includes includes:
 the physical environment where you provide the product or service
 the layout or interior design
 your packaging
 your branding.
Physical evidence can also refer to your staff and how they dress and act.
2.3 SWOT ANALYSIS OF HINUSTAN UNILEVER LIMITED
Strengths in the SWOT analysis of Hindustan Unilever ( HUL )
1. Strong legacy of the HUL brand since its inception in 1934.
2. Market leader in consumer goods.
3. Innovative FMCG Company.
4. Extensive & integrated distribution system.
5. Financial position.
6. HUL is a part of the Unilever group, hence strong brand equity, visibility.
7. As a part of CSR, HUL has initiatives like project Shakti, plastic recycling,
women empowerment etc.
8. Products with presence in over 20 consumer categories with over 700 million
Indian consumers using its products.
9. It has over 18000 employees and has a reach of 6.4 million retail outlets which
includes direct reach to over 1.5 million retail outlets.
29
Weaknesses in the SWOT analysis of Hindustan Unilever ( HUL )
1. Large number of brands in different product categories
2. Market share is limited due to presence of other strong FMCG brands
3. HUL can tap rural markets and increase penetration in urban areas
4. Mergers and acquisitions to strengthen the brand
5. Increasing purchasing power of people thereby increasing demand
Opportunities in the SWOT analysis of Hindustan Unilever ( HUL )
1. HUL can tap rural markets and increase penetration in urban areas
2. Increasing Income levels
3. Mergers and acquisitions to strengthen the brand
4. Increasing purchasing power of people thereby increasing demand
Threats in the SWOT Analysis of HUL (Hindustan Unilever Limited)
1. Intense and increasing competition amongst other FMCG companies can affect
business of HUL
FDI in retail thereby allowing international brands
2. Competition from unbranded and local products can hurt Hindustan Unilever's
market
3. Buyers power
2.4 COMPETITORS ANALYSIS
According to the market survey done by BUSINESS TODAY the top 10 companies
of FMCG sector are given below.
1. Hindustan Unilever Ltd.
2. ITC (Indian Tobacco Company)
3. Nestlé India
4. GCMMF (AMUL)
5. Dabur India
6. Asian Paints (India)
30
7. Cadbury India
8. Britannia Industries
9. Procter & Gamble Hygiene and Health Care
10. Marico Industries
2.5 Market Share of HUL’s Bath Soap Products
in Jaipur City:
Given below is the market share of bath soap product of hul as per the latest article
published in economic times.
Table 2.4 Different Bath soap companies market share
Company Market Share
Hindustan Unilever Ltd. 45%
Godrej Consumer product Ltd. 11%
Wipro Consumer Ltd 13%
Nirma 3%
Rackitt Benckiser (India)
ltd.
6%
ITC 3%
Anchor Health & Beauty Care 3%
Hankel India Ltd 1%
Jonson and Jonson‘s 2%
V V F 5%
Dorcas Market Makers 7%
Mhaysor Sandal Soap 1%
31
2.6 FUTURE PROJECTS OF HUL:
As competition is increasing day by day,it’s difficult to maintain the leader
position & to further strengthen the distribution network HUL made a project
called project SHAKTI which will serve the following purpose:
A. To Reach:
 Small, scattered settlements and poor infrastructure make
distribution difficult.
 Over 500,000 villages not reached directly by HUL.
B. To Communicate:
 Low literacy hampers effectiveness of print media.
 Poor media-reach: 500 million Indians lack TV& radio.
C. To Influence:
 Low category penetration, consumption.
D. Awareness:
 Per capita consumption in Unilever categories is 33% of urban level.
Hindustan Unilever
Ltd.
45%
Godrej Consumer
product Ltd.
11%
Wipro Consumer
Ltd
13%
Nirma
3%
Rackitt Benckiser
6%
ITC
3%
Anchor Health &
Beauty Care
3% Hankel India Ltd
1%
Jonson and
Jonson‘s
2%V V F
5%
Dorcas Market
Makers
7%
Mhaysor Sandal
Soap
1%
Fig. 2.4 Different Bath Soap Companies Market Share
CHAPTER 3
REVIEW OF
LITERATURE
32
3.1 REVIEW OF LITERATURE
At the time of formulation of the research proposal the researcher had gone through
literature from books, research papers in order to get himself equipped with the basic
knowledge of the research topic proposed. Now once the research proposal was
approved, in order to have thorough knowledge about the topic of research, the
researcher considered appropriate to go through the relevant literature. For this purpose
the researcher referred to the earlier Ph. D. theses available on the websites, research
papers, books, journals and periodicals, news paper articles etc. and got himself
thoroughly acquainted with the research topic. These reviews are presented in this
chapter chronologically.
Thus, the researcher has reviewed categories following literature:
Shukla Priteshkumar Y. (2016)1 concluded that, there are different factors like Price
of the product, variety in size of the product, main sources of the product knowledge,
advertisement, which plays an important role in rural buying decision. Moreover, that
it can be said that majority of the respondents are happy with the selected products of
HUL. According to the author it can be said that advertisement plays an important role
against spurious products available in the market. And they preferred more extra
quantity in the same price as favourable promotional scheme.
Priyadarsini J., (2015)2 in her research paper she has stressed the role of the women
in marketing. She has cited the Hindustan Unilever‟s Shakti model and has also given
quotation of the Sr. Executive of the HUL which focuses on the strength of the
women. She has stated HUL‟s model has achieved a grand success in the East Godavari
District. According to her women are change setters in the urban marketing set up.
1
Shukla Priteshkumar Y. (Febrary 2016), “A study on Rural Marketing Strategy – with Special Emphasis
on Selected Customer Preferences for Hindustan Unilever Limited‟s (HUL) selected products in Valsad
District.” PARIPEX-Indian Journal of Research, Vol. 2, Issue 2, pp 49-52
2
Priyadarsini J. (2015). Patting at the Bottom of the Pyramid Beyond Business Goals: An Empirical
Analysis on Project Shakti, HUL. CRR, (pp. 1-37). 254
33
Wath M. and Agarwal P. (2013)3 according to the author the urban markets are having
stiff competition for many products. In regard to some products the market is saturated.
Urban markets are offering growth potential. The marketers should understand the
consumer before going ahead. The markets are fast expanding. The authors observed
that the urban market offers numerous challenges.
Joshi (2016)4 research paper titled, “Upcoming Trends in Retailing: Green Retailing/
Eco Friendly Retailing”. In this paper the author has observed that with the growing
realization about the ill-effects of global warming, customers across the globe are using
the companies to come up with eco-friendly alternatives to manufacturing process. The
retailers have also discovered that these “Green initiatives” are in turn leading them to
identify cost-effective ways of doing their business. She has stated that there are many
specialist stores that sell green products. Whole food and natural living stores often sell
an extensive range of eco-friendly products. Eco-friendly clothing can be as stylish and
fashionable as conventionally produced clothes. Environmentally friendly detergents
and other household products are featured alongside conventional products. Brands
such as E-cover are widely known.
Khan, Ahmad, (2015)5, paper titled, “Consumer Decision-Making Styles: A
Comparative study of Male and Female Customers in India”. The authors have
observed that the social and economic status of woman has now improved. Women go
for higher education and are found working together with the men in most of the
organizations. The life style of the Indian woman has changed which has an influence
on the consumption pattern and decision making styles. Males have shown a higher
degree of association with perfectionist/High Quality conscious consumer, promotion
3
Wath M., Agarwal P. (2013). Exploring Indian Rural Market - The Way Ahead. International
Conference on Technology and Business Management, (pp. 750-755).
4
Aarti Joshi (2016), research paper titled, “Upcoming Trends in Retailing: Green Retailing/ Eco Friendly
Retailing”. Published in Handbook of Management and Behavioural Science” book edited by Ranbir
Singh Gulia, Ombir Singh, Suvijna Awasthi, by Wisdom Publications, Delhi. Pp. 29-33
5
Dr. Mohd. Afaq Khan, S. Aijaz Ahmad, (2015), paper titled, “Consumer Decision-Making Styles: A
Comparative study of Male and Female Customers in India”. Published in Handbook of Management
and Behavioural Science” book edited by Ranbir Singh Gulia, Ombir Singh, Suvijna Awasthi, by
Wisdom Publications, Delhi. Pp. 75-83.
34
conscious consumer, brand conscious consumer, impulsive careless consumer, habitual
brand loyal consumer and Store Loyal consumer styles where as a higher degree of
association has been shown by the females towards novelty, fashion conscious
consumer, health conscious consumer, price conscious consumer, recreational choice
seeking and confused by over choice consumer traits.
Kashyap, (2013),6 book titled, “Rural Marketing”. This is a very nicely written book
on rural marketing which exclusively deals with all the aspects of the rural marketing
in greater details. The book has discussed several cases which is quite useful to
understand the conclusions drawn by the authors. The author has highlighted that the
marketer should understand the rural market in its right perspective. The issues such as
population size, age groups, gender dynamics, family structure, education level,
occupation, landholdings pattern and income structure of the rural masses. The author
has nicely described the process of rural consumer behavior, segmenting and targeting
rural markets, product strategy, Pricing strategies, distribution in rural Markets etc.
Kotler, Kellr, Koshy, Jha 2012,7 book titled, “Marketing Management - A South
Asian Perspective”. In this book while discussing the marketing insight, the authors
have stressed the need for developing service offers for rural areas.
Panda, (2007)8, in his book titled “Market Management” has observed that up till now
the rural market has not been explored mainly because of the low purchasing power as
well as availability of efficient communication. Besides there is another hurdle of
regular income as the rural income is based on the harvesting of the agricultural produce
and its realization.
However, of late the Indian rural market is emerging a viable market because of the
improvement in the infrastructure as well as gradual increase in the purchasing power
of the rural families. Hindustan Unilever has put in operation Bharat, through which it
6
Pradeeklp Kashyap, (2013) “Rural Marketing”, published by Dorling Kindersley (India) Pvt. Ltd.
7
Philip Kotler, Kevin Lane Kellr, Abraham Koshy, Mithileshwar Jha 2012, book titled, “Marketing
Management - A South Asian Perspective”. Published by Pearson – Delhi.
8
Tapan K. Panda, (2007), II edition, Book titled “Market Management” published by Excel Books,
Chapter 7, pp. -151-177
35
is trying to improve the penetration of its products in the rural areas. The multinational
FMCGs are encouraging the rural masses for increasing their consumption.
Schiffman and Kanuk: (2007)9 book titled: “Consumer behavior” This book has
been divided into 4 parts. Part 1 provides the background and the tools for a strong and
comprehensive understanding of customer behaviour. Chapter I introduces the reader
to the study of consumer behaviour, its diversity, its development and the role of
consumer research, it concludes with a detailed discussion of ethical considerations in
marketing and consumer practices and introduces a simple model of consumer decision
making. Chapter 2 provides a detailed overview of the critical research process and the
techniques associated with consumer behaviour research, including a discussion of
positivist and interpretivist research methods. Chapter 3 presents a comprehensive
examination of market segmentation and demonstrates how consumer behaviour
variables provide both the conceptual framework and the strategic direction for the
practical segmentation of markets.
Bhawna Mehra & Kogent Learning Solutions Inc. 10(2007), book titled, “Marketing
Management”. In this book in module 8.7 the author dwelt upon the rural marketing
management. The author has highlighted that the increased purchasing power of the
rural customer has attracted the attention of the urban marketers. Issues concerning
client and location specific promotion, joint promotion, etc. has also been discussed by
the author. The author has also discussed four A’s of marketing (which has already been
covered in one of the reviews). He has also discussed the scope of HUL market and the
need for a separate strategy for the rural marketing.
V. S. Ramaswamy, S. Namakumari 200711, book titled, “marketing Management,
Planning, Implementation & Control”. In this book the authors have observed that the
9
Leon G. Schiffman and Leslie Lalzar Kanuk: (2007) Titled: “Consumer behavior” published by Excel
Books, Chapter 7, pp. -151-177
10
Prof. Dr. P. K. Chopra, Bhawna Mehra & Kogent Learning Solutions Inc. (2007), book
titled, “Marketing Management”, published by dreamtech Press, pp 220-233.
11
V. S. Ramaswamy, S. Namakumari 2007, book titled, “marketing Management, Planning,
Implementation & Control” publisher Macmillan India Ltd. Delhi
36
urban marketing is developmental marketing and F.M.C.G. companies should develop
their strategies to make best use of the potential offered by it. They have also observed
that this urban market is different than the urban market. The packaging of the product
should be small, and without sacrificing the quality of the product the price should be
low taking into account its affordability in the urban area.
Kaur (2013),12 article, “Rural Marketing: A Case Study on Hindustan Unilever
Limited,” the author has discussed the importance gained by the rural markets in the
overall growth of economy. While discussing the special features of the current rural
marketing scenario the author has discussed the competition in urban markets,
changing consumption pattern in rural areas, improved lifestyle , huge population base,
the rate at which the rural market is growing. In fact HUL was one of the early
companies to enter into the rural marketing in India. While discussing rural marketing
the author has also discussed the 4 Ps of rural marketing i.e. Product strategy, pricing
strategy, Place strategy, and the promotion strategy. HUL has a sustained approach to
explore the rural potential. The company has now adopted a direct door step marketing
through its Shaktiamma . The author has pointed that there are number of changes on
the marketing horizon of HUL which include:
1. Technology of digital maps – to study existing rural distribution reach and to draw
up plans for increasing its reach. Maps help for smarter route planning.
2. Improved road infrastructure across the country leading to improved access to even
remotest of villages.
3. Reach of television to rural area has rural consumers watching all programmes and
ads as in the city. Aspiration to use same products as city folks is on the irse and
buying habits of rural consumers are changing fast.
Sharma, (2013)13 in her paper titled, “An Analytical Study on the Opportunities of
Rural Marketing in India” has concluded that in the Indian rural marketing scenario
12
Manpreet Kaur (June 2013), article, “Rural Marketing: A Case Study on Hindustan Unilever Limited,”
International Journal of Applied Research and Studies, Volume 2.
13
Dr. Ankurati Sharma, (2013), “An Analytical Study on the Opportunities of Rural Marketing in India”,
IJM, Vol. 4, pp.183-189.
37
usually the marketing decision of purchasing is taken in the age group of 31-40 years.
The author further observed that while marketing strategies for rural marketing, the
marketers must be aware about the media selection, proper use of the language which
should be understandable by the rural people. Regional language plays an important
role. Usually the rural consumers rely on the other people who have used the said
product. Branding, media, usage of language are the important aspects which should be
borne in mind while tapping the rural marketing.
Kalotra, (2013),14 research paper titled, “Rural Marketing Potential in India – An
Analytical Study”, the author has drawn the following conclusions:
❖ Age wise analysis explains the pattern of purchasing in the rural markets wherein
the age group between 21-50 years is dominating with majority of males.
❖ Advertisements through electronic media are preferred over other method of
communication.
❖ Marketers can benefit most if they can make the rural people feel that they value
them as their customers.
❖ Regional languages are playing vital role in the rural marketing.
❖ Rural customers are increasingly becoming brand conscious as well as price and
discounts.
❖ The decision making in the rural market are taken by self followed by spouse.
❖ The rural consumers usually do not experiment with a new product unless
something trigger them.
❖ There is a high potential in the rural India but exists major differences between the
existing and the desirable levels of rural marketing.
Dr. Singh J., and Saikh (2012)15 , The authors stress the role of the family in
influencing the buying behavior particularly in the consumer durable segment. The
14
Anil Kalotra, (Jan 2013), research paper titled, “Rural Marketing Potential in India – An Analytical
Study”, published in International Journal of Advanced Research in Computer Science and Software
Engineering, Volume 3,Issue1, pp 1-10
15
Dr. Singh S., Seikh J. (2012). Making a Dent into the Rural Market, Integral Review- A Journal of
Management, Volume 5, No.1, June, 36-41.
38
marketers should direct their advertising efforts and messages may be given in such a
way that it appeals the family members. The authors observed that the marketers should
build their credibility in the rural market as the mass media advertising is resulting in
losing their faith. The authors have suggested the use of social interactive media which
will give better results.
Kesari, Srivastava (2012)16, paper titled, “Retailing in Rural India: An Overview of
Markets and Opportunities” the authors have concluded that the rural market is a vital
market now which should be focused by the Multi National Corporations. The needs
of the rural people are different than the urban or metro consumers. They have a
different set of mind about the packaging as well as product. Packaging should be small
and sturdy to withstand the rough roads in the rural area. The rural marketing has
displayed a phenomenal growth during the past decade.
Financial Express, 8th February, 2020, BARC, article titled, “Lux Toilet Soap retain
the top most spot as the most advertised brand” Lux has the highest market share in
advertisement in soap industry. Comparison made between 10 competitors of
advertisement with each percent share.
The Hindu, Business Line 9th Sept. 2018. As the summer season fades away, the
hinterland gears up for a variety of festivities. These bring with them a number of
traditional fairs (melas). Over the years these fairs that have proven to be great
opportunities for marketers. And though the current reuptake is not anything to sing
about, it is here that two-wheeler companies, the FMCG sector, food and beverage firms
or the garment makers can find potential customers who are on an outing with family
and friends and ready to listen.
16
Dr. Joseph Kesari, Abhishek Kumar Srivastava (2012), paper titled, “Retailing in Rural India: An
Overview of Markets and Opportunities” South Asian Academic Research Journals available on
http://www.saarj.com
39
Indian Brand Equity Foundation: July 2017, Rural Segment Quickly Catching
Up.
The Fast Moving Consumer Goods (FMCG) sector in rural and semi-urban India is
estimated to cross US$ 20 billion by 2018 and US$ 100 billion by 2025
The rural FMCG market expanded at a CAGR of 13.2 per cent to US$ 100 billion
during 2009-15x. In rural markets, durables like refrigerators as well as consumer
electronic goods are likely to witness growing demand in the coming years as the
government plans to invest significantly in rural electrification.
First Post, Dec 20, 2018 , Sonali Advani’s article titled, “Urban marketing: Say no to
price wars, relationships key”. Rural India has been in the spotlight for a while now,
with growing consumption rates. Middle India, home to about 100 million people, is
already contributing to 20 percent of the country's FMCG consumption, as per recent
media and industry reports. The bond between retailers and consumers in tier III and
IV towns tends to be quite strong and often extends into the personal sphere.
So if you are setting up your own stores, you'll have to work around processes that adapt
to such nuances. Big and fancy stores used to intimidate consumers (as they tend to
give the perception of being more expensive), but this is slowly changing.
From the above analysis of Literature Review the research which is not included above
is the 7 p’s of marketing which are followed in FMCG industry. The analysis of buyers
behaviour towards the different bath soap available in the market. Customer reaction
towards the new products and what are their needs and preferences. Also, a brief data
analysis of cultural, social, personal and psychological factors are affecting the buyers
behaviour.
CHAPTER 4
RESEARCH
METHODOLOGY
40
RESEARCH METHODOLOGY
A research methodology is the arrangement of condition for collection and
analysis of data in a manner that to, combine relevance to research purpose with
economy in procedure.
4.1 TITLE:
A COMPREHENSIVE STUDY OF THE BATH SOAP MARKET AND
ANALYSIS OF BUYERS BEHAVIOUR WITH SPECIAL REFERENCE TO
HUL.
4.2 OBJECTIVES OF STUDY:
1. To know about customer perception while purchasing bath soap product.
2. To study the soap brand people use on basis of age, occupation and income
class.
3. To study the customer association with the existing brand and reasons for
switching over to another brand.
4. To study the buyer’s awareness bout HUL bath soaps and their prices and
the place to purchase from.
5. To study the buyer’s awareness about the advertisement, offers and
promotional techniques of HUL.
6. To know about various brand and competitors of HUL soaps.
7. To know about the performance of popular brans of different companies in
the market.
8. To study what attributes motivate customers to buy a product.
9. To analyse the ranking of soap that customer give according to their
preferences.
4.3 Research Design:
“Research design is the logical and systematic planning and directing a piece of
research.” - P.V. Young
41
Research Design is conceptual structure within which research is conducted. It
constitutes the blue print of collection, measurement and analysis of data.
Research design is needed because it facilitates the smooth sailing of various
research operations, thereby making research as efficient as possible yielding
maximum information with minimum time, effort and money. Research Design
stands for advance planning of methods to be used for collecting relevant data
and techniques to be used in the analysis. The design helps researcher to organize
his ideas whereby it will be possible for him to look for flaws and inadequacies.
Research design is purely and simply the framework plans for study that guides the
collection and analysis of data. There are three major types of research design, i.e.,
exploratory research design, descriptive research design and experimental research
design. This study is basically exploratory analysis type.
Exploratory research
The idea gets deeper insight into competition in the bath soap market and to get buying
behavior of consumers. In order to address above-mentioned objectives (I) study of
secondary sources was carried out from internet, books, and Magazines (II) structured
questionnaire was designed to seek consumer responses.
Descriptive research
The data is analyzed, which was collected.
It is also known as quantitative research; it is designed to help executives of action that
is to make decision. This kind of design is used for more precise investigation or of
developing the working hypothesis from an operational point of view. It has inbuilt
flexibility, which is needed because the research problem, broadly defined initially, is
transformed into one with more precise meaning in exploratory studies, which in fact
may necessitate changes in research procedure for gathering relevant data.
Target population
The target population for ―A Comprehensive Study of Bath Soap Market and Analysis
of Buyer Behavior to Purchase the Bath Soap Product – With Special Reference to
42
Hindustan Unilever Ltd. is - Consumers, from different economical & demographical
background, which are purchasing & using bath soaps.
4.4 Collection of data
The data has collected from primary & secondary sources.
Secondary Data
The main aim of the project is to analyze the competition in occupying market
shares of various bath soap brands as compare to the brand of the HUL and the
consumer’s buying behavior of bath soap products. Therefore, it is necessary to
get considerable information about the competing brands. For this researcher
have gone through a lot of secondary data. A lot of issues of Business Today,
Economic Times were consulted. Books, magazines, internet, newspapers, journals,
company information both internal and external by company magazines, data and
bulletins related to the project topic.
Primary data
A survey was conducted through structured questionnaire. The study was done among
consumers who are using bath soap and conducted personal interview for collecting the
required information. It is original data, first hand and for the specific purpose of the
research project. For this project, researcher have used the following common research
instruments.
Questionnaire:
Questionnaire development is the critical part of primary data collection job. For this I
have prepared a questionnaire in such a way that it is able to collect all relevant
information regarding the project. In this questionnaire, I have used mostly close-ended
questions that are easier to be answered by respondents (consumers) and also easier for
interpretation and tabulation and some open-ended question to take the opinion of the
respondents in their own words. The questions were asked to the consumers covering
perception towards their purchase, price of the product, purpose for using the product,
characteristic of the product, brand image, effectiveness of the advertisements, sales
43
promotional activities, overall opinion about the product, etc.
For collecting the answers from the above questionnaire, I have used the following
common methods.
Interview:
It is the most common method for contacting consumers and collecting primary data.
For this project researcher have used following type of interview:-
Personal interview:
It is the most extensively used method. It enables better control of the sample and
ensures answers from the respondents. It also provides for a tactful approach to the
respondent since it is based on a person-to-person talk.
Researcher have used this technique to get the information of other competitor’s brands
of bath soap from retailers such as their availability in the shop and their market share
in Jaipur city. For this project each interview was taking 15 to 20 minutes to complete.
Interview was also delayed due to un-availability of respondent in shops.
Telephonic Interview
Telephonic interview is conducted for collecting the company’s information from the
company‘s Sales Executive who is handling the sales of Jaipur city or who has known
about the bath soap brands of HUL of the Jaipur city. Company person was always on
tour so it was not possible to conduct the personal interview with them. So, all the
information related to the company and bath soap brands is collected by the telephonic
interview.
4.5 Sampling
Sample unit
Consumers using the bath soap.
Sample plan
The selection of the samples is done following the two sampling techniques, which are:
44
- Simple random sampling
- Convenience sampling
Sample Location:
Consumers of bath soap in Jaipur city.
Sample size
Customers-200 (Both male & female) Retailers – 60 (All type of retail stores)
Scope of Study:
The geographical scope of the study was restricted to the Jaipur city due to time and
resource constraints. The study being exploratory in nature, the sample size was
restricted to 200 consumers and 60 retailers. In this study only bath soaps segment and
the customers of bath soaps are considered.
4.6 LIMITATIONS OF STUDY:
1. The problem researchers faced is in summarizing the vast data in short, simple
& presentable form.
2. Lack of scientific method.
3. Difficult to hit the right source of data & change according to my requirements.
4. It is a time consuming.
5. Lack of resources.
6. Lack of code of conduct and repetition may be there.
CHAPTER 5
DATA ANALYSIS
AND
INTERPRETATION
45
CHAPTER V
5.1 DATA ANALYSIS AND INTERPRATATION
The data, after collection, has to be processed and analysed in accordance with the
outline laid down for the purpose at the time of developing the research plan. This is
essential for a scientific study and for ensuring that researcher have all relevant data for
making contemplated comparisons and analysis. The processing implies editing,
coding, classification and tabulation of collected data so that they are amenable to
analysis.
The analysis of data in a general way involves a number of closely related question
starting from the profile of respondents to the analysis of buyer behaviour towards bath
soaps.
Apart from the personal data the questionnaire provided some questions through which
the perception of the individual as well as the shop keepers was obtained about the HUL
bath soap products and their future expectation so that the company can perform
accordingly.
The sample of 200 respondents randomly selected from the study area and sample size
of 60 shop keepers from the area were administered the questionnaire. The data so
collected has been presented hereunder and has also been analyzed.
RESPONDENT’S PERSONAL PROFILE
Part 1 consists of respondent’s profile which includes gender, age group, marital status,
educational background, occupation and family income.
The questionnaire is distributed tin two parts one is profile of respondents and in another
part, researcher asked about the brand of soap which they are using duration of their
usage, reason of switching, monthly consumption and impact of promotion scheme on
their decision making etc.
46
1. GENDER
The gender wise classification of the respondents has a bearing on the consumption
pattern of the goods. e.g. If in the family more number females are there naturally their
consumption of beauty care & skin care will be more. Keeping this aspect in mind the
researcher had called for this data which is presented hereunder:
Table 5.1: Gender wise Classification of Respondents
Gender No of Respondents Per% of Respondents
Male 104 52%
Female 96 48%
Total 200 100%
The total no. of respondents includes in the research is 200. Out of 200 respondents
there was 104 male and 96 female. So, the sample has contribution of both male 52%
and female 48% respondent. This means a fair analysis can be done about the buyers
behavior.
Male
52%
Female
48%
Fig. 5.1: Gender Wise Classification Of Respondents
47
2. AGE GROUP
The consumption of the toiletries, cosmetics, tea etc. depends on the age of the family
members, hence this data had been included in the questionnaire
Table 5.2 : Age wise composition of the respondents’ families
Age Group (In
years)
No of Respondents Per% of Respondents
20 to 30 51 25.5%
30 to 40 87 43.5%
40 to 80 62 31%
Total 200 100%
The above data has given about percentage of age wise composition of the respondent’s
family from a sample of 200 respondents. Most of the respondent lie in the age bracket
of 30 to 40 i.e. 87 and contribute 45.5% of sample size, 40 to 80 years i.e. 62 with 31%
of sample size further 20 to 30 years i.e. 51 with 25.5% respondents. It can be observed
that a fair no. of respondents is included in the survey.
51
87
62
0
10
20
30
40
50
60
70
80
90
100
20 to 30 30 to 40 40 to 80
Noofrespondents
Age group
Fig. 5.2 : Age Wise Composition of the Respondent's
Families
48
3. FAMILY MEMBERS
The consumption of the bath soaps depends on the number of the family. In the cities
the percentage of joint families is relatively less. If it is a joint family the numbers of
guests visiting the family are more and then their domestic requirements are also more.
Keeping this aspect in view this data had been included in the questionnaire.
Table 5.3: Size wise composition of the respondents’ families
No. of Family
Members
No. of
Respondents
Per% of
Respondents
1 10 5%
2 23 11%
3 42 21%
4 57 29%
5 or more 68 34%
Total 200 100%
From the above sample size of 200 there are 34% people in the family with 5 or more
persons and 29% and 21% people in the family with 4 and 3 persons respectively and
11% and 5% people in the family with 2 and 1 persons respectively. It can be seen that
highest contribution was from 5 or more people with 68 out of 200 respondents.
1
5%
2
11%
3
21%
4
29%
5 or more
34%
Fig.5.3: Size Wise Composition Of The Respondent's
Families
49
4. EDUCATIONAL BACKGROUND
The education of the respondent’s family had a bearing on the consumption of toiletries
as well as the other products of HUL. If the family was educated naturally they will be
hygiene oriented.
Table 5.4 : Education wise distribution of the respondents
Educational
Background
No. of Samples
Per% of
Respondents
10th
41 20.5%
12th
50 25%
Graduation 72 36%
Post graduation &
Above
37 18.5%
Total 200 100%
The above data revealed that most of respondents are quit educated as pie chart is
showing 36% respondents are graduate, 19% are Post graduate and above, 25% are 12th
and only 20% is 10th
pass. A fair per% of graduate were evaluated, so the analysis
become quiet realistic and understandable.
10th
20%
12th
25%Graduation
36%
Post
graduation &
Above
19%
Fig. 5.4 : Education Wise Distribution Of The
Respondents
50
5. Occupation
The occupation of the family had a bearing on the standard of living and the
consumption of toiletries. If the family has more children their needs, wants and
preferences were different and more. However, if one had employed his /her needs of
these items were more.
Table 5.5: Occupation wise classification of the respondent families.
Occupation
No of
respondents
Per% of
Respondents
Government service 45 22.5%
Executive 37 18.5%
Self Employee 37 18.5%
Student 48 24%
Others 33 16.5%
Total 200 100%
From the total sample size of 200, 31% are students, 27% are government employee,
16% are executive, again 16% are self employed, and 10% are lies in other occupations
like agriculture and farming etc. It can seen that highest per% of sample of students i.e,
31% so the data is collected from youth of India.
Government
service 27%
Executive 16%
Self Employee
16%
Student 31%
OTHES 10%
Fig. 5.5: Occupation Wise Classification Of The
Respondent Families
51
6. Earning Status
The size and composition of the family was vital, as the requirement of the products of
HUL volume wise was dependent upon the size of the family. So also the data relating
the earning members of the family was collected as the family purchasing power was
dependent on it. Keeping this aspect in view this data was collected.
Table 5.6: Earning status wise composition of the respondents
Earning Status No. of Members Per% of
Respondents
Earning Members 112 56%
Non-Earning
Members
88 44%
Total 200 100%
The above data revealed that out of the 200 respondents 56 per cent were earning
members and 44 per cent were non-earning members. This implies a major segment of
respondents were earning so a fair analysis can be obtained as a researcher because
income class has different needs and wants and different in case of non-income class.
Earning
Members
56%
Non-Earning
Members
44%
Fig. 5.6: Earning Status Wise Composition Of The
Respondents
52
7. INCOME GROUP
Family income of the respondent had definitely a great bearing on the family spending
on the toiletries which includes buying of combo sets & also prefer quality products
and less focus on price which is the motive of HUL.
Table 5.7 : Family income wise classification of the respondent families
Income Group
No of
respondents
Per% of
Respondents
0 – 1 Lakh 40 2%
1 – 2 Lakh 51 25.5%
2 – 3 Lakh 38 19%
3 – 4 Lakh 29 14.5%
Above 4 Lakh 42 21%
Total 200 100%
Interpretation
As it is very much well known that people are quit reluctant to tell their family income
so the above figures are not exact but representative, so according to that the 25%
people between 1 – 2 lakh income group, further below 1 Lakh there are 20%
people, between 2 – 3 Lakh there are 19% people, between 3 – 4 Lakh there are15%
people and above 4 Lakh there are 21% people. Rests of the 10% respondents are
dependent. They may be students and house wives.
0 – 1 Lakh
20%
1 – 2 Lakh
25%
2 – 3 Lakh
19%
3 – 4 Lakh
15%
Above 4 Lakh
21%
Fig. 5.7 : Family Income Wise Classification Of The
Respondent Families
53
PART 2: SURVEY QUESTIONS ANALYSIS
8. SOAP BRANDS PEOPLE USE
This is also a vital aspect so far as sells of HUL products are concerned. Knowledge of
the product is very much essential for the consumer. Knowledge of which soap brand
of HUL respondents has been aware of and the market share of different soap brands
of HUL can be obtained through this feedback.
Table 5.8 : Respondents knowledge of HUL products
Brands No of respondents Per% of Respondents
Lux 33 16%
Lifebouy 24 12%
Breeze 21 10%
Liril 23 12%
Hamam 18 9%
Pears 28 14%
Dove 25 13%
Others 28 13%
Total 200 100%
Lux
16%
Lifebouy
12%
Breeze
10%
Liril
12%
Hamam
9%
Pears
14%
Dove
13%
Others
14%
Fig. 5.8 : Respondents Knowledge of Hul Products
54
It is observed that majority of the products which were listed in the questionnaire were
known to the respondents. From the feedback it is observed that the products of HUL
had good penetration and there was good response.
It is found that most of the people like LUX i.e.16%, then the demand of Pears is 14%,
Dove is 13%, Breeze is 10%, Liril is 12%, Lifebuoy is 12% and Hamam is 9%. Rest of
the people use other soaps like Breeze, Liril, and Margo. Rest of the people use other
soaps like Medimix, Dettol, and Dayna etc.
9. ASSOCIATION WITH EXISTING BRANDS
This is an important factor in determining the loyal no. of customer the company have.
The respondents which are associates with less no. of duration researcher can analyse
the reason for short duration.
Table 5.9 : Respondents loyalty with HUL products
Duration
No of
respondents
Per% of
Respondents
1 Month 9 4%
6 Months 11 5%
1 Year 49 25%
2 or more years 131 66%
Total 200 100%
1 Month
4%
6 Months
5%
1 Year
25%
2 or more
years
66%
Fig. 5.9 : Respondents Loyalty With HUL
Products
55
Major chunk of population 66% is associated with associated with same brand from
more than two years. 25% from about one year, 5% from 6 months and 4% from 1 year.
It shows that a good amount of population is brand loyal in terms of bath soap as more
than ½ segment of sample associated with HUL bath soap for more than 2 years.
10. SWITCHOVER TO ANOTHER BRAND
This give a fair analysis about HUL bath soap satisfied customers and unsatisfied
customer by analyzing their behavior and preferences. The other brands of switchover
are : Dettol, Johnson & Jonhson, Medimex, Nivea, Savlon.
Table 5.10: Respondents Response over switching to another brand
Response
No. of
Respondents
Per% of
Respondents
Switchover to another Brand 18 9%
Continue with existing brand 173 86%
Not Responded 9 5%
Total 200 100%
Switchover to
another Brand
9%
Continue with
existing brand
86%
Not Responded
5%
Fig. 5.10: Respondents Response Over Switching To
Another Brand
56
The consumers thinking regarding with they will be continue with the same brand in
near future the response is in favor of companies as 86% people are ready to continue
with their existing brand. 9% people are susceptible to brand switching as they are not
convinced. This implies that HUL has a fair no. of loyal customer and the remaining
switching customer or already switched over customers reasons is analyzed by
researcher given below.
11. OTHER BRANDS BUYERS WANT TO SWITCHOVER ARE-
Some brands which the buyers want to shift or already shifted, HUL can bring customer
by focusing on their problems.
1. Dettol
2. Jonson & Jonson Baby
3. Nivea
4. Medimix
5. Savlon
12. REASON FOR SWITCHOVER TO ANOTHER BRAND
This is vital to analyze as it gives the company idea to finds what are the reasons for
which buyers are switching and it was necessary for the organization to understand this
aspect very clearly so that they can plan their future strategy focusing on those particular
aspects.
Table 5.12 : Respondents reasons for switching to another brand
Reasons for
switchover
No. of
Respondents
Per% of
Respondents
Price 2 11%
Quality 4 22%
Quantity 5 28%
Non-
Availability
4 22%
Other 3 17%
Total 18 100%
57
From the above 18 people who are switching over to the another brand 22% people are
unsatisfied with the non-availability of existing brand that‘s why they are switching
over and 11% each switchover because of price rises and 22% & 28% switchover
because of quality & quantity respectively and others 17% include effective
advertisement and sales promotion of other brands & lack of changes in their existing
brand.
13. PLACE TO PURCHASE FROM
This was an aspect which had a bearing on the marketing source available in the market.
There are various avenues open for the people which had given in the following table.
Table 5.13 : Place to purchase the soaps
Place for
Purchase
No. of
Respondents
Per% of
Respondents
Nearest Kirana
Shop
153
77%
Super shop 42 21%
Not responded 5 2%
Total 200 100%
Price
11%
Quality
22%
Quantity
28%
Non-
Availability
22%
Other
17%
Fig. 5.12 : Respondents Reasons for Switching to Another
Brand
58
The above data revealed that 77% of people still rely to their local kirana shops for Bath
Soaps and 21% purchase from super shop which includes Depatmental stores, Big Bazzar,
Dmart etc.
It means major source of procurement of their requirements was local provision stores, or
departmental stores. So HUL should focus on mainly product availability to kirana shops
also.
14. Consumption in package
This data was sought from the respondents to get feedback on the package they basically
used for their regular consumption. This gives researcher an idea about buyers prefer
combo pack for discounts or extras or they prefer single sets.
Table 5.14: Type of soap package for consumption
Types of
package
Consumption
Per% of
Respondents
Single pack 95 47%
Combo pack 105 53%
Total 200 100%
153
42
5
0
20
40
60
80
100
120
140
160
180
Nearest Kirana Shop Super shop Not responded
NO.OFRESPONDENTS
PLACE OF PURCHASE
FIG. 5.13 : Place to Purchase the Soaps
59
Above pie chart shows that 53% people prefers soap in combo pack (i.e.
Discount Pack) and the 47% people prefers soaps in single pack. This give an idea that
major segment prefer to use combo set for soap for their consumption. So HUL should
more foucs on bringing more benefits to combo pack customers to get more segment of
people.
Further the researcher classify the single pack consumption and combo pack
consumption of the buyers.
15. From the above analysis 47% out of 200 sample size
A. Single pack Consumption
Table 5.15.1 : Size frequently buy and average monthly consumption
Size No. of
buyers
Monthly Consumption Average Monthly
Consumption
45gm 1 3 3
75gm 11 44 4
100gm 18 36 2
125gm 8 16 2
The pie chart given below from above analysis is consists of size of soap with respect
to monthly consumption.
Single pack
47%
Combo pack
53%
Fig. 5.14: TYPE OF SOAP PACKAGE FOR
CONSUMPTION
60
From the above sample size there is 47% users of the 100gm size has high monthly
consumption in single size. 29% with 75gm pack, 21% with 125gm pack and only 3%
with 45gm pack. This means less segment of population used small size soap pack.
B. COMBO PACK COMSUPTION
Table 5.15.2 : Size frequently buy and average monthly consumption
Size No. of Buyers
Monthly
Consumption
Average
Monthly
Consumption
75gm × 4 25 52 2
100gm × 3 62 186 3
125gm × 4 65 260 4
45gm
3%
75gm
29%
100gm
47%
125gm
21%
Fig. 5.15.1 : Size Frequently Buy and Average Monthly
Consumption
75gm × 4
11%
100gm × 3
37%
125gm × 4
52%
Fig. 5.15.2 : Size Frequently Buy and Average
Monthly Consumption
61
From the above sample size there is 52% users of the 125gm× 4 size and also 125gm×
4 gm has highest monthly consumption in combo pack. Followed by 37% users of
100gm x 3 and 11% users of 75gm x 4.
From the above analysis of both single and combo pack consumption users the small
size packing of soaps is less preferred by users, it can only used for travelling or as a
toilet soap less preferred for bathing.
16. SOURCE OF INFORMATION
This is also a vital aspect so far as sells of HUL products are concerned. Knowledge of
the product is very much essential for the consumer. Knowledge of which
advertisement area is powerful in the urban area can be obtained through this feedback.
Table 5.16 : Sources of information of HUL products
Sources of Information No. of Respondents Per% of Respondents
TV 71 35%
Print 47 23%
Radio 32 16%
Store Display 22 11%
Hoardings 15 8%
Friends & Family 13 7%
Total 200 100%
71
47
32
22
15 13
35%
23%
16%
11%
8% 7%
0%
5%
10%
15%
20%
25%
30%
35%
40%
0
10
20
30
40
50
60
70
80
TV Print Radio Store Display Hoardings Friends &
Family
PER%OFRESPONDENTS
NO.OFRESPONDENTS
SOURCES OF INFORMATION
Fig. 5.16 : Sources of Information of HUL Products
62
How a consumer came to know about a particular brand it is very much important for
marketers, because with the help of this they can reach to their market in better way.
Itis clear from the finding the T.V Advertisements are the major source of information
for customers; rest contributes marginally to the brand awareness.
17.Effects of Sales Promotion like 3Rs off or 25 gm extra
This data was sought from the respondents to get feedback on the effect on sales
promotion techniques on the customer mindset. This was a vital aspect that needed to
be understood. Consumer’s buying decisions were dependent on several factors. It was
necessary for the marketing organization to understand this aspect very clearly so that
they can plan their marketing strategy focusing on those particular aspects.
Table 5.17 : Effect of sales promotion response
Response No. of Respondents Per% of Respondents
Yes 171 85%
No 29 15%
Total 200 100%
Almost 85% customer‘s agreed that sales promotion schemes do effect the buying
decisions. Sales promotion technically motivates the customer to buy the product it
includes price off deals, extras, discounts, coupons, buy 1+1 offers etc. But still 15%
respondents still don’t buy through offers.
Yes
85%
No
15%
Fig.. 5.17 : Effect of Sales Promotion Response
63
18. ATTRIBUTES MOTIVATES TO PURCHASE THE BRAND
This was a vital aspect that needed to be understood. Consumer’s buying decisions were
dependent on several factors. It was necessary for the marketing organization to
understand this aspect very clearly so that they can plan their marketing strategy
focusing on those particular aspects.
Table 5.18 : Different attribute motivates buyers to buy
Attributes No. of Respondents Per% of Respondents
Brand Name 37 18%
Advertisements 15 7%
Attractive Packaging 20 10%
Quality 43 21%
Attractive Offers 21 11%
Health 17 9%
Price 24 12%
Fragrances 7 7%
Health & Skincare 16 8%
Other 0 0%
37
15
20
43
21
17
24
7
16
0
0
5
10
15
20
25
30
35
40
45
50
NO.OFRESPONDENTS
ATTRIBUTES
FIG. 5.18 : Different Attribute Motivates Buyers To
Buy
64
When it comes to why a customer opts for a brand, which attributes attract him most?
The opinion is divided into lot of factors, lot of customer prefer for more than one
attribute. But three core attribute on which the whole bath soap market is standing are-
 Quality 21%
 Brand Name 178
 Price 12%
Interestingly 8% customers feel health also as a choice criterion.
19. RANKING TO ATTRIBUTES
Over the past few years because of the Govt. of India Swatch Bharat Abhiyan efforts
there is development of quality products at affordable prices have been introduced.
Through which the purchasing power of the masses has undergone change which has a
positive change on their life style also. This is reflected that gradually the low-quality
goods which were locally manufactured goods which used to be earlier available in the
markets have gradually paved the way for the standard quality / branded goods. The
researcher wanted to have perception of the buyers on this score and hence this
statement was included in the statement.
Table 5.19 : Grading of attribute that motivates buyers to buy
Grade/
attribute
Very High High Mediun Low Very Low
Fragrance 21 29 10 2 8
Quality 32 22 9 7 0
Packaging 14 24 23 8 1
Price 21 24 14 8 3
Advertisement 12 7 22 22 7
Brand image 11 12 19 17 11
Health 26 16 13 6 9
65
A Pareto chart is a type of chart that contains both bars and a line graph, where
individual values are represented in descending order by bars, and the cumulative total
is represented by the line. It summarized the total ranking into a single unified bar
graph. That helps reader to understand it quickly from high rank attribute to low rank
attribute.
The graphical representation of 200 sample size shows that the customer gives
preferences accordingly –
1st
preference to the quality,
2nd
preference to the health,
3rd
preference to fragrance,
4th
preference to the price and
5th
preference to the packing.
Above attributes motivates to the customers to purchase the bath soap brand. Their may
be some more aspects which may not be included but the company has to focus on
quality as this is the main aspect customer is looking for.
Project Report on 7 p's of Marketing with Special Reference to FMCG industry in India

More Related Content

What's hot

The future of rural marketing
The future of rural marketingThe future of rural marketing
The future of rural marketingVikram Ram
 
Product profiling of marico
Product profiling of maricoProduct profiling of marico
Product profiling of maricoAAKASHSHARMA280
 
A PROJECT REPORT ON MARKETING RESEARCH
A PROJECT REPORT ON MARKETING RESEARCHA PROJECT REPORT ON MARKETING RESEARCH
A PROJECT REPORT ON MARKETING RESEARCHsanjay3017
 
Marketing strategy of dabur india ltd
Marketing strategy of dabur india ltdMarketing strategy of dabur india ltd
Marketing strategy of dabur india ltdAbhishek Keshri
 
ITC Classmate Brand Extension
ITC Classmate Brand ExtensionITC Classmate Brand Extension
ITC Classmate Brand ExtensionSameer Mathur
 
Internship Report on ITC Ltd. "A Study of various factors leading to purchase...
Internship Report on ITC Ltd. "A Study of various factors leading to purchase...Internship Report on ITC Ltd. "A Study of various factors leading to purchase...
Internship Report on ITC Ltd. "A Study of various factors leading to purchase...Justus George
 
Segmentation Targeting Positioning OF Hindustan Unilever limited
Segmentation Targeting Positioning OF Hindustan Unilever limitedSegmentation Targeting Positioning OF Hindustan Unilever limited
Segmentation Targeting Positioning OF Hindustan Unilever limitedPankajSultane
 
Marico(Marketing Strategy-4Ps)
Marico(Marketing Strategy-4Ps)Marico(Marketing Strategy-4Ps)
Marico(Marketing Strategy-4Ps)Tasneem Kausar
 
MBA Marketing SIP Report
MBA Marketing SIP ReportMBA Marketing SIP Report
MBA Marketing SIP Reportdharam93
 
IMC Presentation on Dettol
IMC Presentation on Dettol  IMC Presentation on Dettol
IMC Presentation on Dettol Sachin Chavan
 
Project Report on Retail Coverage of ITC
Project Report on Retail Coverage of ITCProject Report on Retail Coverage of ITC
Project Report on Retail Coverage of ITCJiten Sharma
 
Product mix of tata industries
Product mix of tata industriesProduct mix of tata industries
Product mix of tata industriesGovind14
 
Hindustan Unilever Limited Strategy
Hindustan Unilever Limited StrategyHindustan Unilever Limited Strategy
Hindustan Unilever Limited StrategyMayank Kumar
 
Presentation of d mart
Presentation of d martPresentation of d mart
Presentation of d martganaraya
 

What's hot (20)

The future of rural marketing
The future of rural marketingThe future of rural marketing
The future of rural marketing
 
Product profiling of marico
Product profiling of maricoProduct profiling of marico
Product profiling of marico
 
A PROJECT REPORT ON MARKETING RESEARCH
A PROJECT REPORT ON MARKETING RESEARCHA PROJECT REPORT ON MARKETING RESEARCH
A PROJECT REPORT ON MARKETING RESEARCH
 
Marketing strategy of dabur india ltd
Marketing strategy of dabur india ltdMarketing strategy of dabur india ltd
Marketing strategy of dabur india ltd
 
ITC Classmate Brand Extension
ITC Classmate Brand ExtensionITC Classmate Brand Extension
ITC Classmate Brand Extension
 
Internship Report on ITC Ltd. "A Study of various factors leading to purchase...
Internship Report on ITC Ltd. "A Study of various factors leading to purchase...Internship Report on ITC Ltd. "A Study of various factors leading to purchase...
Internship Report on ITC Ltd. "A Study of various factors leading to purchase...
 
Bcg matrix of itc ltd
Bcg matrix of itc ltdBcg matrix of itc ltd
Bcg matrix of itc ltd
 
Segmentation Targeting Positioning OF Hindustan Unilever limited
Segmentation Targeting Positioning OF Hindustan Unilever limitedSegmentation Targeting Positioning OF Hindustan Unilever limited
Segmentation Targeting Positioning OF Hindustan Unilever limited
 
Marico(Marketing Strategy-4Ps)
Marico(Marketing Strategy-4Ps)Marico(Marketing Strategy-4Ps)
Marico(Marketing Strategy-4Ps)
 
MBA Marketing SIP Report
MBA Marketing SIP ReportMBA Marketing SIP Report
MBA Marketing SIP Report
 
IMC Presentation on Dettol
IMC Presentation on Dettol  IMC Presentation on Dettol
IMC Presentation on Dettol
 
Oil
OilOil
Oil
 
Project Report on Retail Coverage of ITC
Project Report on Retail Coverage of ITCProject Report on Retail Coverage of ITC
Project Report on Retail Coverage of ITC
 
ITC- Distribution Channel
ITC- Distribution ChannelITC- Distribution Channel
ITC- Distribution Channel
 
Product mix of tata industries
Product mix of tata industriesProduct mix of tata industries
Product mix of tata industries
 
Stp marico
Stp maricoStp marico
Stp marico
 
My SIP Report
My SIP ReportMy SIP Report
My SIP Report
 
Hindustan Unilever Limited Strategy
Hindustan Unilever Limited StrategyHindustan Unilever Limited Strategy
Hindustan Unilever Limited Strategy
 
Dabur
DaburDabur
Dabur
 
Presentation of d mart
Presentation of d martPresentation of d mart
Presentation of d mart
 

Similar to Project Report on 7 p's of Marketing with Special Reference to FMCG industry in India

Changing trends of fmcg report (dharm project)
Changing trends of fmcg report (dharm project)Changing trends of fmcg report (dharm project)
Changing trends of fmcg report (dharm project)Dharmendra Kumar
 
study of sales and distribution of slice and its market share at pepsico indi...
study of sales and distribution of slice and its market share at pepsico indi...study of sales and distribution of slice and its market share at pepsico indi...
study of sales and distribution of slice and its market share at pepsico indi...Babina Baburaj
 
Jithara dharmesh 137730592028 sadhariya jagdish 137730592062
Jithara dharmesh 137730592028 sadhariya jagdish 137730592062Jithara dharmesh 137730592028 sadhariya jagdish 137730592062
Jithara dharmesh 137730592028 sadhariya jagdish 137730592062jitharadharmesh
 
Jithara dharmesh 137730592028 sadhariya jagdish 137730592062 ROLE OF SALES PR...
Jithara dharmesh 137730592028 sadhariya jagdish 137730592062 ROLE OF SALES PR...Jithara dharmesh 137730592028 sadhariya jagdish 137730592062 ROLE OF SALES PR...
Jithara dharmesh 137730592028 sadhariya jagdish 137730592062 ROLE OF SALES PR...jitharadharmesh
 
SIP Report-JSPL.docx
SIP Report-JSPL.docxSIP Report-JSPL.docx
SIP Report-JSPL.docxAnimesh68
 
The impact of consumer sales promotion on customer buying behavior with speci...
The impact of consumer sales promotion on customer buying behavior with speci...The impact of consumer sales promotion on customer buying behavior with speci...
The impact of consumer sales promotion on customer buying behavior with speci...Janith Chandranath
 
Vikas project on Hindustan Times
Vikas project on Hindustan TimesVikas project on Hindustan Times
Vikas project on Hindustan TimesAnish Sharma
 
MODULE-PRINCIPLES OF MARKETING (1).pdf
MODULE-PRINCIPLES OF MARKETING (1).pdfMODULE-PRINCIPLES OF MARKETING (1).pdf
MODULE-PRINCIPLES OF MARKETING (1).pdfssuseref2279
 
Module 2 Session 1 (Part 1).pdf
Module 2 Session 1 (Part 1).pdfModule 2 Session 1 (Part 1).pdf
Module 2 Session 1 (Part 1).pdfJanelMendoza2
 
Customer satisfaction towards herbal product
Customer satisfaction towards herbal productCustomer satisfaction towards herbal product
Customer satisfaction towards herbal productSHIVAKUMARKAREKYATAN
 
Practices of IMC in Fast Moving Consumer Goods in Bangladesh
Practices of IMC in Fast Moving Consumer Goods in BangladeshPractices of IMC in Fast Moving Consumer Goods in Bangladesh
Practices of IMC in Fast Moving Consumer Goods in BangladeshEnamul Islam
 
PECs PRODUCT DEV.pptx
PECs PRODUCT DEV.pptxPECs PRODUCT DEV.pptx
PECs PRODUCT DEV.pptxRoelTabuyo2
 
sales and distribution of HUL products.pdf
sales and distribution of HUL products.pdfsales and distribution of HUL products.pdf
sales and distribution of HUL products.pdfSarthakGarg462634
 
Retail sector in india (national handloom)
Retail sector in india (national handloom)Retail sector in india (national handloom)
Retail sector in india (national handloom)Yash Agarwal
 
COMPITITIVE ANALYSIS OF FROOTI & IT’S COMPITITORS
COMPITITIVE ANALYSIS OF FROOTI & IT’S COMPITITORSCOMPITITIVE ANALYSIS OF FROOTI & IT’S COMPITITORS
COMPITITIVE ANALYSIS OF FROOTI & IT’S COMPITITORSjohn1234calvin
 

Similar to Project Report on 7 p's of Marketing with Special Reference to FMCG industry in India (20)

Changing trends of fmcg report (dharm project)
Changing trends of fmcg report (dharm project)Changing trends of fmcg report (dharm project)
Changing trends of fmcg report (dharm project)
 
study of sales and distribution of slice and its market share at pepsico indi...
study of sales and distribution of slice and its market share at pepsico indi...study of sales and distribution of slice and its market share at pepsico indi...
study of sales and distribution of slice and its market share at pepsico indi...
 
Jithara dharmesh 137730592028 sadhariya jagdish 137730592062
Jithara dharmesh 137730592028 sadhariya jagdish 137730592062Jithara dharmesh 137730592028 sadhariya jagdish 137730592062
Jithara dharmesh 137730592028 sadhariya jagdish 137730592062
 
Jithara dharmesh 137730592028 sadhariya jagdish 137730592062 ROLE OF SALES PR...
Jithara dharmesh 137730592028 sadhariya jagdish 137730592062 ROLE OF SALES PR...Jithara dharmesh 137730592028 sadhariya jagdish 137730592062 ROLE OF SALES PR...
Jithara dharmesh 137730592028 sadhariya jagdish 137730592062 ROLE OF SALES PR...
 
SIP Report-JSPL.docx
SIP Report-JSPL.docxSIP Report-JSPL.docx
SIP Report-JSPL.docx
 
SUMMER INTERNSHIP
SUMMER INTERNSHIPSUMMER INTERNSHIP
SUMMER INTERNSHIP
 
The impact of consumer sales promotion on customer buying behavior with speci...
The impact of consumer sales promotion on customer buying behavior with speci...The impact of consumer sales promotion on customer buying behavior with speci...
The impact of consumer sales promotion on customer buying behavior with speci...
 
Amul final pdf
Amul final pdfAmul final pdf
Amul final pdf
 
SIP Report madhavi
SIP Report madhaviSIP Report madhavi
SIP Report madhavi
 
Vikas project on Hindustan Times
Vikas project on Hindustan TimesVikas project on Hindustan Times
Vikas project on Hindustan Times
 
MODULE-PRINCIPLES OF MARKETING (1).pdf
MODULE-PRINCIPLES OF MARKETING (1).pdfMODULE-PRINCIPLES OF MARKETING (1).pdf
MODULE-PRINCIPLES OF MARKETING (1).pdf
 
Building a New Corporate Culture for Business Development in a Transition Eco...
Building a New Corporate Culture for Business Development in a Transition Eco...Building a New Corporate Culture for Business Development in a Transition Eco...
Building a New Corporate Culture for Business Development in a Transition Eco...
 
Module 2 Session 1 (Part 1).pdf
Module 2 Session 1 (Part 1).pdfModule 2 Session 1 (Part 1).pdf
Module 2 Session 1 (Part 1).pdf
 
Customer satisfaction towards herbal product
Customer satisfaction towards herbal productCustomer satisfaction towards herbal product
Customer satisfaction towards herbal product
 
Practices of IMC in Fast Moving Consumer Goods in Bangladesh
Practices of IMC in Fast Moving Consumer Goods in BangladeshPractices of IMC in Fast Moving Consumer Goods in Bangladesh
Practices of IMC in Fast Moving Consumer Goods in Bangladesh
 
PECs.pptx
PECs.pptxPECs.pptx
PECs.pptx
 
PECs PRODUCT DEV.pptx
PECs PRODUCT DEV.pptxPECs PRODUCT DEV.pptx
PECs PRODUCT DEV.pptx
 
sales and distribution of HUL products.pdf
sales and distribution of HUL products.pdfsales and distribution of HUL products.pdf
sales and distribution of HUL products.pdf
 
Retail sector in india (national handloom)
Retail sector in india (national handloom)Retail sector in india (national handloom)
Retail sector in india (national handloom)
 
COMPITITIVE ANALYSIS OF FROOTI & IT’S COMPITITORS
COMPITITIVE ANALYSIS OF FROOTI & IT’S COMPITITORSCOMPITITIVE ANALYSIS OF FROOTI & IT’S COMPITITORS
COMPITITIVE ANALYSIS OF FROOTI & IT’S COMPITITORS
 

Recently uploaded

The Pitfalls of Keyword Stuffing in SEO Copywriting
The Pitfalls of Keyword Stuffing in SEO CopywritingThe Pitfalls of Keyword Stuffing in SEO Copywriting
The Pitfalls of Keyword Stuffing in SEO CopywritingJuan Pineda
 
Common Culture: Paul Willis Symbolic Creativity
Common Culture: Paul Willis Symbolic CreativityCommon Culture: Paul Willis Symbolic Creativity
Common Culture: Paul Willis Symbolic CreativityMonishka Adhikari
 
From Chance to Choice - Tactical Link Building for International SEO
From Chance to Choice - Tactical Link Building for International SEOFrom Chance to Choice - Tactical Link Building for International SEO
From Chance to Choice - Tactical Link Building for International SEOSzymon Słowik
 
(Generative) AI & Marketing: - Out of the Hype - Empowering the Marketing M...
(Generative) AI & Marketing: - Out of the Hype - Empowering the Marketing M...(Generative) AI & Marketing: - Out of the Hype - Empowering the Marketing M...
(Generative) AI & Marketing: - Out of the Hype - Empowering the Marketing M...Hugues Rey
 
Jai Institute for Parenting Program Guide
Jai Institute for Parenting Program GuideJai Institute for Parenting Program Guide
Jai Institute for Parenting Program Guidekiva6
 
Exploring The World Of Adult Ad Networks.pdf
Exploring The World Of Adult Ad Networks.pdfExploring The World Of Adult Ad Networks.pdf
Exploring The World Of Adult Ad Networks.pdfadult marketing
 
DGR_Digital Advertising Strategies for a Cookieless World_Presentation.pdf
DGR_Digital Advertising Strategies for a Cookieless World_Presentation.pdfDGR_Digital Advertising Strategies for a Cookieless World_Presentation.pdf
DGR_Digital Advertising Strategies for a Cookieless World_Presentation.pdfDemandbase
 
Most Impressive Construction Leaders in Tech, Making Waves in the Industry, 2...
Most Impressive Construction Leaders in Tech, Making Waves in the Industry, 2...Most Impressive Construction Leaders in Tech, Making Waves in the Industry, 2...
Most Impressive Construction Leaders in Tech, Making Waves in the Industry, 2...CIO Business World
 
The power of SEO-driven market intelligence
The power of SEO-driven market intelligenceThe power of SEO-driven market intelligence
The power of SEO-driven market intelligenceHinde Lamrani
 
Mastering SEO in the Evolving AI-driven World
Mastering SEO in the Evolving AI-driven WorldMastering SEO in the Evolving AI-driven World
Mastering SEO in the Evolving AI-driven WorldScalenut
 
Inbound Marekting 2.0 - The Paradigm Shift in Marketing | Axon Garside
Inbound Marekting 2.0 - The Paradigm Shift in Marketing | Axon GarsideInbound Marekting 2.0 - The Paradigm Shift in Marketing | Axon Garside
Inbound Marekting 2.0 - The Paradigm Shift in Marketing | Axon Garsiderobwhite630290
 
Influencer Marketing Power point presentation
Influencer Marketing  Power point presentationInfluencer Marketing  Power point presentation
Influencer Marketing Power point presentationdgtivemarketingagenc
 
Fueling A_B experiments with behavioral insights (1).pdf
Fueling A_B experiments with behavioral insights (1).pdfFueling A_B experiments with behavioral insights (1).pdf
Fueling A_B experiments with behavioral insights (1).pdfVWO
 
2024 SEO Trends for Business Success (WSA)
2024 SEO Trends for Business Success (WSA)2024 SEO Trends for Business Success (WSA)
2024 SEO Trends for Business Success (WSA)Jomer Gregorio
 
Most Influential HR Leaders Leading the Corporate World, 2024 (Final file).pdf
Most Influential HR Leaders Leading the Corporate World, 2024 (Final file).pdfMost Influential HR Leaders Leading the Corporate World, 2024 (Final file).pdf
Most Influential HR Leaders Leading the Corporate World, 2024 (Final file).pdfCIO Business World
 
The 10 Most Influential CMO's Leading the Way of Success, 2024 (Final file) (...
The 10 Most Influential CMO's Leading the Way of Success, 2024 (Final file) (...The 10 Most Influential CMO's Leading the Way of Success, 2024 (Final file) (...
The 10 Most Influential CMO's Leading the Way of Success, 2024 (Final file) (...CIO Business World
 
Exploring Web 3.0 Growth marketing: Navigating the Future of the Internet
Exploring Web 3.0 Growth marketing: Navigating the Future of the InternetExploring Web 3.0 Growth marketing: Navigating the Future of the Internet
Exploring Web 3.0 Growth marketing: Navigating the Future of the Internetnehapardhi711
 
Digital Marketing Spotlight: Lifecycle Advertising Strategies.pdf
Digital Marketing Spotlight: Lifecycle Advertising Strategies.pdfDigital Marketing Spotlight: Lifecycle Advertising Strategies.pdf
Digital Marketing Spotlight: Lifecycle Advertising Strategies.pdfDemandbase
 
Research and Discovery Tools for Experimentation - 17 Apr 2024 - v 2.3 (1).pdf
Research and Discovery Tools for Experimentation - 17 Apr 2024 - v 2.3 (1).pdfResearch and Discovery Tools for Experimentation - 17 Apr 2024 - v 2.3 (1).pdf
Research and Discovery Tools for Experimentation - 17 Apr 2024 - v 2.3 (1).pdfVWO
 
5 Digital Marketing Tips | Devherds Software Solutions
5 Digital Marketing Tips | Devherds Software Solutions5 Digital Marketing Tips | Devherds Software Solutions
5 Digital Marketing Tips | Devherds Software SolutionsDevherds Software Solutions
 

Recently uploaded (20)

The Pitfalls of Keyword Stuffing in SEO Copywriting
The Pitfalls of Keyword Stuffing in SEO CopywritingThe Pitfalls of Keyword Stuffing in SEO Copywriting
The Pitfalls of Keyword Stuffing in SEO Copywriting
 
Common Culture: Paul Willis Symbolic Creativity
Common Culture: Paul Willis Symbolic CreativityCommon Culture: Paul Willis Symbolic Creativity
Common Culture: Paul Willis Symbolic Creativity
 
From Chance to Choice - Tactical Link Building for International SEO
From Chance to Choice - Tactical Link Building for International SEOFrom Chance to Choice - Tactical Link Building for International SEO
From Chance to Choice - Tactical Link Building for International SEO
 
(Generative) AI & Marketing: - Out of the Hype - Empowering the Marketing M...
(Generative) AI & Marketing: - Out of the Hype - Empowering the Marketing M...(Generative) AI & Marketing: - Out of the Hype - Empowering the Marketing M...
(Generative) AI & Marketing: - Out of the Hype - Empowering the Marketing M...
 
Jai Institute for Parenting Program Guide
Jai Institute for Parenting Program GuideJai Institute for Parenting Program Guide
Jai Institute for Parenting Program Guide
 
Exploring The World Of Adult Ad Networks.pdf
Exploring The World Of Adult Ad Networks.pdfExploring The World Of Adult Ad Networks.pdf
Exploring The World Of Adult Ad Networks.pdf
 
DGR_Digital Advertising Strategies for a Cookieless World_Presentation.pdf
DGR_Digital Advertising Strategies for a Cookieless World_Presentation.pdfDGR_Digital Advertising Strategies for a Cookieless World_Presentation.pdf
DGR_Digital Advertising Strategies for a Cookieless World_Presentation.pdf
 
Most Impressive Construction Leaders in Tech, Making Waves in the Industry, 2...
Most Impressive Construction Leaders in Tech, Making Waves in the Industry, 2...Most Impressive Construction Leaders in Tech, Making Waves in the Industry, 2...
Most Impressive Construction Leaders in Tech, Making Waves in the Industry, 2...
 
The power of SEO-driven market intelligence
The power of SEO-driven market intelligenceThe power of SEO-driven market intelligence
The power of SEO-driven market intelligence
 
Mastering SEO in the Evolving AI-driven World
Mastering SEO in the Evolving AI-driven WorldMastering SEO in the Evolving AI-driven World
Mastering SEO in the Evolving AI-driven World
 
Inbound Marekting 2.0 - The Paradigm Shift in Marketing | Axon Garside
Inbound Marekting 2.0 - The Paradigm Shift in Marketing | Axon GarsideInbound Marekting 2.0 - The Paradigm Shift in Marketing | Axon Garside
Inbound Marekting 2.0 - The Paradigm Shift in Marketing | Axon Garside
 
Influencer Marketing Power point presentation
Influencer Marketing  Power point presentationInfluencer Marketing  Power point presentation
Influencer Marketing Power point presentation
 
Fueling A_B experiments with behavioral insights (1).pdf
Fueling A_B experiments with behavioral insights (1).pdfFueling A_B experiments with behavioral insights (1).pdf
Fueling A_B experiments with behavioral insights (1).pdf
 
2024 SEO Trends for Business Success (WSA)
2024 SEO Trends for Business Success (WSA)2024 SEO Trends for Business Success (WSA)
2024 SEO Trends for Business Success (WSA)
 
Most Influential HR Leaders Leading the Corporate World, 2024 (Final file).pdf
Most Influential HR Leaders Leading the Corporate World, 2024 (Final file).pdfMost Influential HR Leaders Leading the Corporate World, 2024 (Final file).pdf
Most Influential HR Leaders Leading the Corporate World, 2024 (Final file).pdf
 
The 10 Most Influential CMO's Leading the Way of Success, 2024 (Final file) (...
The 10 Most Influential CMO's Leading the Way of Success, 2024 (Final file) (...The 10 Most Influential CMO's Leading the Way of Success, 2024 (Final file) (...
The 10 Most Influential CMO's Leading the Way of Success, 2024 (Final file) (...
 
Exploring Web 3.0 Growth marketing: Navigating the Future of the Internet
Exploring Web 3.0 Growth marketing: Navigating the Future of the InternetExploring Web 3.0 Growth marketing: Navigating the Future of the Internet
Exploring Web 3.0 Growth marketing: Navigating the Future of the Internet
 
Digital Marketing Spotlight: Lifecycle Advertising Strategies.pdf
Digital Marketing Spotlight: Lifecycle Advertising Strategies.pdfDigital Marketing Spotlight: Lifecycle Advertising Strategies.pdf
Digital Marketing Spotlight: Lifecycle Advertising Strategies.pdf
 
Research and Discovery Tools for Experimentation - 17 Apr 2024 - v 2.3 (1).pdf
Research and Discovery Tools for Experimentation - 17 Apr 2024 - v 2.3 (1).pdfResearch and Discovery Tools for Experimentation - 17 Apr 2024 - v 2.3 (1).pdf
Research and Discovery Tools for Experimentation - 17 Apr 2024 - v 2.3 (1).pdf
 
5 Digital Marketing Tips | Devherds Software Solutions
5 Digital Marketing Tips | Devherds Software Solutions5 Digital Marketing Tips | Devherds Software Solutions
5 Digital Marketing Tips | Devherds Software Solutions
 

Project Report on 7 p's of Marketing with Special Reference to FMCG industry in India

  • 1. A Project Report on 7 P’s of Marketing in Special Reference to FMCG Industry in India Submitted in Partial Fulfillment for the Degree of Bachelor of Business Administration S.S. Jain Subodh PG (Autonomous) College 2019-20 SUBMITTED BY : SUBMITTED TO : Deepak Kewlani (1841040) Dr. Tapasya Julka Dharhohar Yadav (1841041) Head, Deptt. of Bus. Admn. Dheeraj Agarwal (1841042) Dhruv Kumar (1841043) Dimple Faujdar (1841042) BBA VI SEM.
  • 2. CERTIFICATE This is to certify that the Project Report entitled “7 P’s of Marketing in Special Reference to FMCG Industry in India” is a record of project work done by Dheeraj Agarwal student of BBA Sem VI under my guidance and supervision and that it has not previously formed the basis for the award of any degree, fellowship or associate ship. Dr. Tapasya Julka Head, Deptt. of Bus. Admn. S.S. Jain Subodh P.G. (Autonomous) College Jaipur
  • 3. DECLARATION Dheeraj Agarwal student of BBA Sem VI hereby declare that the project work presented in this report is their own work and has been carried out under the supervision of Dr. Tapasya Julka Head, Deptt. of Bus. Admn. of S.S Jain Subodh P.G(Autonomous) College. This work has not been previously submitted to any other university for any examination. Dheeraj Agarwal S.S. Jain Subodh P.G. (Autonomous) College Jaipur
  • 4. ACKNOWLEDGEMENT It is not often in life that you get a chance of appreciating and expressing your feelings in black and white to thank the people who have been a crucial part of your successes, your accomplishments, and your being what you are today. I take this opportunity to first of all thank the Faculty at S.S. Jain Subodh P.G.(Autonomous) College, especially Prof. K.B.Sharma, Principal, and Dr. Chitra Rathore, Head, Department of BBA for inculcating and instilling me the knowledge, learning, will-power, values and the competitiveness and professionalism required by me as a management student. I would like to give special thanks to Dr. Tapasya Julka Head, Deptt. of Bus. Admn. for educating me silver lining in every dark cloud. Her enduring efforts, guidance, patience and enthusiasm have given a sense of direction and purposefulness to this project and ultimately made it a success. I express my sincere and heartiest thanks to everyone who has contributed towards the successful completion of the Project. Last but not the least; I would like to thank my family: my parents for supporting me spiritually throughout my life. The errors and inconsistencies remain my own. Dheeraj Agarwal
  • 5. CONTENT PAGE NO. CHAPTER 1: INTRODUCTION…………………………………..1-20 1.1 Introduction of FMCG…………………………………………………………...01 1.2 Overview of Marketing…………………………………………….……………02 1.3 7 P’s of Marketing…………………………………………………...…………..05 1.4 Key features of Marketing Mix……………………...………………….………..14 1.5 Developing a Marketing Mix……………………………………...……………..15 1.6 SWOT analysis of 7 P’s…………………………………………………………16 1.7 Buyers Behaviour………………………………………………………………. 17 CHAPTER 2: COMPANY PROFILE………………………….…21-31 2.1 Company Background……………………………………..…………………….21 2.2 Study of HUL Bath soap…………………………………………..……………..23 2.3 SWOT analysis of HUL………………………………………………….………28 2.4 Competitors analysis…………………………………………………………….29 2.5 Market share of HUL Bath soap product………………………………..………..30 CHAPTER 3: REVIEW OF LITERATURE…………...…….…..32-39 3.1 From National and International Journals, Books & Newspapers…………..…....32 CHAPTER 4: RESEARCH METHODOLOGY………………...40-44 4.1 Title………………………………………………………………………..…….40 4.2 Objectives of the study…………………………………………………….…….40 4.3 Research Design…………………………………………………………………41 4.4 Collection of Data………………………………………………………………..42 4.5 Sampling………………………………………………………………………...43 4.6 Limitations of Study…………..……………………………………………...….44
  • 6. CHAPTER 5: ANALYSIS AND INTERPRETATION……….....45-75 5.1 Respondents Personal Profile…………….……………………...……..………..45 5.2 Analysis of Buyer’s Behaviour…………………………………………………..68 5.3 Retailers Data Analysis…………………………...…...…………………...……73 CHAPTER 6: SUMMARY OF FINDINGS……...……………….76-82 6.1 Findings………………………………………………………………….………76 6.2 Conclusion…………...………………………………………………………….77 6.3 Recommendations...……………………………………………………………..78 6.4 Scope of Further Study…………………………………………………………..82 APPENDIX………………………………..………………………..83-87 Bibliography……………………………………………………………………….....83 Questionnaire………………………………………………………………………...85
  • 8. 1 1.1 INTRODUCTION OF FMCG Meaning of FMCG - FMCG refers to Fast Moving Consumer Goods, requirement for daily or frequent use. Typically, a consumer buys these goods at least once a month. The sector covers a wide gamut of products such as detergents, toilet soaps, toothpastes shampoos, creams, powders, food products, confectioneries, beverages, cigarettes. Typical characteristics of FMCG products. Fast-moving consumer goods (FMCG), also called consumer packaged goods (CPG), refer to products that are highly in-demand, sold quickly, and affordable. Such items are considered “fast-moving” as they are quick to leave the shelves of a store or supermarket because consumers use them on a regular basis. The goods are divided into two distinct categories. One is Consumer Durable Goods which have longer life and used for a long time. E.g. Washing machine, Ovens, Automobile Cars, Two wheelers etc. The fast-moving consumer goods are the goods which are quickly sold and comparatively low cost. These fast-moving consumer goods include toiletries, drugs, processed foods etc. “The Fast-Moving Consumer Goods industry covers the household items that you buy when shopping in the supermarket or a pharmacy. Fast moving‟ implies that the items are quick to leave the shelves and also tend to be high in volume but low in cost items. The products are ones that are essential items we use day in and day out”. Emergence of Fast-Moving Consumer Goods The fast-moving consumer goods (FMCG) industry has been shaped over the past five decades. This industry is the foundation of the Indian economy. It encompasses every aspect of human life. This FMCG market in India is fragmented. Almost 50 per cent of the market opts for non-branded homemade products. The remaining is being served by the branded products. Because fast-moving consumer goods have such a high turnover rate, the market is not only very large, it is also very competitive. Some of the world's largest companies compete for market share in this industry including Dole, Coca- Cola, Unilever, Procter & Gamble, Nestlé, Kellogg's, and General Mills. Companies like these need to focus their efforts on marketing fast-moving consumer goods to entice
  • 9. 2 and attract consumers to buy their products. That's why packaging is a very important factor in the production process. The logistics and distribution systems often require secondary and tertiary packaging to maximize efficiency. The unit pack or primary package is critical for product protection and shelf life, and also provides information and sales incentives to consumers. FCMGs are sold in large quantities, so they are considered a reliable source of revenue. This high volume of sales also offsets the low profit margins on individual sales as well. As investments, FMCG stocks generally promise low-growth but are safe bets with predictable margins, stable returns, and regular dividends. Characteristics of FMCG Products:  Individual items are of small value. But all FMCG products put together account for a significant part of the consumer's budget.  The consumer keeps limited inventory of these products and prefers to purchase them frequently, as and when required. Many of these products are perishable.  The consumer spends little time on the purchase decision. Rarely does he/she look for technical specifications (in contrast to industrial goods). Brand loyalties or recommendations of reliable retailer/dealer drive purchase decisions.  Trial of a new product i.e. brand switching is often induced by heavy advertisement, recommendation of the retailer or neighbors/friends.  These products cater to necessities, comforts as well as luxuries. They meet the demands of the entire cross section of population. Price and income elasticity of demand varies across products and consumers. 1.2 INTRODUCTION OF MARKETING In simple words marketing means exchange of goods and services for some consideration. In the primitive period in the absence of any currency goods were exchanged for goods or services which are referred to as Barter system. Marketing is a process through which goods and services move from concept to the customer. It includes the coordination of four elements called the 4 P's of marketing: (1) Product identification and development. (2) Price determination, (3) Distribution channel selection to reach the customer's Place, and
  • 10. 3 (4) Formulation and execution of a Promotional strategy. Customer needs and satisfaction are the basis of marketing. According to Theodore C. Levitt, retired Professor from Harvard University Marketing and selling are two different concepts. "Selling concerns itself with the tricks and techniques of getting people to exchange their cash for your product According to Rd. Philip Kotler,2 the Marketing Guru, “Marketing is the science and art of exploring, creating, and delivering value to satisfy the needs of a target market at a profit. Marketing identifies unfulfilled needs and desires. It defines measures and quantifies the size of the identified market and the profit potential. It pinpoints which segments the company is capable of serving best and it designs and promotes the appropriate products and services.” “Marketing’s key processes are: (1) opportunity identification, (2) new product development, (3) customer attraction, (4) customer retention and loyalty building, and (5) order fulfilment A company that handles all of these processes well will normally enjoy success. But when a company fails at any one of these processes, it will not survive.” American Marketing Association defines marketing as “the performance of business activities that direct the flow of goods and services from producer to consumer or use”. Marketing encompasses identifying and translating consumers‟ need and desires that the consumer expects from the product. Creation of demand for the products and services for the consumers is also a part of marketing effort. In order to achieve the set goal, the management has to formulate a strategy for the targeted market. It is in this context necessary to understand what is strategy. Strategy: According to Business Dictionary, Strategy is: “A method or plan chosen to bring about a desired future, such as achievement of a goal or solution to a problem.”
  • 11. 4 The Marketing Mix Before discussing about these Ps, one must note that all the Ps is interrelated. A decision to make change in one of them affects the rest. Suppose the company wants to launch low- priced product, the promotion has to follow suit and the same channels where premium products are sold cannot be used to provide access to this segment of customers. Second, each element of marketing mix contains countless variables. Third, the 4Ps of marketing have been the key areas where marketing managers allocate scarce corporate resources to achieve the business objectives. Fourth, to show the differences between services and physical products, Booms and Bitner suggested the extension of the 4Ps framework to include three additional factors: People, Physical evidence and Process. Services have unique characteristics: intangibility, heterogeneity, inseparability and perish ability, and thus, require a different marketing mix. Fifth, we are considered of the view that whether it is products marketing or services marketing, marketing mix must include all the 7Ps. Finally, the marketing mix will vary from industry to industry and organisation to organisation because of different offerings. A study by Rafiq and Ahmed (1995) found that there is a high degree of dissatisfaction with the 4Ps, however, 4Ps is thought to be most relevant for introductory marketing and consumer marketing. The result also suggests that the 7Ps framework has already achieved a high degree of acceptance as a generic marketing mix among our sample of respondents. Rafiq and Ahmed (1995) also highlighted the strengths and weaknesses of the 4Ps and 7Ps mixes. The discipline of marketing is split into four umbrella categories which we call the “4ps”: Price, Product, Place and Promotion (McCarthy, 1960). Service based organisations sometimes add three other “PS”: People, Process and Physical evidence to the four 4ps.
  • 12. 5 Table 1.1 Strengths and Weakness of 7 P’s & 4 P’s 7 P’S 4 P’S STRENGTHS  More comprehensive  More detailed  More refined  Broader perspective  Includes participants/ people  and process  It is a model  Standardisation  Signals marketing theory  Simplicity and ease of  Understanding  Easy to memorise  Good pedagogic tool, especially for  introductory marketing  Useful conceptual framework  Ability to adapt to various problems WEAKNESSES  More complicated  Extra elements can be  incorporated in 4Ps  Controllability of the three new elements  Too simple, not broad enough  Lacking people, participants and process  Physical evidence  Relationship marketing Service  Lack of connection/integration between variables  Static nature of 4Ps 1.3 7 P's OF MARKETING The marketing mix is the tactical or operational part of a marketing plan. The marketing mix is also called the 4Ps and the 7Ps. The 4Ps are price, place., product and promotion. The services marketing mix is also called the 7Ps and includes the addition of process, people and physical evidence. The marketing mix is the set of controllable tactical marketing tools — product, price, place and promotion — that the firm blends to produce the response it wants in the target market. - Kotler and Armstrong (2010).
  • 13. 6 PRODUCT Product means the goods-and-services combination the company offers to the target market. -Kotler and Armstrong (2010). For many a product is simply the tangible, physical item that we buy or sell. You can also think of the product as intangible i.e. a service. A product offering has three independent elements (Kotler et al call it as 5 product levels). The first level is the core product – consisting of core benefit (a fundamental benefit – a tyre for a car). The second level comprises of supplemental features (Kotler calls them as expected and augmented product levels). Products can be consumer products and business products. Consumer goods can be classified as fast moving (soap, shampoo, etc.) and durables (washing machine, TV, microwave, etc.); and Convenience products (relatively inexpensive, frequently bought, with limited efforts, and not much fussy about brand — salt, bread, etc.), Shopping products (bought after investing some time and effort – furniture, washing machine, fridge, TV, camera, shoes etc), Speciality products (bought after spending considerable time and effort — Mont Blanc pen, expensive men’s suit, jewellery, first new car, an apartment, etc.), and unsought goods (consumers are unaware of, or aware but do not want to buy now, and solving sudden problems – video telephone, Encyclopedias Britannica, and nearest mechanic when car gets punctured). Fig. 1.2 Product Life Cycle
  • 14. 7 Table 1.2 Product Life Cycle Stage 1: Introduction Introducing a new product where it’s unknown and products are small. The price is often higher as distribution is limited, and promotion is personalized. Stage 2: Growth Here, the product is being bought and with volume, the price declines. Distribution increases and promotion focuses on product benefits Stage 3: Maturity Here, the product competes with alternatives and pricing drops. Distribution becomes intense (it’s available everywhere) and promotion focuses on the differences to competitors’ products. Stage 4: Decline The product is reaching the end of its life and faces fewer competitors. The price may rise and distribution has become selective as some distributors have dropped the product. Promotion aims to remind customers of its existence.
  • 15. 8 With regard to new product development, a 7 steps process has to be followed – idea generation, screening, concept testing, business analysis, product development, test marketing, and commercialization. PRICE Price is the amount the consumer must exchange to receive the offering. -Solomon et al (2009). Pricing is one of the most important elements of the marketing mix, as it is the only mix, which generates a turnover for the organisation. The remaining 3p's are the variable cost for the organisation. Price must support these elements of the mix. Pricing is difficult and must reflect supply and demand relationship. Pricing a product too high or too low could mean a loss of sales for the organisation. Price is an important element in marketing mix, because it directly relates to revenue generation. Price is the one, which creates sales revenue – all other parts of marketing mix are costs. Pricing has to be done whenever a new product is launched, its variant is launched, a product is launched in new geographies, to counter inflationary trends, or company bids for industrial customers. Pricing Factors Pricing should take into account following factors: 1. Fixed and variable cost 2.Competition 3. Company objectives 4. Proposed positioning strategies 5. Target group and willingness to pay Table 1.3 Pricing Strategies PRICING STRATEGIES DEFINATION Penetration Pricing Here the organisation sets a low price to increase sales and market share. Once market share has been captured the firm may well then increase their price.
  • 16. 9 Skimming Pricing The organisation sets an initial high price and then slowly lowers the price to make the product available to a wider market. The objective is to skim profits of the market layer by layer. Competition Pricing Setting a price in comparison with competitors. In reality a firm has three options and these are to price lower, price the same or price higher than competitors. Product Line Pricing Pricing different products within the same product range at different price point Premium Pricing The price is set high to indicate that the product is "exclusive" Psychological Pricing The seller here will consider the psychology of price and the positioning of price within the market place. Optional Pricing The organisation sells optional extras along with the product to maximise its turnover. Cost Plus Pricing The price of the product is production costs plus a set amount ("mark up") based on how much profit (return) that the company wants to make. Although this method ensures the price covers production costs it does not take consumer demand or competitive pricing into account which could place the company at a competitive disadvantage. Cost Based Pricing This is similar to cost plus pricing in that it takes costs into account but it will consider other factors such as market conditions when setting prices. Value Based Pricing This pricing strategy considers the value of the product to consumers rather than the how much it cost to produce it. Value is based on the benefits it provides to the consumer e.g. convenience, well being, reputation.
  • 17. 10 PLACE Place includes company activities that make the product available to target consumers. -Kotler and Armstrong (2010). Place is concerned with making available the products at a place where (s) he demands. Thus, it is concerned with the store where the goods shall be displayed and sold, the channels of distribution and logistics management through which goods will flow from marketer to consumers. Chain or path or route in the channels may be marketer to consumer (through factory outlet or internet or company owned stores, or mail order business or door to door sales, or multilevel marketing as done by Amway), or marketer to retailer to consumer, or marketer to wholesaler (also referred to as distributors) to retailer to consumer, or agent to wholesaler to retailer to consumer. The organisations between the marketer and the consumers are known as intermediaries. Each one of them has an important role to play. Fig. 1.4 Channel of Distribution A Retailer is an important bridge with the consumers as he has much stronger personal relationship with the consumer, holds a variety of products, offers consumers credit, promote and merchandise products, prices the final product, and builds retailer ‘brand’ in the high street.
  • 18. 11 Type of Marketing Channel: 1. Intensive distribution: Used commonly to distribute low priced or impulse purchase products eg chocolates, soft drinks. 2. Selective distribution: Only a few outlets in an area are to distribute a product. It is most suitable for shopping products which include consumer durables. 3. Exclusive distribution: Only one outlet in a bigger geographical area is used to sell the product. Exclusive distribution is used for costly, fashionable items whose sale is limited. Major Types of Retail Stores: The Major Types of Retail Stores found in India are listed below:  Department Stores  Discount Stores  Supermarket  Mom and Pop Store (also called Kirana Store in India)  Convenience Stores  Television Shopping  Vending Machine PROMOTION Promotion includes all of the activities marketers undertake to inform consumers about their products and to encourage potential customers to buy these products. -Solomon et al (2009). Promotion is self explained and encompasses all promotional activity such as Advertising, PR and Sales. As you study further you will learn more about the subject of marketing communication and the strategies that evolve from that appellation. The tactics, or media chosen, will depend on resources but also what the objective of the strategy is. For example is the objective was to raise awareness the media chosen will
  • 19. 12 focus more on mass exposure. If the strategy is to solicit a sale then the communication channel will be more targeted. The three basic objectives of promotion are : I. To present product information to targeted consumers and business customers. II. To increase demand among the target market. III. To differentiate a product and create a brand identity. Fig. 1.5 Factors affecting Promotional Mix A marketer may use advertising, public relations, personal selling, direct marketing, and sales promotion to achieve these objectives. A promotional mix shall depend on nature of the product market, promotional budget, costs and availability of promotional methods, overall marketing strategy, buyer readiness stage and product life stage. A promotional plan can have a wide range of objectives, including: sales increases, new product acceptance, creation of brand equity, positioning, competitive retaliations, or creation of a corporate image. Promotion strategy may be ‘push'(use of a company’s sales force and trade promotion activities to create consumer demand for a product), ‘Pull’ (high spending on advertising and consumer promotion to build up consumer demand for a product).
  • 20. 13 PEOPLE People are all human actors who play a part in service delivery and thus influence the buyers' perceptions; namely, the firm's personnel, the customer, and other customers in the service environment. - Zeithand et al (2008). Right people, properly trained, is a must for obtaining competitive advantage. It is the interaction with people consumers perceive of quality of service. The people should have appropriate interpersonal skills, aptitude and service knowledge to deliver expected service. The students perceive of their college on the basis of teaching and non-teaching staff attitudes. PROCESS Process is the actual procedures, mechanisms, and flow of activities by which the service is delivered — this service delivery and operating systems. -Zeithami et al (2008). Process is the delivery and operating systems of procedures, mechanisms and flow of activities which services are consumed. To deliver products or services, systems or processes have to be in place, to avoid any discretion. Imagine you get in McDonalds and order a burger and get it within 2 minutes. Such an efficient service will earn customer loyalty and repeat visits. Every business must have processes, like, processes for handling customer complaints, processes for handling order etc. PHYSICAL EVIDENCE Physical evidence is the environment in which the service is delivered, and where the firm and customer interact, and any tangible components that facilitate performance or communication of the service. -Zeithaml et al (2008) Physical evidence refers to the environment in which the service is delivered, and the tangibles that help to communicate and perform the service. If you walk in a grocer’s shop and find rats, insects and flies, what will be your perception? The young generation prefers to go to malls instead of street shop is the physical ambience.- the cleanliness, air conditioning, parking facility, facility to touch, etc.
  • 21. 14 1.4 KEY FEATURES OF MARKETING MIX 1. Interdependent variables The marketing mix is made up of four unique variables. These four variables are interdependent and need to be planned in conjunction with one another to ensure that the action plans within all four are complimentary and aligned. 2. Help Achieve Marketing Targets Through the use of this set of variables, the company can achieve its marketing targets such as sales, profits, and customer retention and satisfaction. 3. Flexible Concept The marketing mix is a fluid and flexible concept and the focus on any one variable may be increased or decreased given unique marketing conditions and customer requirements. 4. Constant Monitoring It is vital to keep an eye on changing trends and requirements, within the company as well as in the market to ensure that the elements in marketing mix stays relevant and updated. 5. Role of Marketing Manager A mature, intelligent and innovative marketing manager needs to be at the helm of the marketing mix. This pivotal role means that this manager is responsible for achieving desired results through the skill manipulation of these variables. 6. Customer as a focal point A vital feature of the marketing mix is that the customer is the focal point of the activity. The value of the product is determined by customer perceptions and the goal is to achieve a satisfied and loyal customer.
  • 22. 15 1.5 DEVELOPING A MARKETING MIX To ensure a marketing mix that is based in research and combines facts with innovation, a manager should go through the following systematic process: Step 1 The first item on the marketing manager's agenda should be to define what the product has to offer or its unique selling proposition (USP). Through customer surveys or focus groups, there needs to be an identification of how important this USP is to the consumer and whether they are intrigued by the offering. It needs to be clearly understood. Step 2 The second step is to understand the consumer. The product can be focused by identifying who will purchase it. All other elements of the marketing mix follow from this understanding. Step 3 The next step is to understand the competition. The prices and related benefits such as discounts, warranties and special offers need to be assessed. An understanding of the subjective value of the product and a comparison with its actual manufacturing distribution cost will help set a realistic price point. Step 4 At this point the marketing manager needs to evaluate placement options to understand where the customer is most likely to make a purchase and what are the costs associated with using this channel. Multiple channels may help target a wider customer base and ensure east of access. Step 5 Based on the audience identified and the price points established, the marketing communication strategy can now be developed. Whatever promotional methods are finalized need to appeal to the intended customers and ensure that the key features and benefits of the product are clearly understood and highlighted. Step 6 A step back needs to be taken at this point to see how all the elements identified and planned for relate to each other. All marketing mix variables are interdependent and rely on each other for a strong strategyThe marketing plan can be finalized once it is
  • 23. 16 ensured that all four elements are in harmony and there are no conflicting messages, either implicit or explicit. 1.6 SWOT ANALYSIS SWOT analysis is a tool for auditing an organization and its environment. SWOT analysis is the first stage of planning and helps marketers to focus on key issues. SWOT stands for strengths, weaknesses, opportunities, and threats. Strengths and weaknesses are internal SWOT factors. Opportunities and threats are external SWOT factors. A strength is a positive internal factor. A weakness is a negative internal factor. An opportunity is a positive external factor. A threat is a negative external factor. We should aim to turn our weaknesses into strengths, and our threats into opportunities. Then finally, SWOT will give managers options to match internal strengths with external opportunities. SWOT is that simple. The outcome should be an increase in 'value' for customers — which hopefully will improve our competitive advantage. The main purpose of SWOT analysis has to be to add value to our products and services so that we can recruit new customers, retain loyal customers, and extend products and services to customer segments over the long-term. If undertaken successfully, we can then increase our Return On Investment (ROI). A SWOT STRENGTH COULD BE:  Your specialist marketing expertise.  A new, innovative product or service.  Location of your business.  Quality processes and procedures.  Any other aspect of your business that adds value to your product or service. A SWOT WEAKNESS COULD BE:  Lack of marketing expertise.  Undifferentiated products or services (i.e. in relation to your competitors).  Location of your business.  Poor quality goods or services.  Damaged reputation.
  • 24. 17 A SWOT OPPORTUNITY COULD BE:  A developing market such as the Internet.  Mergers, joint ventures or strategic alliances.  Moving into new market segments that offer improved profits.  A new international market. A SWOT THREAT COULD BE:  A new competitor in your home market.  Price wars with competitors.  A competitor has a new, innovative product or service.  Competitors have superior access to channels of distribution.  Taxation is introduced on your product or service. 1.7 BUYER BEHAVIOR The aim of marketing is to meet and satisfy target customers‘ needs and wants. The field of consumer behavior studies how individuals, groups, and organizations select, buy, use, and dispose of goods, services, ideas, or experiences to satisfy their needs and desires. Understanding consumer behavior is never simple, because customers may say one thing but do another. They may not be in touch with their deeper motivations, and they may respond to influences and change their minds at the last minute. Fig. 1.5 Marketing stimuli affecting buyer’s decision
  • 25. 18 Factors Influencing Buyer Behavior As this model indicates, a consumer‘s buying behavior is influenced by cultural, social, personal, and psychological factors. 1. Cultural Factors Influencing Buyer Behavior Culture, subculture, and social class are particularly important influences on consumer buying behavior 2. Social Factors Influencing Buyer Behavior In addition to cultural factors, a consumer‘s behavior is influenced by such social factors as reference groups, family, and social roles and statuses. 3. Personal Factors Influencing Buyer Behavior Cultural and social factors are just two of the four major factors that influence consumer buying behavior. The third factor is personal characteristics, including the buyer‘s age, stage in the life cycle, occupation, economic circumstances, lifestyle, personality, and self-concept. 4. Personal Factors Influencing Buyer Behavior Cultural and social factors are just two of the four major factors that influence consumer buying behavior. The third factor is personal characteristics, including the buyer‘s age, stage in the life cycle, occupation, economic circumstances, lifestyle, personality, and self-concept. 1.8 The Stages of the Buying Decision Process Consumer buying decision process is the processes undertaken by consumer in regard to a potential market transaction before, during and after the purchase of a product or service.
  • 26. 19 Fig. 1.6 Consumer decision making process generally involves five stages: Need Recognition Purchase decision making process begins when a buyer becomes aware of an unsatisfied need or problem. This is the vital stage in buying decision process, because without recognizing the need or want, an individual would not seek to buy goods or service. There are several situations that can cause problem recognition, these include:  Non availability of particular brand  Dissatisfaction with Quality  Price Changes  Change in Financial Situation Information Search After the consumer has recognized the need, he / she will try to find the means to solve that need. First he will recall how he used to solve such kind of a problem in the past, this is called nominal decision making. Secondly, a consumer will try to solve the problem by asking a friend or goes to the market to seek advice for which product will best serve his need, this is called limited decision making. Sources of information include:  Personal sources  Commercial Sources  Public sources  Personal experience Need Recognition Search Evaluation of Alternatives Purchase Decision Post Purchase Behavior
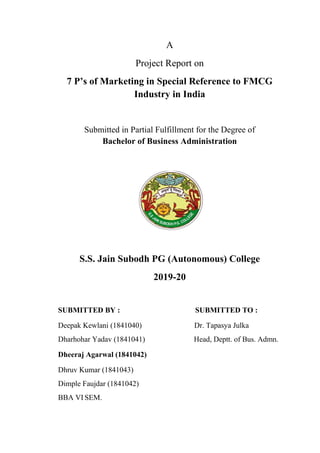
  • 27. 20 Evaluation of Alternatives Consumers evaluates criteria refer to various dimension; features, characteristics and benefits that a consumer desires to solve a certain problem. Product features and its benefit is what influence consumer to prefer that particular product. The consumer will decide which product to buy from a set of alternative products depending on each unique feature that the product offers and the benefit he / she can get out of that feature. Fig. 1.7 Evaluation of different brands of bath soap Purchase Decision This stage involves selection of brand and the retail outlet to purchase such a product. Retail outlet image and its location are important. Consumer usually prefers a nearby retail outlet for minor shopping and they can willingly go to a far away store when they purchase items which are of higher values and which involve higher sensitive purchase decision. After selecting where to buy and what to buy, the consumer completes the final step of transaction by either cash or credit. Post-purchase Behavior Consumer favourable post-purchase evaluation leads to satisfaction. Satisfaction with the purchase is basically a function of the initial performance level expectation and perceived performance relative to those expectations. Consumer tends to evaluate their wisdom on the purchase of that particular product. This can result to consumer experiencing post purchase dissatisfaction. If the consumer’s perceived performance level is below expectation and fail to meet satisfaction this will eventually cause dissatisfaction, and so the brand and/ or the outlet will not be considered by the consumer in the future purchases. Total Set Dyan Nirma Godrej No. 1 Santooe Lux Awarness Set Nirma Godrej No.1 Santoor Lux Consideration Set Godreg No. 1 Santoor Lux Choice Set Santoor Lux Decision Lux
  • 28. CHAPTER 2 PROFILE OF THE COMPANY
  • 29. 21 2.1 COMPANY’S BACKGROUND Hindustan Unilever Limited (HUL) is India's largest Fast Moving Consumer Goods Company, touching the lives of two out of three Indians with over 20 distinct categories in Home & Personal Care Products and Foods & Beverages. They endow the company with a scale of combined volumes of about 4 million tonnes and sales of Rs.10,000 crores, Hindustan Unilever Limited (abbreviated to HUL), formerly Hindustan Lever Limited, is INDIAs largest consumer products company and was formed in 1933 as Lever Brothers India Limited. It is currently headquartered in Mumbai, India and its 41,000 employees are headed by Harish Manwani, the non- executive chairman of the board. HUL is the market leader in Indian products such as tea, soaps, detergents, as its products have become daily household name in India. The Anglo-Dutch company Unilever owns a majority stake in Hindustan Unilever Limited. The company was renamed in late June 2007 as "Hindustan Unilever Limited". The mission that inspires HUL's over 15,000 employees, including over 1,300 managers, is to "add vitality to life." HUL meets everyday needs for nutrition, hygiene, and personal care with brands that help people feel good, look good and get more out o HUL's brands - like Lifebuoy, Lux, Surf Excel, Rin, Wheel, Fair & Lovely, Pond's, Sunsilk, Clinic, Pepsodent, Close-up, Lakme, Brooke Bond, Kissan, Knorr-Annapurna, Kwality Wall's – are household names across the country and span many categories - soaps, detergents, personal products, tea, coffee, branded staples, ice cream and culinary products. They are manufactured over 40 factories across India. The operations involve over 2,000 suppliers and associates. HUL's distribution network comprising about 4,000 redistribution stockists, covering 6.3 million retail outlets reaching the entire urban population, and about 250 million rural consumers.
  • 30. 22 MISSION Unilever's mission is to add Vitality to life. We meet everyday needs for nutrition, hygiene and personal care with brands that help people feel good, look good and get more out of life. Our deep roots in local cultures and markets around the world give us our strong relationship with consumers and are the foundation for our future growth. We will bring our wealth of knowledge and international expertise to the service of local consumers. Our long-term success requires a total commitment to exceptional standards of performance and productivity, to working together effectively, and to a willingness to embrace new ideas and learn continuously. To succeed also requires, we believe, the highest standards of corporate behavior towards everyone we work with, the communities we touch, and the environment on which we have an impact. This is our road to sustainable, profitable growth, creating long-term value for our shareholders, our people, and our business partners. HUL’s key focus in the exports business is on two broad categories. It is a sourcing base for Unilever brands in Home & Personal Care (HPC) and Food and Beverages (F&B) for supplies to other Unilever companies. It also focuses on becoming a preferred supplier to both non-Unilever and Unilever clients in three categories in which India, as a country, has competitive advantage – Branded Rice, Marine Products and Castor and its Derivatives. HUL enjoys international recognition within Unilever and outside for its quality, reliability and speed of customer service. HUL's Exports geography comprises, at present, countries in Europe, Asia, Middle East, Africa, Australia, and North America etc.  HUL’s products touches two out of three Indian everyday  Reach 80% Households  Direct Coverage of 1mln outlets  2000 Suppliers and Associates  71 Manufacturing locations  15000 Employees  1100 managers  Shelf availability 84% outlets in India
  • 31. 23 2.2 STUDY OF HUL’S BATH SOAP BRANDS IN RESPECT TO 7 P’S OF MARKETING MIX 1. PRODUCT LINE Fig. 2.1 Product Line of HUL A) HOME AND PERSONAL CARE: 1) Personal wash 2) Laundry 3) Skin Care Lux Surf Excel Fair and lovely Breeze Rin Pond’s Lifebuoy Wheel Aviance Dove Liril Pears Hamam Rexona 4) Hair care 5) Oral care 6) Deodorants Sunsilk naturals Pepsodent Axe Clinic Close up Rexona 7)Colour Cosmetics 8)Ayurvedic Personal and health care Lakme Ayush
  • 32. 24 B) FOODS 1) Tea 2) Coffee 3) Foods 4) Ice cream Brooke Bond Brooke Bond Bru Kissan Kwality walls Lipton Knor Annapurna C) WATER PURIFIER : Pureit PRICE If price is too high then a company may never sell a single item of it. If price is too low then one can lose money on every sale once all of costs of doing business are considered. Therefore the key is to price it in such way that it appears attractive to the customer as well as profitable to the company. HUL seems to have mastered this idea. Prices of HUL are considered the most competitive in Indian market. The main fact for this huge success story is the strategic pricing decision the company has adopted from time to time. HUL always gives value for money to their consumers. It is known for its competitive pricing. It has the advantage of quoting a reasonable price due to its economies of scale. HUL also can quote a very competitive price due to its superior technology and optimum utilization of inventory. It has the product range that meets the needs of all classes of consumers. It has the products that are categorized as premium and mass products. HUL matches its prices with the competitor who is operating in the same category. HUL also gives price offs on its products to reward consumers who are using it for a long time and also to attract new consumers. The price of the premium segment products is twice that of economy segment products. The economy and popular segments are 4/5ths of the entire soaps market. Price segments of bath soaps Segment Price Weight Premium Above Rs. 20 75 gm Popular Rs 13 to Rs. 20 75 gm Economy Rs. 8 to Rs. 12 75 gm
  • 33. 25 However, recently HUL has been forced to hike its price by one rupee, to Rs17 (for 100 gm), giving in to the pressures of inflation. This paves the way for competing soap makers like Godrej Consumer Products (GCPL) to take price increases. Table 2.2 Price of HUL soaps Premium (> 20 Rs.) Popular (> 13 Rs. & < 20 Rs.) Economy (< Rs. 12) Brand Price (Rs.) for 75 gm Brand Price (Rs.) for 75 gm Brand Price (Rs.) for 75 gm Dove 33Rs. Lux 18 Rs. Breeze 10Rs Pears 26Rs. Liril 19Rs. Lifebuoy 10Rs Moti 23Rs. Rexona 17Rs. Hamam 18Rs. The bath soaps are available in different sizes - 75 gms. 100 gms, 125 gms. and 150 gms. The popular sizes are 75 gms. and 100 gms. PLACE HUL‘s distribution network is recognized as one of its key strengths -- that which helps reach out its products across the every retail outlets. The need for a strong distribution network is imperative, since HUL‘s corporate purpose is ―to meet the everyday needs of people everywhere.‖ At Hindustan Unilever Limited, distribution network is one of the key strengths that help them reach their products across the length and breadth of this vast country. It has 2000+ suppliers and associates 7,000 stockiest and direct coverage in over 1 million retail outlets across India. To meet the ever-changing needs of the consumer, HUL has set up a distribution network that ensures availability of all their products, in all outlets, at all times. This includes, maintaining favorable trade relations and providing innovative incentives to retailers. HUL boasts of placing a product across the country in less than 72 hrs.
  • 34. 26 The first phase of the HUL distribution network had wholesalers placing bulk orders directly with the company. Today, the goods are transferred from the factory to the company warehouses and are sent to the distributor from there on a daily basis. From the distributor, the stock reaches the market through daily sales. Typically, these include the salesman registering the order of a retail outlet and delivering the goods the next day. In addition to the ongoing commitment to the traditional grocery trade, HUL is building a special relationship with the small but fast emerging modern trade. HUL'sscale enables it to provide superior customer service including daily servicing, improving their range availability whilst reducing inventories. HUL is using the opportunity of interfacing more directly with consumers in this retail environment through specially designed communication and promotions. This is building traffic into the stores while yielding high growth for the business. PROMOTION The great Indian brand wagon started nearly four decades ago. Great brands sometimes outlast their ambassadors as proven by Lux which celebrated its 75th anniversary in India. The first ambassador, Leela Chitnis featured in a Lux advertisement which flagged off the Lux wagon. She gave way to a galaxy of stars which includes Madhubala, Nargis, Meena Kumari, Mala Sinha, Sharmila Tagore, Waheeda Rehman, Saira Banu, Hema Malini, Zeenat Amaan, Juhi Chawla, Madhuri Dixit, Sridevi, Aishwarya Rai, Kareena Kapoor and Priyanka Chopra. The last frontier for most actors aspiring to stardom is becoming a Lux ambassador. The brand has outlasted much soap. From the beginning, Lux became a household name across the country. All top actresses at their time were the brand ambassador of the Lux soap. They launched the Shahrukh Khan as a first male brand ambassador for the LUX and Abhishekh Bacchan was the second male brand ambassador for the Lux. They also promote the brand through sponsoring the shows such as ―LUX PERFECT BRIDE.‖, sales promotion schemes like ―LUX GOLD COIN OFFER‖, ―Buy 3 Get 1 Free‖. As a promotional activity window display is also run by the company.
  • 35. 27 Table 2.3 A List of Some offers During the Period (2017 - 2020) Brand Size Offers Pears 75gm 5 Rs. OFF Pears 75gm Buy 1, get 2 sachets Sunsilk shampoo free worth Rs.5 Lux 75gm Gold Coin Offer Lux 75gm Save 9 Rs. Breeze 75gm, Buy 2 Get 1 Free Breeze 125 gm Buy 2 Get 1 Free Dove 100gm Buy 3 Save Rs 10. Lux Honey 75gm Rs. 2 Off PEOPLE People refer to the staff and salespeople who work for your business, including yourself. When you provide excellent customer service, you create a positive experience for your customers, and in doing so market your brand to them. In turn, existing customers may spread the word about your excellent service and you can win referrals. Give your business a competitive advantage by recruiting the right people, training your staff to develop their skills, and retaining good staff. Right people, properly trained, is a must for obtaining competitive advantage. It is the interaction with people consumers perceive of quality of service. The people should have appropriate interpersonal skills, aptitude and service knowledge to deliver expected service. The students perceive of their college on the basis of teaching and non-teaching staff attitudes. HUL has over 18000 employees, including over 1500 managers Board of directors Mr. Harish Manwani – Chairman Mr. Sanjiv Mehta - CEO and Managing Director Mr. R. Sridhar - Chief Financial Officer
  • 36. 28 Process Process refers to the HUL processes involved in delivering your products and services to the customer. It is also about being 'easy to do business with'. Having good process in place ensures that you:  repeatedly deliver the same standard of service to your customers  save time and money by increasing efficiency. Physical evidence Physical evidence refers to everything your customers see when interacting with your business. The HUL physical evidence includes includes:  the physical environment where you provide the product or service  the layout or interior design  your packaging  your branding. Physical evidence can also refer to your staff and how they dress and act. 2.3 SWOT ANALYSIS OF HINUSTAN UNILEVER LIMITED Strengths in the SWOT analysis of Hindustan Unilever ( HUL ) 1. Strong legacy of the HUL brand since its inception in 1934. 2. Market leader in consumer goods. 3. Innovative FMCG Company. 4. Extensive & integrated distribution system. 5. Financial position. 6. HUL is a part of the Unilever group, hence strong brand equity, visibility. 7. As a part of CSR, HUL has initiatives like project Shakti, plastic recycling, women empowerment etc. 8. Products with presence in over 20 consumer categories with over 700 million Indian consumers using its products. 9. It has over 18000 employees and has a reach of 6.4 million retail outlets which includes direct reach to over 1.5 million retail outlets.
  • 37. 29 Weaknesses in the SWOT analysis of Hindustan Unilever ( HUL ) 1. Large number of brands in different product categories 2. Market share is limited due to presence of other strong FMCG brands 3. HUL can tap rural markets and increase penetration in urban areas 4. Mergers and acquisitions to strengthen the brand 5. Increasing purchasing power of people thereby increasing demand Opportunities in the SWOT analysis of Hindustan Unilever ( HUL ) 1. HUL can tap rural markets and increase penetration in urban areas 2. Increasing Income levels 3. Mergers and acquisitions to strengthen the brand 4. Increasing purchasing power of people thereby increasing demand Threats in the SWOT Analysis of HUL (Hindustan Unilever Limited) 1. Intense and increasing competition amongst other FMCG companies can affect business of HUL FDI in retail thereby allowing international brands 2. Competition from unbranded and local products can hurt Hindustan Unilever's market 3. Buyers power 2.4 COMPETITORS ANALYSIS According to the market survey done by BUSINESS TODAY the top 10 companies of FMCG sector are given below. 1. Hindustan Unilever Ltd. 2. ITC (Indian Tobacco Company) 3. Nestlé India 4. GCMMF (AMUL) 5. Dabur India 6. Asian Paints (India)
  • 38. 30 7. Cadbury India 8. Britannia Industries 9. Procter & Gamble Hygiene and Health Care 10. Marico Industries 2.5 Market Share of HUL’s Bath Soap Products in Jaipur City: Given below is the market share of bath soap product of hul as per the latest article published in economic times. Table 2.4 Different Bath soap companies market share Company Market Share Hindustan Unilever Ltd. 45% Godrej Consumer product Ltd. 11% Wipro Consumer Ltd 13% Nirma 3% Rackitt Benckiser (India) ltd. 6% ITC 3% Anchor Health & Beauty Care 3% Hankel India Ltd 1% Jonson and Jonson‘s 2% V V F 5% Dorcas Market Makers 7% Mhaysor Sandal Soap 1%
  • 39. 31 2.6 FUTURE PROJECTS OF HUL: As competition is increasing day by day,it’s difficult to maintain the leader position & to further strengthen the distribution network HUL made a project called project SHAKTI which will serve the following purpose: A. To Reach:  Small, scattered settlements and poor infrastructure make distribution difficult.  Over 500,000 villages not reached directly by HUL. B. To Communicate:  Low literacy hampers effectiveness of print media.  Poor media-reach: 500 million Indians lack TV& radio. C. To Influence:  Low category penetration, consumption. D. Awareness:  Per capita consumption in Unilever categories is 33% of urban level. Hindustan Unilever Ltd. 45% Godrej Consumer product Ltd. 11% Wipro Consumer Ltd 13% Nirma 3% Rackitt Benckiser 6% ITC 3% Anchor Health & Beauty Care 3% Hankel India Ltd 1% Jonson and Jonson‘s 2%V V F 5% Dorcas Market Makers 7% Mhaysor Sandal Soap 1% Fig. 2.4 Different Bath Soap Companies Market Share
  • 41. 32 3.1 REVIEW OF LITERATURE At the time of formulation of the research proposal the researcher had gone through literature from books, research papers in order to get himself equipped with the basic knowledge of the research topic proposed. Now once the research proposal was approved, in order to have thorough knowledge about the topic of research, the researcher considered appropriate to go through the relevant literature. For this purpose the researcher referred to the earlier Ph. D. theses available on the websites, research papers, books, journals and periodicals, news paper articles etc. and got himself thoroughly acquainted with the research topic. These reviews are presented in this chapter chronologically. Thus, the researcher has reviewed categories following literature: Shukla Priteshkumar Y. (2016)1 concluded that, there are different factors like Price of the product, variety in size of the product, main sources of the product knowledge, advertisement, which plays an important role in rural buying decision. Moreover, that it can be said that majority of the respondents are happy with the selected products of HUL. According to the author it can be said that advertisement plays an important role against spurious products available in the market. And they preferred more extra quantity in the same price as favourable promotional scheme. Priyadarsini J., (2015)2 in her research paper she has stressed the role of the women in marketing. She has cited the Hindustan Unilever‟s Shakti model and has also given quotation of the Sr. Executive of the HUL which focuses on the strength of the women. She has stated HUL‟s model has achieved a grand success in the East Godavari District. According to her women are change setters in the urban marketing set up. 1 Shukla Priteshkumar Y. (Febrary 2016), “A study on Rural Marketing Strategy – with Special Emphasis on Selected Customer Preferences for Hindustan Unilever Limited‟s (HUL) selected products in Valsad District.” PARIPEX-Indian Journal of Research, Vol. 2, Issue 2, pp 49-52 2 Priyadarsini J. (2015). Patting at the Bottom of the Pyramid Beyond Business Goals: An Empirical Analysis on Project Shakti, HUL. CRR, (pp. 1-37). 254
  • 42. 33 Wath M. and Agarwal P. (2013)3 according to the author the urban markets are having stiff competition for many products. In regard to some products the market is saturated. Urban markets are offering growth potential. The marketers should understand the consumer before going ahead. The markets are fast expanding. The authors observed that the urban market offers numerous challenges. Joshi (2016)4 research paper titled, “Upcoming Trends in Retailing: Green Retailing/ Eco Friendly Retailing”. In this paper the author has observed that with the growing realization about the ill-effects of global warming, customers across the globe are using the companies to come up with eco-friendly alternatives to manufacturing process. The retailers have also discovered that these “Green initiatives” are in turn leading them to identify cost-effective ways of doing their business. She has stated that there are many specialist stores that sell green products. Whole food and natural living stores often sell an extensive range of eco-friendly products. Eco-friendly clothing can be as stylish and fashionable as conventionally produced clothes. Environmentally friendly detergents and other household products are featured alongside conventional products. Brands such as E-cover are widely known. Khan, Ahmad, (2015)5, paper titled, “Consumer Decision-Making Styles: A Comparative study of Male and Female Customers in India”. The authors have observed that the social and economic status of woman has now improved. Women go for higher education and are found working together with the men in most of the organizations. The life style of the Indian woman has changed which has an influence on the consumption pattern and decision making styles. Males have shown a higher degree of association with perfectionist/High Quality conscious consumer, promotion 3 Wath M., Agarwal P. (2013). Exploring Indian Rural Market - The Way Ahead. International Conference on Technology and Business Management, (pp. 750-755). 4 Aarti Joshi (2016), research paper titled, “Upcoming Trends in Retailing: Green Retailing/ Eco Friendly Retailing”. Published in Handbook of Management and Behavioural Science” book edited by Ranbir Singh Gulia, Ombir Singh, Suvijna Awasthi, by Wisdom Publications, Delhi. Pp. 29-33 5 Dr. Mohd. Afaq Khan, S. Aijaz Ahmad, (2015), paper titled, “Consumer Decision-Making Styles: A Comparative study of Male and Female Customers in India”. Published in Handbook of Management and Behavioural Science” book edited by Ranbir Singh Gulia, Ombir Singh, Suvijna Awasthi, by Wisdom Publications, Delhi. Pp. 75-83.
  • 43. 34 conscious consumer, brand conscious consumer, impulsive careless consumer, habitual brand loyal consumer and Store Loyal consumer styles where as a higher degree of association has been shown by the females towards novelty, fashion conscious consumer, health conscious consumer, price conscious consumer, recreational choice seeking and confused by over choice consumer traits. Kashyap, (2013),6 book titled, “Rural Marketing”. This is a very nicely written book on rural marketing which exclusively deals with all the aspects of the rural marketing in greater details. The book has discussed several cases which is quite useful to understand the conclusions drawn by the authors. The author has highlighted that the marketer should understand the rural market in its right perspective. The issues such as population size, age groups, gender dynamics, family structure, education level, occupation, landholdings pattern and income structure of the rural masses. The author has nicely described the process of rural consumer behavior, segmenting and targeting rural markets, product strategy, Pricing strategies, distribution in rural Markets etc. Kotler, Kellr, Koshy, Jha 2012,7 book titled, “Marketing Management - A South Asian Perspective”. In this book while discussing the marketing insight, the authors have stressed the need for developing service offers for rural areas. Panda, (2007)8, in his book titled “Market Management” has observed that up till now the rural market has not been explored mainly because of the low purchasing power as well as availability of efficient communication. Besides there is another hurdle of regular income as the rural income is based on the harvesting of the agricultural produce and its realization. However, of late the Indian rural market is emerging a viable market because of the improvement in the infrastructure as well as gradual increase in the purchasing power of the rural families. Hindustan Unilever has put in operation Bharat, through which it 6 Pradeeklp Kashyap, (2013) “Rural Marketing”, published by Dorling Kindersley (India) Pvt. Ltd. 7 Philip Kotler, Kevin Lane Kellr, Abraham Koshy, Mithileshwar Jha 2012, book titled, “Marketing Management - A South Asian Perspective”. Published by Pearson – Delhi. 8 Tapan K. Panda, (2007), II edition, Book titled “Market Management” published by Excel Books, Chapter 7, pp. -151-177
  • 44. 35 is trying to improve the penetration of its products in the rural areas. The multinational FMCGs are encouraging the rural masses for increasing their consumption. Schiffman and Kanuk: (2007)9 book titled: “Consumer behavior” This book has been divided into 4 parts. Part 1 provides the background and the tools for a strong and comprehensive understanding of customer behaviour. Chapter I introduces the reader to the study of consumer behaviour, its diversity, its development and the role of consumer research, it concludes with a detailed discussion of ethical considerations in marketing and consumer practices and introduces a simple model of consumer decision making. Chapter 2 provides a detailed overview of the critical research process and the techniques associated with consumer behaviour research, including a discussion of positivist and interpretivist research methods. Chapter 3 presents a comprehensive examination of market segmentation and demonstrates how consumer behaviour variables provide both the conceptual framework and the strategic direction for the practical segmentation of markets. Bhawna Mehra & Kogent Learning Solutions Inc. 10(2007), book titled, “Marketing Management”. In this book in module 8.7 the author dwelt upon the rural marketing management. The author has highlighted that the increased purchasing power of the rural customer has attracted the attention of the urban marketers. Issues concerning client and location specific promotion, joint promotion, etc. has also been discussed by the author. The author has also discussed four A’s of marketing (which has already been covered in one of the reviews). He has also discussed the scope of HUL market and the need for a separate strategy for the rural marketing. V. S. Ramaswamy, S. Namakumari 200711, book titled, “marketing Management, Planning, Implementation & Control”. In this book the authors have observed that the 9 Leon G. Schiffman and Leslie Lalzar Kanuk: (2007) Titled: “Consumer behavior” published by Excel Books, Chapter 7, pp. -151-177 10 Prof. Dr. P. K. Chopra, Bhawna Mehra & Kogent Learning Solutions Inc. (2007), book titled, “Marketing Management”, published by dreamtech Press, pp 220-233. 11 V. S. Ramaswamy, S. Namakumari 2007, book titled, “marketing Management, Planning, Implementation & Control” publisher Macmillan India Ltd. Delhi
  • 45. 36 urban marketing is developmental marketing and F.M.C.G. companies should develop their strategies to make best use of the potential offered by it. They have also observed that this urban market is different than the urban market. The packaging of the product should be small, and without sacrificing the quality of the product the price should be low taking into account its affordability in the urban area. Kaur (2013),12 article, “Rural Marketing: A Case Study on Hindustan Unilever Limited,” the author has discussed the importance gained by the rural markets in the overall growth of economy. While discussing the special features of the current rural marketing scenario the author has discussed the competition in urban markets, changing consumption pattern in rural areas, improved lifestyle , huge population base, the rate at which the rural market is growing. In fact HUL was one of the early companies to enter into the rural marketing in India. While discussing rural marketing the author has also discussed the 4 Ps of rural marketing i.e. Product strategy, pricing strategy, Place strategy, and the promotion strategy. HUL has a sustained approach to explore the rural potential. The company has now adopted a direct door step marketing through its Shaktiamma . The author has pointed that there are number of changes on the marketing horizon of HUL which include: 1. Technology of digital maps – to study existing rural distribution reach and to draw up plans for increasing its reach. Maps help for smarter route planning. 2. Improved road infrastructure across the country leading to improved access to even remotest of villages. 3. Reach of television to rural area has rural consumers watching all programmes and ads as in the city. Aspiration to use same products as city folks is on the irse and buying habits of rural consumers are changing fast. Sharma, (2013)13 in her paper titled, “An Analytical Study on the Opportunities of Rural Marketing in India” has concluded that in the Indian rural marketing scenario 12 Manpreet Kaur (June 2013), article, “Rural Marketing: A Case Study on Hindustan Unilever Limited,” International Journal of Applied Research and Studies, Volume 2. 13 Dr. Ankurati Sharma, (2013), “An Analytical Study on the Opportunities of Rural Marketing in India”, IJM, Vol. 4, pp.183-189.
  • 46. 37 usually the marketing decision of purchasing is taken in the age group of 31-40 years. The author further observed that while marketing strategies for rural marketing, the marketers must be aware about the media selection, proper use of the language which should be understandable by the rural people. Regional language plays an important role. Usually the rural consumers rely on the other people who have used the said product. Branding, media, usage of language are the important aspects which should be borne in mind while tapping the rural marketing. Kalotra, (2013),14 research paper titled, “Rural Marketing Potential in India – An Analytical Study”, the author has drawn the following conclusions: ❖ Age wise analysis explains the pattern of purchasing in the rural markets wherein the age group between 21-50 years is dominating with majority of males. ❖ Advertisements through electronic media are preferred over other method of communication. ❖ Marketers can benefit most if they can make the rural people feel that they value them as their customers. ❖ Regional languages are playing vital role in the rural marketing. ❖ Rural customers are increasingly becoming brand conscious as well as price and discounts. ❖ The decision making in the rural market are taken by self followed by spouse. ❖ The rural consumers usually do not experiment with a new product unless something trigger them. ❖ There is a high potential in the rural India but exists major differences between the existing and the desirable levels of rural marketing. Dr. Singh J., and Saikh (2012)15 , The authors stress the role of the family in influencing the buying behavior particularly in the consumer durable segment. The 14 Anil Kalotra, (Jan 2013), research paper titled, “Rural Marketing Potential in India – An Analytical Study”, published in International Journal of Advanced Research in Computer Science and Software Engineering, Volume 3,Issue1, pp 1-10 15 Dr. Singh S., Seikh J. (2012). Making a Dent into the Rural Market, Integral Review- A Journal of Management, Volume 5, No.1, June, 36-41.
  • 47. 38 marketers should direct their advertising efforts and messages may be given in such a way that it appeals the family members. The authors observed that the marketers should build their credibility in the rural market as the mass media advertising is resulting in losing their faith. The authors have suggested the use of social interactive media which will give better results. Kesari, Srivastava (2012)16, paper titled, “Retailing in Rural India: An Overview of Markets and Opportunities” the authors have concluded that the rural market is a vital market now which should be focused by the Multi National Corporations. The needs of the rural people are different than the urban or metro consumers. They have a different set of mind about the packaging as well as product. Packaging should be small and sturdy to withstand the rough roads in the rural area. The rural marketing has displayed a phenomenal growth during the past decade. Financial Express, 8th February, 2020, BARC, article titled, “Lux Toilet Soap retain the top most spot as the most advertised brand” Lux has the highest market share in advertisement in soap industry. Comparison made between 10 competitors of advertisement with each percent share. The Hindu, Business Line 9th Sept. 2018. As the summer season fades away, the hinterland gears up for a variety of festivities. These bring with them a number of traditional fairs (melas). Over the years these fairs that have proven to be great opportunities for marketers. And though the current reuptake is not anything to sing about, it is here that two-wheeler companies, the FMCG sector, food and beverage firms or the garment makers can find potential customers who are on an outing with family and friends and ready to listen. 16 Dr. Joseph Kesari, Abhishek Kumar Srivastava (2012), paper titled, “Retailing in Rural India: An Overview of Markets and Opportunities” South Asian Academic Research Journals available on http://www.saarj.com
  • 48. 39 Indian Brand Equity Foundation: July 2017, Rural Segment Quickly Catching Up. The Fast Moving Consumer Goods (FMCG) sector in rural and semi-urban India is estimated to cross US$ 20 billion by 2018 and US$ 100 billion by 2025 The rural FMCG market expanded at a CAGR of 13.2 per cent to US$ 100 billion during 2009-15x. In rural markets, durables like refrigerators as well as consumer electronic goods are likely to witness growing demand in the coming years as the government plans to invest significantly in rural electrification. First Post, Dec 20, 2018 , Sonali Advani’s article titled, “Urban marketing: Say no to price wars, relationships key”. Rural India has been in the spotlight for a while now, with growing consumption rates. Middle India, home to about 100 million people, is already contributing to 20 percent of the country's FMCG consumption, as per recent media and industry reports. The bond between retailers and consumers in tier III and IV towns tends to be quite strong and often extends into the personal sphere. So if you are setting up your own stores, you'll have to work around processes that adapt to such nuances. Big and fancy stores used to intimidate consumers (as they tend to give the perception of being more expensive), but this is slowly changing. From the above analysis of Literature Review the research which is not included above is the 7 p’s of marketing which are followed in FMCG industry. The analysis of buyers behaviour towards the different bath soap available in the market. Customer reaction towards the new products and what are their needs and preferences. Also, a brief data analysis of cultural, social, personal and psychological factors are affecting the buyers behaviour.
  • 50. 40 RESEARCH METHODOLOGY A research methodology is the arrangement of condition for collection and analysis of data in a manner that to, combine relevance to research purpose with economy in procedure. 4.1 TITLE: A COMPREHENSIVE STUDY OF THE BATH SOAP MARKET AND ANALYSIS OF BUYERS BEHAVIOUR WITH SPECIAL REFERENCE TO HUL. 4.2 OBJECTIVES OF STUDY: 1. To know about customer perception while purchasing bath soap product. 2. To study the soap brand people use on basis of age, occupation and income class. 3. To study the customer association with the existing brand and reasons for switching over to another brand. 4. To study the buyer’s awareness bout HUL bath soaps and their prices and the place to purchase from. 5. To study the buyer’s awareness about the advertisement, offers and promotional techniques of HUL. 6. To know about various brand and competitors of HUL soaps. 7. To know about the performance of popular brans of different companies in the market. 8. To study what attributes motivate customers to buy a product. 9. To analyse the ranking of soap that customer give according to their preferences. 4.3 Research Design: “Research design is the logical and systematic planning and directing a piece of research.” - P.V. Young
  • 51. 41 Research Design is conceptual structure within which research is conducted. It constitutes the blue print of collection, measurement and analysis of data. Research design is needed because it facilitates the smooth sailing of various research operations, thereby making research as efficient as possible yielding maximum information with minimum time, effort and money. Research Design stands for advance planning of methods to be used for collecting relevant data and techniques to be used in the analysis. The design helps researcher to organize his ideas whereby it will be possible for him to look for flaws and inadequacies. Research design is purely and simply the framework plans for study that guides the collection and analysis of data. There are three major types of research design, i.e., exploratory research design, descriptive research design and experimental research design. This study is basically exploratory analysis type. Exploratory research The idea gets deeper insight into competition in the bath soap market and to get buying behavior of consumers. In order to address above-mentioned objectives (I) study of secondary sources was carried out from internet, books, and Magazines (II) structured questionnaire was designed to seek consumer responses. Descriptive research The data is analyzed, which was collected. It is also known as quantitative research; it is designed to help executives of action that is to make decision. This kind of design is used for more precise investigation or of developing the working hypothesis from an operational point of view. It has inbuilt flexibility, which is needed because the research problem, broadly defined initially, is transformed into one with more precise meaning in exploratory studies, which in fact may necessitate changes in research procedure for gathering relevant data. Target population The target population for ―A Comprehensive Study of Bath Soap Market and Analysis of Buyer Behavior to Purchase the Bath Soap Product – With Special Reference to
  • 52. 42 Hindustan Unilever Ltd. is - Consumers, from different economical & demographical background, which are purchasing & using bath soaps. 4.4 Collection of data The data has collected from primary & secondary sources. Secondary Data The main aim of the project is to analyze the competition in occupying market shares of various bath soap brands as compare to the brand of the HUL and the consumer’s buying behavior of bath soap products. Therefore, it is necessary to get considerable information about the competing brands. For this researcher have gone through a lot of secondary data. A lot of issues of Business Today, Economic Times were consulted. Books, magazines, internet, newspapers, journals, company information both internal and external by company magazines, data and bulletins related to the project topic. Primary data A survey was conducted through structured questionnaire. The study was done among consumers who are using bath soap and conducted personal interview for collecting the required information. It is original data, first hand and for the specific purpose of the research project. For this project, researcher have used the following common research instruments. Questionnaire: Questionnaire development is the critical part of primary data collection job. For this I have prepared a questionnaire in such a way that it is able to collect all relevant information regarding the project. In this questionnaire, I have used mostly close-ended questions that are easier to be answered by respondents (consumers) and also easier for interpretation and tabulation and some open-ended question to take the opinion of the respondents in their own words. The questions were asked to the consumers covering perception towards their purchase, price of the product, purpose for using the product, characteristic of the product, brand image, effectiveness of the advertisements, sales
  • 53. 43 promotional activities, overall opinion about the product, etc. For collecting the answers from the above questionnaire, I have used the following common methods. Interview: It is the most common method for contacting consumers and collecting primary data. For this project researcher have used following type of interview:- Personal interview: It is the most extensively used method. It enables better control of the sample and ensures answers from the respondents. It also provides for a tactful approach to the respondent since it is based on a person-to-person talk. Researcher have used this technique to get the information of other competitor’s brands of bath soap from retailers such as their availability in the shop and their market share in Jaipur city. For this project each interview was taking 15 to 20 minutes to complete. Interview was also delayed due to un-availability of respondent in shops. Telephonic Interview Telephonic interview is conducted for collecting the company’s information from the company‘s Sales Executive who is handling the sales of Jaipur city or who has known about the bath soap brands of HUL of the Jaipur city. Company person was always on tour so it was not possible to conduct the personal interview with them. So, all the information related to the company and bath soap brands is collected by the telephonic interview. 4.5 Sampling Sample unit Consumers using the bath soap. Sample plan The selection of the samples is done following the two sampling techniques, which are:
  • 54. 44 - Simple random sampling - Convenience sampling Sample Location: Consumers of bath soap in Jaipur city. Sample size Customers-200 (Both male & female) Retailers – 60 (All type of retail stores) Scope of Study: The geographical scope of the study was restricted to the Jaipur city due to time and resource constraints. The study being exploratory in nature, the sample size was restricted to 200 consumers and 60 retailers. In this study only bath soaps segment and the customers of bath soaps are considered. 4.6 LIMITATIONS OF STUDY: 1. The problem researchers faced is in summarizing the vast data in short, simple & presentable form. 2. Lack of scientific method. 3. Difficult to hit the right source of data & change according to my requirements. 4. It is a time consuming. 5. Lack of resources. 6. Lack of code of conduct and repetition may be there.
  • 56. 45 CHAPTER V 5.1 DATA ANALYSIS AND INTERPRATATION The data, after collection, has to be processed and analysed in accordance with the outline laid down for the purpose at the time of developing the research plan. This is essential for a scientific study and for ensuring that researcher have all relevant data for making contemplated comparisons and analysis. The processing implies editing, coding, classification and tabulation of collected data so that they are amenable to analysis. The analysis of data in a general way involves a number of closely related question starting from the profile of respondents to the analysis of buyer behaviour towards bath soaps. Apart from the personal data the questionnaire provided some questions through which the perception of the individual as well as the shop keepers was obtained about the HUL bath soap products and their future expectation so that the company can perform accordingly. The sample of 200 respondents randomly selected from the study area and sample size of 60 shop keepers from the area were administered the questionnaire. The data so collected has been presented hereunder and has also been analyzed. RESPONDENT’S PERSONAL PROFILE Part 1 consists of respondent’s profile which includes gender, age group, marital status, educational background, occupation and family income. The questionnaire is distributed tin two parts one is profile of respondents and in another part, researcher asked about the brand of soap which they are using duration of their usage, reason of switching, monthly consumption and impact of promotion scheme on their decision making etc.
  • 57. 46 1. GENDER The gender wise classification of the respondents has a bearing on the consumption pattern of the goods. e.g. If in the family more number females are there naturally their consumption of beauty care & skin care will be more. Keeping this aspect in mind the researcher had called for this data which is presented hereunder: Table 5.1: Gender wise Classification of Respondents Gender No of Respondents Per% of Respondents Male 104 52% Female 96 48% Total 200 100% The total no. of respondents includes in the research is 200. Out of 200 respondents there was 104 male and 96 female. So, the sample has contribution of both male 52% and female 48% respondent. This means a fair analysis can be done about the buyers behavior. Male 52% Female 48% Fig. 5.1: Gender Wise Classification Of Respondents
  • 58. 47 2. AGE GROUP The consumption of the toiletries, cosmetics, tea etc. depends on the age of the family members, hence this data had been included in the questionnaire Table 5.2 : Age wise composition of the respondents’ families Age Group (In years) No of Respondents Per% of Respondents 20 to 30 51 25.5% 30 to 40 87 43.5% 40 to 80 62 31% Total 200 100% The above data has given about percentage of age wise composition of the respondent’s family from a sample of 200 respondents. Most of the respondent lie in the age bracket of 30 to 40 i.e. 87 and contribute 45.5% of sample size, 40 to 80 years i.e. 62 with 31% of sample size further 20 to 30 years i.e. 51 with 25.5% respondents. It can be observed that a fair no. of respondents is included in the survey. 51 87 62 0 10 20 30 40 50 60 70 80 90 100 20 to 30 30 to 40 40 to 80 Noofrespondents Age group Fig. 5.2 : Age Wise Composition of the Respondent's Families
  • 59. 48 3. FAMILY MEMBERS The consumption of the bath soaps depends on the number of the family. In the cities the percentage of joint families is relatively less. If it is a joint family the numbers of guests visiting the family are more and then their domestic requirements are also more. Keeping this aspect in view this data had been included in the questionnaire. Table 5.3: Size wise composition of the respondents’ families No. of Family Members No. of Respondents Per% of Respondents 1 10 5% 2 23 11% 3 42 21% 4 57 29% 5 or more 68 34% Total 200 100% From the above sample size of 200 there are 34% people in the family with 5 or more persons and 29% and 21% people in the family with 4 and 3 persons respectively and 11% and 5% people in the family with 2 and 1 persons respectively. It can be seen that highest contribution was from 5 or more people with 68 out of 200 respondents. 1 5% 2 11% 3 21% 4 29% 5 or more 34% Fig.5.3: Size Wise Composition Of The Respondent's Families
  • 60. 49 4. EDUCATIONAL BACKGROUND The education of the respondent’s family had a bearing on the consumption of toiletries as well as the other products of HUL. If the family was educated naturally they will be hygiene oriented. Table 5.4 : Education wise distribution of the respondents Educational Background No. of Samples Per% of Respondents 10th 41 20.5% 12th 50 25% Graduation 72 36% Post graduation & Above 37 18.5% Total 200 100% The above data revealed that most of respondents are quit educated as pie chart is showing 36% respondents are graduate, 19% are Post graduate and above, 25% are 12th and only 20% is 10th pass. A fair per% of graduate were evaluated, so the analysis become quiet realistic and understandable. 10th 20% 12th 25%Graduation 36% Post graduation & Above 19% Fig. 5.4 : Education Wise Distribution Of The Respondents
  • 61. 50 5. Occupation The occupation of the family had a bearing on the standard of living and the consumption of toiletries. If the family has more children their needs, wants and preferences were different and more. However, if one had employed his /her needs of these items were more. Table 5.5: Occupation wise classification of the respondent families. Occupation No of respondents Per% of Respondents Government service 45 22.5% Executive 37 18.5% Self Employee 37 18.5% Student 48 24% Others 33 16.5% Total 200 100% From the total sample size of 200, 31% are students, 27% are government employee, 16% are executive, again 16% are self employed, and 10% are lies in other occupations like agriculture and farming etc. It can seen that highest per% of sample of students i.e, 31% so the data is collected from youth of India. Government service 27% Executive 16% Self Employee 16% Student 31% OTHES 10% Fig. 5.5: Occupation Wise Classification Of The Respondent Families
  • 62. 51 6. Earning Status The size and composition of the family was vital, as the requirement of the products of HUL volume wise was dependent upon the size of the family. So also the data relating the earning members of the family was collected as the family purchasing power was dependent on it. Keeping this aspect in view this data was collected. Table 5.6: Earning status wise composition of the respondents Earning Status No. of Members Per% of Respondents Earning Members 112 56% Non-Earning Members 88 44% Total 200 100% The above data revealed that out of the 200 respondents 56 per cent were earning members and 44 per cent were non-earning members. This implies a major segment of respondents were earning so a fair analysis can be obtained as a researcher because income class has different needs and wants and different in case of non-income class. Earning Members 56% Non-Earning Members 44% Fig. 5.6: Earning Status Wise Composition Of The Respondents
  • 63. 52 7. INCOME GROUP Family income of the respondent had definitely a great bearing on the family spending on the toiletries which includes buying of combo sets & also prefer quality products and less focus on price which is the motive of HUL. Table 5.7 : Family income wise classification of the respondent families Income Group No of respondents Per% of Respondents 0 – 1 Lakh 40 2% 1 – 2 Lakh 51 25.5% 2 – 3 Lakh 38 19% 3 – 4 Lakh 29 14.5% Above 4 Lakh 42 21% Total 200 100% Interpretation As it is very much well known that people are quit reluctant to tell their family income so the above figures are not exact but representative, so according to that the 25% people between 1 – 2 lakh income group, further below 1 Lakh there are 20% people, between 2 – 3 Lakh there are 19% people, between 3 – 4 Lakh there are15% people and above 4 Lakh there are 21% people. Rests of the 10% respondents are dependent. They may be students and house wives. 0 – 1 Lakh 20% 1 – 2 Lakh 25% 2 – 3 Lakh 19% 3 – 4 Lakh 15% Above 4 Lakh 21% Fig. 5.7 : Family Income Wise Classification Of The Respondent Families
  • 64. 53 PART 2: SURVEY QUESTIONS ANALYSIS 8. SOAP BRANDS PEOPLE USE This is also a vital aspect so far as sells of HUL products are concerned. Knowledge of the product is very much essential for the consumer. Knowledge of which soap brand of HUL respondents has been aware of and the market share of different soap brands of HUL can be obtained through this feedback. Table 5.8 : Respondents knowledge of HUL products Brands No of respondents Per% of Respondents Lux 33 16% Lifebouy 24 12% Breeze 21 10% Liril 23 12% Hamam 18 9% Pears 28 14% Dove 25 13% Others 28 13% Total 200 100% Lux 16% Lifebouy 12% Breeze 10% Liril 12% Hamam 9% Pears 14% Dove 13% Others 14% Fig. 5.8 : Respondents Knowledge of Hul Products
  • 65. 54 It is observed that majority of the products which were listed in the questionnaire were known to the respondents. From the feedback it is observed that the products of HUL had good penetration and there was good response. It is found that most of the people like LUX i.e.16%, then the demand of Pears is 14%, Dove is 13%, Breeze is 10%, Liril is 12%, Lifebuoy is 12% and Hamam is 9%. Rest of the people use other soaps like Breeze, Liril, and Margo. Rest of the people use other soaps like Medimix, Dettol, and Dayna etc. 9. ASSOCIATION WITH EXISTING BRANDS This is an important factor in determining the loyal no. of customer the company have. The respondents which are associates with less no. of duration researcher can analyse the reason for short duration. Table 5.9 : Respondents loyalty with HUL products Duration No of respondents Per% of Respondents 1 Month 9 4% 6 Months 11 5% 1 Year 49 25% 2 or more years 131 66% Total 200 100% 1 Month 4% 6 Months 5% 1 Year 25% 2 or more years 66% Fig. 5.9 : Respondents Loyalty With HUL Products
  • 66. 55 Major chunk of population 66% is associated with associated with same brand from more than two years. 25% from about one year, 5% from 6 months and 4% from 1 year. It shows that a good amount of population is brand loyal in terms of bath soap as more than ½ segment of sample associated with HUL bath soap for more than 2 years. 10. SWITCHOVER TO ANOTHER BRAND This give a fair analysis about HUL bath soap satisfied customers and unsatisfied customer by analyzing their behavior and preferences. The other brands of switchover are : Dettol, Johnson & Jonhson, Medimex, Nivea, Savlon. Table 5.10: Respondents Response over switching to another brand Response No. of Respondents Per% of Respondents Switchover to another Brand 18 9% Continue with existing brand 173 86% Not Responded 9 5% Total 200 100% Switchover to another Brand 9% Continue with existing brand 86% Not Responded 5% Fig. 5.10: Respondents Response Over Switching To Another Brand
  • 67. 56 The consumers thinking regarding with they will be continue with the same brand in near future the response is in favor of companies as 86% people are ready to continue with their existing brand. 9% people are susceptible to brand switching as they are not convinced. This implies that HUL has a fair no. of loyal customer and the remaining switching customer or already switched over customers reasons is analyzed by researcher given below. 11. OTHER BRANDS BUYERS WANT TO SWITCHOVER ARE- Some brands which the buyers want to shift or already shifted, HUL can bring customer by focusing on their problems. 1. Dettol 2. Jonson & Jonson Baby 3. Nivea 4. Medimix 5. Savlon 12. REASON FOR SWITCHOVER TO ANOTHER BRAND This is vital to analyze as it gives the company idea to finds what are the reasons for which buyers are switching and it was necessary for the organization to understand this aspect very clearly so that they can plan their future strategy focusing on those particular aspects. Table 5.12 : Respondents reasons for switching to another brand Reasons for switchover No. of Respondents Per% of Respondents Price 2 11% Quality 4 22% Quantity 5 28% Non- Availability 4 22% Other 3 17% Total 18 100%
  • 68. 57 From the above 18 people who are switching over to the another brand 22% people are unsatisfied with the non-availability of existing brand that‘s why they are switching over and 11% each switchover because of price rises and 22% & 28% switchover because of quality & quantity respectively and others 17% include effective advertisement and sales promotion of other brands & lack of changes in their existing brand. 13. PLACE TO PURCHASE FROM This was an aspect which had a bearing on the marketing source available in the market. There are various avenues open for the people which had given in the following table. Table 5.13 : Place to purchase the soaps Place for Purchase No. of Respondents Per% of Respondents Nearest Kirana Shop 153 77% Super shop 42 21% Not responded 5 2% Total 200 100% Price 11% Quality 22% Quantity 28% Non- Availability 22% Other 17% Fig. 5.12 : Respondents Reasons for Switching to Another Brand
  • 69. 58 The above data revealed that 77% of people still rely to their local kirana shops for Bath Soaps and 21% purchase from super shop which includes Depatmental stores, Big Bazzar, Dmart etc. It means major source of procurement of their requirements was local provision stores, or departmental stores. So HUL should focus on mainly product availability to kirana shops also. 14. Consumption in package This data was sought from the respondents to get feedback on the package they basically used for their regular consumption. This gives researcher an idea about buyers prefer combo pack for discounts or extras or they prefer single sets. Table 5.14: Type of soap package for consumption Types of package Consumption Per% of Respondents Single pack 95 47% Combo pack 105 53% Total 200 100% 153 42 5 0 20 40 60 80 100 120 140 160 180 Nearest Kirana Shop Super shop Not responded NO.OFRESPONDENTS PLACE OF PURCHASE FIG. 5.13 : Place to Purchase the Soaps
  • 70. 59 Above pie chart shows that 53% people prefers soap in combo pack (i.e. Discount Pack) and the 47% people prefers soaps in single pack. This give an idea that major segment prefer to use combo set for soap for their consumption. So HUL should more foucs on bringing more benefits to combo pack customers to get more segment of people. Further the researcher classify the single pack consumption and combo pack consumption of the buyers. 15. From the above analysis 47% out of 200 sample size A. Single pack Consumption Table 5.15.1 : Size frequently buy and average monthly consumption Size No. of buyers Monthly Consumption Average Monthly Consumption 45gm 1 3 3 75gm 11 44 4 100gm 18 36 2 125gm 8 16 2 The pie chart given below from above analysis is consists of size of soap with respect to monthly consumption. Single pack 47% Combo pack 53% Fig. 5.14: TYPE OF SOAP PACKAGE FOR CONSUMPTION
  • 71. 60 From the above sample size there is 47% users of the 100gm size has high monthly consumption in single size. 29% with 75gm pack, 21% with 125gm pack and only 3% with 45gm pack. This means less segment of population used small size soap pack. B. COMBO PACK COMSUPTION Table 5.15.2 : Size frequently buy and average monthly consumption Size No. of Buyers Monthly Consumption Average Monthly Consumption 75gm × 4 25 52 2 100gm × 3 62 186 3 125gm × 4 65 260 4 45gm 3% 75gm 29% 100gm 47% 125gm 21% Fig. 5.15.1 : Size Frequently Buy and Average Monthly Consumption 75gm × 4 11% 100gm × 3 37% 125gm × 4 52% Fig. 5.15.2 : Size Frequently Buy and Average Monthly Consumption
  • 72. 61 From the above sample size there is 52% users of the 125gm× 4 size and also 125gm× 4 gm has highest monthly consumption in combo pack. Followed by 37% users of 100gm x 3 and 11% users of 75gm x 4. From the above analysis of both single and combo pack consumption users the small size packing of soaps is less preferred by users, it can only used for travelling or as a toilet soap less preferred for bathing. 16. SOURCE OF INFORMATION This is also a vital aspect so far as sells of HUL products are concerned. Knowledge of the product is very much essential for the consumer. Knowledge of which advertisement area is powerful in the urban area can be obtained through this feedback. Table 5.16 : Sources of information of HUL products Sources of Information No. of Respondents Per% of Respondents TV 71 35% Print 47 23% Radio 32 16% Store Display 22 11% Hoardings 15 8% Friends & Family 13 7% Total 200 100% 71 47 32 22 15 13 35% 23% 16% 11% 8% 7% 0% 5% 10% 15% 20% 25% 30% 35% 40% 0 10 20 30 40 50 60 70 80 TV Print Radio Store Display Hoardings Friends & Family PER%OFRESPONDENTS NO.OFRESPONDENTS SOURCES OF INFORMATION Fig. 5.16 : Sources of Information of HUL Products
  • 73. 62 How a consumer came to know about a particular brand it is very much important for marketers, because with the help of this they can reach to their market in better way. Itis clear from the finding the T.V Advertisements are the major source of information for customers; rest contributes marginally to the brand awareness. 17.Effects of Sales Promotion like 3Rs off or 25 gm extra This data was sought from the respondents to get feedback on the effect on sales promotion techniques on the customer mindset. This was a vital aspect that needed to be understood. Consumer’s buying decisions were dependent on several factors. It was necessary for the marketing organization to understand this aspect very clearly so that they can plan their marketing strategy focusing on those particular aspects. Table 5.17 : Effect of sales promotion response Response No. of Respondents Per% of Respondents Yes 171 85% No 29 15% Total 200 100% Almost 85% customer‘s agreed that sales promotion schemes do effect the buying decisions. Sales promotion technically motivates the customer to buy the product it includes price off deals, extras, discounts, coupons, buy 1+1 offers etc. But still 15% respondents still don’t buy through offers. Yes 85% No 15% Fig.. 5.17 : Effect of Sales Promotion Response
  • 74. 63 18. ATTRIBUTES MOTIVATES TO PURCHASE THE BRAND This was a vital aspect that needed to be understood. Consumer’s buying decisions were dependent on several factors. It was necessary for the marketing organization to understand this aspect very clearly so that they can plan their marketing strategy focusing on those particular aspects. Table 5.18 : Different attribute motivates buyers to buy Attributes No. of Respondents Per% of Respondents Brand Name 37 18% Advertisements 15 7% Attractive Packaging 20 10% Quality 43 21% Attractive Offers 21 11% Health 17 9% Price 24 12% Fragrances 7 7% Health & Skincare 16 8% Other 0 0% 37 15 20 43 21 17 24 7 16 0 0 5 10 15 20 25 30 35 40 45 50 NO.OFRESPONDENTS ATTRIBUTES FIG. 5.18 : Different Attribute Motivates Buyers To Buy
  • 75. 64 When it comes to why a customer opts for a brand, which attributes attract him most? The opinion is divided into lot of factors, lot of customer prefer for more than one attribute. But three core attribute on which the whole bath soap market is standing are-  Quality 21%  Brand Name 178  Price 12% Interestingly 8% customers feel health also as a choice criterion. 19. RANKING TO ATTRIBUTES Over the past few years because of the Govt. of India Swatch Bharat Abhiyan efforts there is development of quality products at affordable prices have been introduced. Through which the purchasing power of the masses has undergone change which has a positive change on their life style also. This is reflected that gradually the low-quality goods which were locally manufactured goods which used to be earlier available in the markets have gradually paved the way for the standard quality / branded goods. The researcher wanted to have perception of the buyers on this score and hence this statement was included in the statement. Table 5.19 : Grading of attribute that motivates buyers to buy Grade/ attribute Very High High Mediun Low Very Low Fragrance 21 29 10 2 8 Quality 32 22 9 7 0 Packaging 14 24 23 8 1 Price 21 24 14 8 3 Advertisement 12 7 22 22 7 Brand image 11 12 19 17 11 Health 26 16 13 6 9
  • 76. 65 A Pareto chart is a type of chart that contains both bars and a line graph, where individual values are represented in descending order by bars, and the cumulative total is represented by the line. It summarized the total ranking into a single unified bar graph. That helps reader to understand it quickly from high rank attribute to low rank attribute. The graphical representation of 200 sample size shows that the customer gives preferences accordingly – 1st preference to the quality, 2nd preference to the health, 3rd preference to fragrance, 4th preference to the price and 5th preference to the packing. Above attributes motivates to the customers to purchase the bath soap brand. Their may be some more aspects which may not be included but the company has to focus on quality as this is the main aspect customer is looking for.