Four-Wheel Vehicle Suspension Model
•
27 gefällt mir•11,400 views

This document presents a mathematical model of a vehicle suspension that was developed as a midterm project. It includes: 1) A quarter-car model to simulate the bounce of one wheel over a pothole or bump. 2) A full-car model combining 4 quarter-car models to simulate the bounce of each tire. 3) An extension of the full-car model to simulate pitching of the vehicle body when encountering road variations. 4) Consideration of rolling of the vehicle body when taking turns. Non-linear springs are proposed to improve the model.

Empfohlen
Weitere ähnliche Inhalte
Was ist angesagt?
Was ist angesagt? (20)
Ähnlich wie Four-Wheel Vehicle Suspension Model
Ähnlich wie Four-Wheel Vehicle Suspension Model (20)
Kürzlich hochgeladen
Kürzlich hochgeladen (20)
Four-Wheel Vehicle Suspension Model
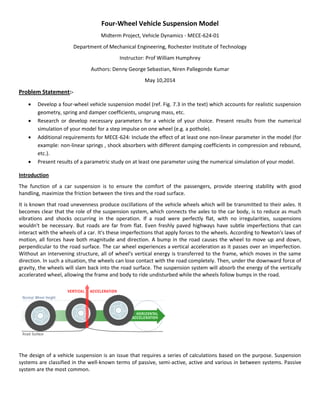
- 1. Four-Wheel Vehicle Suspension Model Midterm Project, Vehicle Dynamics - MECE-624-01 Department of Mechanical Engineering, Rochester Institute of Technology Instructor: Prof William Humphrey Authors: Denny George Sebastian, Niren Pallegonde Kumar May 10,2014 Problem Statement:- Develop a four-wheel vehicle suspension model (ref. Fig. 7.3 in the text) which accounts for realistic suspension geometry, spring and damper coefficients, unsprung mass, etc. Research or develop necessary parameters for a vehicle of your choice. Present results from the numerical simulation of your model for a step impulse on one wheel (e.g. a pothole). Additional requirements for MECE-624: Include the effect of at least one non-linear parameter in the model (for example: non-linear springs , shock absorbers with different damping coefficients in compression and rebound, etc.). Present results of a parametric study on at least one parameter using the numerical simulation of your model. Introduction The function of a car suspension is to ensure the comfort of the passengers, provide steering stability with good handling, maximize the friction between the tires and the road surface. It is known that road unevenness produce oscillations of the vehicle wheels which will be transmitted to their axles. It becomes clear that the role of the suspension system, which connects the axles to the car body, is to reduce as much vibrations and shocks occurring in the operation. If a road were perfectly flat, with no irregularities, suspensions wouldn't be necessary. But roads are far from flat. Even freshly paved highways have subtle imperfections that can interact with the wheels of a car. It's these imperfections that apply forces to the wheels. According to Newton's laws of motion, all forces have both magnitude and direction. A bump in the road causes the wheel to move up and down, perpendicular to the road surface. The car wheel experiences a vertical acceleration as it passes over an imperfection. Without an intervening structure, all of wheel's vertical energy is transferred to the frame, which moves in the same direction. In such a situation, the wheels can lose contact with the road completely. Then, under the downward force of gravity, the wheels will slam back into the road surface. The suspension system will absorb the energy of the vertically accelerated wheel, allowing the frame and body to ride undisturbed while the wheels follow bumps in the road. The design of a vehicle suspension is an issue that requires a series of calculations based on the purpose. Suspension systems are classified in the well-known terms of passive, semi-active, active and various in between systems. Passive system are the most common.
- 2. Mathematical Model The purpose of this project is to develop a mathematical model of a car going over a pothole and a bump. Two models, a quarter car model and a full car model, were developed to study the effects of spring and damper on the vertical displacement, a.k.a bounce, of the car as well as the pitch (full car model only). A) Quarter Car Model The quarter car model was developed to observe the bounce of one wheel of a car when it travels over a pothole and a bump. Two Simulink models were developed for these cases. The parameters of the quarter car model are: Ms- sprung mass Mus- unsprung mass Ks- suspension stiffness bs- damping constant Kt- tire stiffness xs- vertical displacement of sprung mass xus- vertical displacement of unsprung mass Two equations of motion for the quarter car model are computed as follows: E.O.M 1 Ms*xs" + bs*xs' + Ks*xs = bs*xus'+ Ks*xus E.O.M 2 Mus*xus" + bs*xus' + (Kt + Ks)*xus = bs*xs'+ Ks*xus + Kt*r
- 3. A.1) Simulink Model Case 1: Pothole A Simulink model was developed to depict the quarter car model of a car going over a pothole. We added the values for each parameter in the model using Matlab. Matlab Code: clear all clc Ms= 2500; %Sprung Mass of Car in Kg% Mus=320; %Unsprung Mass in Kg% Ks=29771.556; %Stiffness of Suspension Spring in N/m% Kt=350000; %Stiffness of Tire in N/m^2% Bs=2533.3; %Damping Co-eff of Suspension NS/m% sim('QuaterCarModelwithPothole') Case 2: Bump The following Simulink model and Matlab code was used for finding the bounce of the car over a bump.
- 4. Matlab code clear all clc Ms= 2500; %Sprung Mass of Car in Kg% Mus=320; %Unsprung Mass in Kg% Ks=29771.556; %Stiffness of Suspension Spring in N/m% Kt=350000; %Stiffness of Tire in N/m^2% Bs=2533.3; %Damping Co-eff of Suspension NS/m% sim('QuaterCarModelwithHump') A.2) Result The Simulink model computes the displacement to time graph for each case, which is essentially the bounce of the sprung mass and unsprung mass, over the pothole or bump. The graph for each case is displayed in the next page. Case 1: Pothole Figure 1 Case 2: Bump Figure 2
- 5. B) Full Car Model- Bounce Bounce occurs when the car goes over an undulation or imperfections in the road, causing the sprung and unsprung mass to undergo a displacement in its vertical height of the spring damper system. A full car model was developed; which is basically 4 quarter car models joined together to give a single output which translates to a 4 input, 1 output model. The quarter car model forms the basis of the full car model. From these given equations, we form the E.O.M for the full car model which comprises of 8 equations of motion, i.e. 2 E.O.Ms for each tire. The full car model is shown below. The E.O.M of each tire wheel is computed, as done using the quarter car model, with their respective damping and stiffness constants. The following images describes how we computed the E.O.M for the full car model.
- 9. B.1) Simulink Model A full car body model was developed using Simulink. The full car body model is based on the quarter car model. This model is essentially 4 quarter car models linked together as a single model; making it a 4 input, 1 output model. Matlab Code: clear all clc Ms=2500; %Sprung Mass of Car Front End Left Side in Kg% Mus=180; %Unsprung Mass of Tire ) in Kg% Ksf=28525; %Suspension Stiffness of Front Tires in N/m% Ksr=33250; %Suspension Stiffness of Rear Tires in N/m% Bsf=5984.1; %Front Suspension Damping% Bsr=5493.6; %Suspension Damping of Rear Tires in Kg-s/m% Ktf=350000; %Stiffness of Front Tires in N/m% Ktr=350000; %Stiffness of Rear Tires in N/m% sim('FullCarModel') B.2) Signal Builder Figure 3
- 10. We used the signal builder to develop 4 different road profiles. This way we could observe the variation in the bounce of each car tire over a certain road profile as described below: Signal 1- It depicts the front right tire of the car entering a pothole. Signal 2- It depicts the rear right tire of the car going over a small flat bump. Signal 3- It depicts the front left tire of the car going through a small flat dip. Signal 4- It depicts the rear left tire of the car leaving a pothole. B.3) Result The graph showcases the bounce of each tire over the road profile. The time interval for each tire is the difference between the final time and initial time on the signal builder. Figure 4 C) Full Car Model- Pitch Pitching is the condition in which the car (sprung mass) moves back and forth upon acceleration or deceleration, or after going over a pothole/bump. On the basis of the full car model for bounce, we formulated a model to incorporate pitching in a car using the following formula.
- 11. C.1) Simulink Model A Simulink model was developed to include the effect of pitching in a car. Matlab Code: clear clc Csf=5984.1; %Front Suspension Damping% Csr=5493.6; %Rear Suspension Damping% Ksf=28525; %Front Suspension Stiffness% Ksr=33250; %Rear Suspension Stiffness% Iyy=2.2785963151817; %Body Moment of inertia About Center of Gravity%
- 12. Mb=2500; %Body Mass% L=1.5630; %Distance of Front Suspension from C.G% M=1.08615; %Distance of Rear Suspesion From C.G% g=9.81; %Acceleration Due to Gravity% sim('PitchModel') C.2) Result Figure 5 D) Rolling Rolling is the condition whereby the car chassis experiences roll over when taking a turn. This is caused due to either low spring stiffness, absence of antiroll bar, and/or low damping. It also depends on the car's center of gravity. The closer the roll axis is to the center of gravity, the less the chassis will roll in a corner. Chassis rolling at one end of the car or the other gives more grip to that end of the car. A simulink model was developed to observe the effects of the car's spring stiffness and damping on the effect of roll on the car's suspension. D.1) Simulink Model The following Simulink model incorporates the effect of rolling on a suspension system.
- 13. Matlab Code clear clc Ir=460; %Rolling Moment of Inertia% Kf=35000; %Front Suspension Stiffness% Kr=38000; %Rear Suspension Stiffness% Bf=1000; %Front Suspension Damping% Br=1100; %Rear Suspension Damping% Tf=0.505; %Distance Between the Front Left and Right Tires% Tr=0.557; %Distance Between the Rear Left and Right Tires% sim('RollingModel') plot(tout,simout) D.2) Result:- Figure 6 Conclusion:- The car in this case undergoes bounce, pitching and rolling. We used specific parameters of the car, its suspension stiffness and damping values for each event. From the graphs, Figure 1 and Figure 2, we can see that the bounce characteristics for a quarter car model are similar when the car moves either over a pothole or a bump at the same speed; with same parameter values. However, a closer comparison of both graphs reveal that there is a slight difference in the vertical displacement of the sprung mass and unsprung mass at a given time interval. The bounce characteristics of the car going over a pothole appears to be sharper than that over a bump. The sharper curves in the time interval between 1 and 2 seconds, in the case of pothole, could indicate that the spring-damper system undergoes more compression and a higher rebound than going over a bump. The effect of bouncing in a full car model is observed from the characteristic behavior of each tire according to the graph, in Figure 4, which is explained as follows- 1. The yellow graph represents the front right tire of the car entering the pot hole. The spring damper system undergoes compression which is represented by the peak in the graph, it then rebounds due to the spring force, and then it becomes steady after a few seconds. 2. The two purple graphs represents the rear right tire entering and leaving a flat bump. The system initially undergoes a rebound when it goes over the bump, becomes steady over the flat area of the
- 14. bump before entering compression upon leaving the bump, the compression is higher than the rebound in this case. It attains steady state a few seconds later. 3. The two red graphs indicates the front left tire going over a flat dip on the road. We see compression occurs first when the tire enters into the dip, it becomes steady over the flat surface of the dip before rebounding at the exit of the dip. Steady state is reached a few seconds later. 4. The blue graph represents the rear left tire of the car exiting a pothole. We can see that the system undergoes rebound before getting compressed due to the gravity force, and finally settling into a steady state. In the case of pitching for a full car model, the resulting graphs, in Figure 5, shows the variation of each parameter (angular velocity, translational velocity, reaction forces at front wheels) over time due to the pitching of the car and change in the road height. The pitching occurs when there is a change in moment of the car, as shown in the last graph. This change in moment causes variations in the angular velocity ("θ dot"), given in the first graph, and a slight change in the reaction force, shown in the third graph. The change in road height, fourth graph, causes variation in the translational velocity ("z dot") and the reaction force at the front wheel, shown in the second and third graph respectively. We see an increase in the angular velocity of the car along with a slight increase in the reaction force at the front wheel, without any effect on the translational velocity due to the pitch. The change in road height causes reduction in angular velocity and translational velocity. There is a sudden drop in the reaction force at front wheel, possibly due to compression of the car suspension. The rebound of the car, due to spring force, contributes to a linear increase in the reaction force over a given time before in settles into a constant state. From the rolling model, we can see that the roll of the vehicle varies when the car takes a turn and goes over a bump. The variation in roll occurs when the car passes over the bump which causes an increase in damping leading to compression and rebound. The graph, in Figure 5, shows changes in the roll acceleration, rate and angle with time. The roll acceleration, 1st graph, varies over the entire length of time due to factors such as pitching, bouncing, damping, compression and rebound of the spring damper system. From the 2nd and 3rd graphs, the roll rate and roll angle increases during compression stage and decreases with rebound and slowly settles into steady state. Inclusion of a Non-Linear Parameter:- Example- Use of a Non Linear Spring:- A Non Linear spring has a non-linear relationship between force and displacement. A graph showing the force v/s displacement will be a line with changing slope. For e.g. a leaf spring is a non linear spring whose effective length is changed during movement in response to an applied force to vary its spring characteristics. The Graph is as shown below for a Non Linear Spring,
- 15. Light Commercial vehicles incorporate both linear or non-linear springs and non linear dampers. These provide additional improvement in vehicle handling and ride. We tried to generate the non-linear equations of motions of the quarter car and full car and model them with the help of SIMULINK. But there was a slight mistake while trying to generate the equations of motion so we were unable to come up with a definitive Mathematical Model. From our analysis of a non-linear spring we can say that non linear springs offer a chassis tuner the means to achieve a complaint suspension in the rough and a tight suspension for high speed turns. References:- http://trackpedia.com/wiki/Vehicle_Dynamics_-_Cause_and_Effect_Guide http://thecartech.com/subjects/auto_eng2/Roll_Center.htm http://www.ces.clemson.edu/~lonny/pubs/journal/sae983051.pdf http://www.physics.ohio-state.edu/~gan/teaching/spring99/C12.pdf http://www.iosrjournals.org/iosr-jmce/papers/sicete(mech)-volume3/28.pdf http://books.google.co.uk/books?id=M9gDAAAAMBAJ&pg=PA128&lpg=PA90&dq=gyrocopter+ejection+seat&so urce=bl&ots=F6XdY0Bwxr&sig=D-qy0YIKOrhLBxDFV7- jbgpwi8o&hl=en&ei=kYKGTNG4Ksf84Abll6jSBA&sa=X&oi=book_result&ct=result&resnum=9&ved=0CDcQ6AEwC A#v=onepage&q=gyrocopter%20ejection%20seat&f=true http://www.freepatentsonline.com/3727900.html http://www.simulia.com/download/solutions/automotive_cust%20references/chassis_mulitleaf_auc02_chrysle r.pdf