SlideShare ist ein Scribd-Unternehmen logo
1 von 4
Downloaden Sie, um offline zu lesen
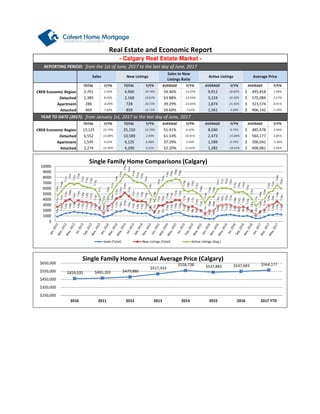
CREB Economic Region
Detached
Apartment
Attached
2017
CREB Economic Region
Detached
Apartment
Attached
3.85%
13,125
TOTAL Y/Y% TOTAL Y/Y% AVERAGE Y/Y%
6,552 13.08% 10,589 2.49% 61.14% 10.81% 2,473 -15.86% 564,177$
-1.36%
2,274 14.39% 4,290 0.21% 52.20%
2.94%
AVERAGE Y/Y% AVERAGE Y/Y%
23.73% 25,150 15.70% 51.41% 6.52% 8,040 9.75% 485,478$
406,142$ 2.29%859 16.71% 54.60% -7.62% 1,561 3.58%
from January 1st, 2017 to the last day of June, 2017
469 7.82%
YEAR TO DATE (2017):
3,224 10.30% 570,084$ 2.17%
286 -8.04% 728 20.73% 39.29% -23.83% 1,874 21.45% 323,574$
AVERAGE
9,912 10.82% 495,818$ 2.94%2,701
0.41%
- Calgary Real Estate Market -
from the 1st of June, 2017 to the last day of June, 2017
2.54% 4,960 20.74% 54.46% -15.07%
REPORTING PERIOD:
AVERAGE Y/Y%Y/Y%
1,385 8.03% 2,168 24.67% 63.88% -13.34%
TOTAL Y/Y% TOTAL Y/Y% AVERAGE Y/Y%
Real Estate and Economic Report
Sales New Listings
Sales to New
Listings Ratio
Active Listings Average Price
13.82% 1,282 -10.41% 406,081$ 1.05%
1,545 9.42% 4,125 6.48% 37.29% 2.59% 1,589 6.74% 300,042$
$459,035 $465,202 $479,880
$517,333
$558,738 $537,883 $547,683 $564,177
$250,000
$350,000
$450,000
$550,000
$650,000
2010 2011 2012 2013 2014 2015 2016 2017 YTD
Single Family Home Annual Average Price (Calgary)
0
1000
2000
3000
4000
5000
6000
7000
8000
9000
10000
Single Family Home Comparisons (Calgary)
Sales (Total) New Listings (Total) Active Listings (Avg.)
Total Residential
Single Family Detached
Condominium
Duplex/Rowhouse
2017
Total Residential
Single Family Detached
Condominium
Duplex/Rowhouse
Sales to New
Listings Ratio
Average Price
- Edmonton Real Estate Market -
TOTAL Y/Y% TOTAL Y/Y% AVERAGE Y/Y% AVERAGE
REPORTING PERIOD: from the 1st of June, 2017 to the last day of June, 2017
Sales New Listings
Y/Y%
4.78%
862 7.48% 1,375 13.08% 63.00% -4.48% 469,068$ 2.16%
1,422 5.57% 2,651 13.44% 53.64% -6.94% 398,341$
-2.53%
137 10.48% 235 32.02% 58.00% -16.74% 362,707$ -2.01%
AVERAGE Y/Y%
401 -0.50% 994 13.47% 40.00% -13.05% 258,751$
YEAR TO DATE (2017): from January 1st, 2017 to the last day of June, 2017
AVERAGE Y/Y%
6,432 2.39% 13,698 -6.31% 46.05% 6.43%
TOTAL Y/Y%
376,696$ 1.60%
TOTAL Y/Y%
3,780 1.29% 6,852 -13.39% 53.80% 12.18% 448,731$ 2.33%
1,921 3.28% 5,417 6.01% 35.00% -3.20% 247,080$ -1.05%
621 1.97% 1,151 -5.66% 53.50% 3.84% 367,896$ 4.35%
528
648
923
1,022
1,179
1,198
1,125
983
857
863
673
436
485
747
917
1,147
1,213
1,324
1,158
1,019
1,020
908
777
439
390
547
876
1,001
1,078
1,243
1,111
884
873
728
680
435
342
517
605
691
775
802
670
623
621
585
433
333
323
460
661
664
810
862
955
1,115
1,467
1,569
1,911
1,586
1,491
1,349
1,268
1,059
783
415
1,070
1,082
1,585
1,818
2,085
1,829
1,601
1,354
1,335
1,260
794
534
1,298
1,428
1,883
1,964
1,974
1,886
1,782
1,741
1,660
1,283
1,059
719
1,308
1,584
1,241
1,279
1,283
1,216
1,130
1,136
1,084
855
710
369
784
905
1,204
1,197
1,387
1,375
0
500
1000
1500
2000
2500
Single Family Home Comparisons (Edmonton)
Sales (Total) New Listings (Total)
20
25
30
35
40
45
50
Single Family Home Average Days on Market (Calgary)
0
50
100
150
200
250
300
350
< $100 $100 -
$199
$200 -
$299
$300 -$
349
$350 -
$399
$400 -
$449
$450 -
$499
$500 -
$549
$550 -
$599
$600 -
$649
$650 -
$699
$700 -
$799
$800 -
$899
$900 -
$999
$1M +
Jun-16
Jun-17
Number of Sales by Price Range (Calgary Total Sales)
Alberta
Canada
Unemployment Rate
May-17 in Alberta
Retail Trade (mill. $'s) in Canada
Apr-17
Total Mortgages
Apr-17
*the following information is based on current available data from: http://economicdashboard.albertacanada.com/, www.statcan.gc.ca/dai-quo/ and RBC Economic
Outlook,http://www.cba.ca/en/component/content/publication/69-statistics, http://www.atb.com/SiteCollectionDocuments
- Alberta Economic Indicators -
TOTAL Y/Y%2017f
2.60%
in Alberta
in Alberta 7.80%
in Canada
2016f
Real GDP Growth Annual
Y/Y%TOTAL
Net Migration to AB
Jan-17
581,385
5.95%in Alberta 6,670
in Canada in Alberta
4,282 1.51%
32.71
-3.60%
48.03%
in Canada 4,729,180
48,639
6.60% -4.35%
6.96%
2.90%
0.95%
0.85%
-0.50% May-17
$1,127.86 0.34%
$971.89 1.80%
2,685
Mortgages 90 Day Arrears
Apr-17
Avg. Weekly Earnings
12,415 -4.51%in Canada
Housing Starts (SAAR*, 000's)
2016f 1.50%
31.17%
$383,226 $379,485
$392,446
$409,438
$431,882 $436,416 $441,046 $448,731
$300,000
$350,000
$400,000
$450,000
$500,000
2010 2011 2012 2013 2014 2015 2016 2017 YTD
Single Family Home Annual Average Price (Edmonton)
0
20
40
60
80
Average Days on Market (Edmonton)
0.20%
0.23%
0.25%
0.28%
0.30%
0.33%
0.35%
0.38%
0.40%
0.43%
0.45%
0.48%
0.50%
Mortgages
% of Arrears to Total Number of
Mortgages (AB)
% of Arrears to Total Number of
Mortgages (Canada)
Mortgage Arrears Ratio; Canada vs Alberta
Resources
http://economicdashboard.albertacanada.com/
http://www.creb.com/
http://www.ereb.com/REALTORSAssociationOfEdmonton.html
http://www.capp.ca/Pages/default.aspx
http://homepriceindex.ca/hpi_tool_en.html
http://www.cba.ca/en/component/content/publication/69-statistics
http://www.finance.alberta.ca/aboutalberta/
http://www.statcan.gc.ca/dai-quo/
http://www.housepriceindex.ca/default.aspx?langue=EN
*Housing Starts: This represents that seasonally adjusted annual rate (SAAR) for the month.
The statements and statistics in this report have been compiled by Calvert Home Mortgage Investment Corporation based on
information from sources considered to be reliable. We make no representation or warranty, express or implied, as to its accuracy
or completeness. This publication is for the people we work with and should not be construed as an offer to sell or a solicitation to
buy securities.
http://www.rbc.com/economics/economic-data/index.html
http://www.bankofcanada.ca/wp-content/uploads/2014/12/fsr-december2014.pdf
1,146
1,119
1,116
$1,100
$1,110
$1,120
$1,130
$1,140
$1,150
2015 2016 2017YTD
Average Weekly Earnings Average Weekly Earnings (Alberta)
$0.00
$10.00
$20.00
$30.00
$40.00
$50.00
$60.00
$70.00
WCS Oil Prices
WTI Oil Prices
WTI - WCS Price Differential
WTI and WCS Pricing and Price Differential (US$)
4,100
4,150
4,200
4,250
4,300
4,350
2015 2016 2017YTD
Population of Alberta Population (thousands)

Weitere ähnliche Inhalte

Was ist angesagt?

3.Jun2016San Mateo-SFRLogo
3.Jun2016San Mateo-SFRLogo3.Jun2016San Mateo-SFRLogo
3.Jun2016San Mateo-SFRLogoRay Jeter
 
4e futurevalueordinaryannuityof1 table3
4e futurevalueordinaryannuityof1 table34e futurevalueordinaryannuityof1 table3
4e futurevalueordinaryannuityof1 table3xmas1er
 
柏瑞週報 20190223
柏瑞週報 20190223柏瑞週報 20190223
柏瑞週報 20190223Pinebridge
 
Ene 2012
Ene 2012Ene 2012
Ene 2012jerry53
 
Lincoln crowne engineering & mining services report 06092013
Lincoln crowne engineering & mining services report 06092013Lincoln crowne engineering & mining services report 06092013
Lincoln crowne engineering & mining services report 06092013Lincoln Crowne & Company
 
柏瑞週報 20200214
柏瑞週報 20200214柏瑞週報 20200214
柏瑞週報 20200214Pinebridge
 
柏瑞週報 20200703
柏瑞週報 20200703柏瑞週報 20200703
柏瑞週報 20200703Pinebridge
 
柏瑞週報 20200508
柏瑞週報 20200508柏瑞週報 20200508
柏瑞週報 20200508Pinebridge
 
Business statistics -_assignment_dec_2019_zf_sgc5ylme
Business statistics -_assignment_dec_2019_zf_sgc5ylmeBusiness statistics -_assignment_dec_2019_zf_sgc5ylme
Business statistics -_assignment_dec_2019_zf_sgc5ylmeAssignmentchimp
 
柏瑞週報 20190215
柏瑞週報 20190215柏瑞週報 20190215
柏瑞週報 20190215Pinebridge
 
Quantify 2016 - Progressive
Quantify 2016 - ProgressiveQuantify 2016 - Progressive
Quantify 2016 - ProgressiveYe Na Lee
 
Chuan phat trien cua tre duoi 5 tuoi WHO
Chuan phat trien cua tre duoi 5 tuoi WHOChuan phat trien cua tre duoi 5 tuoi WHO
Chuan phat trien cua tre duoi 5 tuoi WHOhangntbk83
 

Was ist angesagt? (16)

Falco Valkenburg, ocin22
Falco Valkenburg, ocin22Falco Valkenburg, ocin22
Falco Valkenburg, ocin22
 
3.Jun2016San Mateo-SFRLogo
3.Jun2016San Mateo-SFRLogo3.Jun2016San Mateo-SFRLogo
3.Jun2016San Mateo-SFRLogo
 
4e futurevalueordinaryannuityof1 table3
4e futurevalueordinaryannuityof1 table34e futurevalueordinaryannuityof1 table3
4e futurevalueordinaryannuityof1 table3
 
柏瑞週報 20190223
柏瑞週報 20190223柏瑞週報 20190223
柏瑞週報 20190223
 
Ene 2012
Ene 2012Ene 2012
Ene 2012
 
Lincoln crowne engineering & mining services report 06092013
Lincoln crowne engineering & mining services report 06092013Lincoln crowne engineering & mining services report 06092013
Lincoln crowne engineering & mining services report 06092013
 
柏瑞週報 20200214
柏瑞週報 20200214柏瑞週報 20200214
柏瑞週報 20200214
 
柏瑞週報 20200703
柏瑞週報 20200703柏瑞週報 20200703
柏瑞週報 20200703
 
柏瑞週報 20200508
柏瑞週報 20200508柏瑞週報 20200508
柏瑞週報 20200508
 
Mrp ii
Mrp iiMrp ii
Mrp ii
 
Budget figures
Budget figuresBudget figures
Budget figures
 
MLS Housing Report October 2010
MLS Housing Report October 2010MLS Housing Report October 2010
MLS Housing Report October 2010
 
Business statistics -_assignment_dec_2019_zf_sgc5ylme
Business statistics -_assignment_dec_2019_zf_sgc5ylmeBusiness statistics -_assignment_dec_2019_zf_sgc5ylme
Business statistics -_assignment_dec_2019_zf_sgc5ylme
 
柏瑞週報 20190215
柏瑞週報 20190215柏瑞週報 20190215
柏瑞週報 20190215
 
Quantify 2016 - Progressive
Quantify 2016 - ProgressiveQuantify 2016 - Progressive
Quantify 2016 - Progressive
 
Chuan phat trien cua tre duoi 5 tuoi WHO
Chuan phat trien cua tre duoi 5 tuoi WHOChuan phat trien cua tre duoi 5 tuoi WHO
Chuan phat trien cua tre duoi 5 tuoi WHO
 

Ähnlich wie July 2017 Monthly economic report real estate analysis benchmark - july 7, 2017

Se Health Funding Comparison
Se Health Funding ComparisonSe Health Funding Comparison
Se Health Funding ComparisonRon_Janzen
 
Valuation Of ASHOK LEYLAND
Valuation Of ASHOK LEYLANDValuation Of ASHOK LEYLAND
Valuation Of ASHOK LEYLANDAakash Singh
 
Boston 3rdQ 2019 Real Estate Sales Summary: Boston Proper neighborhoods
Boston 3rdQ 2019 Real Estate Sales Summary: Boston Proper neighborhoodsBoston 3rdQ 2019 Real Estate Sales Summary: Boston Proper neighborhoods
Boston 3rdQ 2019 Real Estate Sales Summary: Boston Proper neighborhoodsFRANKLIN KNOTTS
 
Tabelas mat financeira
Tabelas mat financeiraTabelas mat financeira
Tabelas mat financeiraAdriano Bruni
 
Boston Real Estate Sales 1stQ 2019 Stats Report
Boston Real Estate Sales 1stQ 2019 Stats ReportBoston Real Estate Sales 1stQ 2019 Stats Report
Boston Real Estate Sales 1stQ 2019 Stats ReportFRANKLIN KNOTTS
 
Appendix a present value tables 2
Appendix a   present value tables 2Appendix a   present value tables 2
Appendix a present value tables 2Shelvy Adila
 
Lanareiknir verdtryggd overdtryggd samanburdur og raungreidslur 20101208
Lanareiknir verdtryggd overdtryggd samanburdur og raungreidslur 20101208Lanareiknir verdtryggd overdtryggd samanburdur og raungreidslur 20101208
Lanareiknir verdtryggd overdtryggd samanburdur og raungreidslur 20101208Mar Wolfgang Mixa
 
Market Report for August 2017 - Residential Resale
Market Report for August 2017 - Residential ResaleMarket Report for August 2017 - Residential Resale
Market Report for August 2017 - Residential ResaleMichelle Makos
 
2019 05 Monthly Home Sales Stats for Calgary
2019 05 Monthly Home Sales Stats for Calgary2019 05 Monthly Home Sales Stats for Calgary
2019 05 Monthly Home Sales Stats for CalgaryJerry Charlton
 
房貸本息表
房貸本息表房貸本息表
房貸本息表llykccl
 
August 2015 - Market snapshot - General Overview
August 2015 - Market snapshot - General OverviewAugust 2015 - Market snapshot - General Overview
August 2015 - Market snapshot - General OverviewMLSListings Inc
 
Dodo pizza monthly update - january 2019
Dodo pizza   monthly update - january 2019Dodo pizza   monthly update - january 2019
Dodo pizza monthly update - january 2019Kirill Vyrypaev
 
Tablas propoleos
Tablas propoleosTablas propoleos
Tablas propoleosRalMejia1
 
Okanagan Stats June 2022
Okanagan Stats June 2022Okanagan Stats June 2022
Okanagan Stats June 2022Vicky Aulakh
 
June 2015 - General Overview
June 2015 - General Overview June 2015 - General Overview
June 2015 - General Overview MLSListings Inc
 
July 2015 - Market Snapshot - General Overview
July 2015  - Market Snapshot - General OverviewJuly 2015  - Market Snapshot - General Overview
July 2015 - Market Snapshot - General OverviewMLSListings Inc
 

Ähnlich wie July 2017 Monthly economic report real estate analysis benchmark - july 7, 2017 (20)

Se Health Funding Comparison
Se Health Funding ComparisonSe Health Funding Comparison
Se Health Funding Comparison
 
Valuation Of ASHOK LEYLAND
Valuation Of ASHOK LEYLANDValuation Of ASHOK LEYLAND
Valuation Of ASHOK LEYLAND
 
Boston 3rdQ 2019 Real Estate Sales Summary: Boston Proper neighborhoods
Boston 3rdQ 2019 Real Estate Sales Summary: Boston Proper neighborhoodsBoston 3rdQ 2019 Real Estate Sales Summary: Boston Proper neighborhoods
Boston 3rdQ 2019 Real Estate Sales Summary: Boston Proper neighborhoods
 
Tabelas mat financeira
Tabelas mat financeiraTabelas mat financeira
Tabelas mat financeira
 
Tabelas1
Tabelas1Tabelas1
Tabelas1
 
Tugas 1
Tugas 1Tugas 1
Tugas 1
 
Boston Real Estate Sales 1stQ 2019 Stats Report
Boston Real Estate Sales 1stQ 2019 Stats ReportBoston Real Estate Sales 1stQ 2019 Stats Report
Boston Real Estate Sales 1stQ 2019 Stats Report
 
Appendix a present value tables 2
Appendix a   present value tables 2Appendix a   present value tables 2
Appendix a present value tables 2
 
Lanareiknir verdtryggd overdtryggd samanburdur og raungreidslur 20101208
Lanareiknir verdtryggd overdtryggd samanburdur og raungreidslur 20101208Lanareiknir verdtryggd overdtryggd samanburdur og raungreidslur 20101208
Lanareiknir verdtryggd overdtryggd samanburdur og raungreidslur 20101208
 
Market Report for August 2017 - Residential Resale
Market Report for August 2017 - Residential ResaleMarket Report for August 2017 - Residential Resale
Market Report for August 2017 - Residential Resale
 
2019 05 Monthly Home Sales Stats for Calgary
2019 05 Monthly Home Sales Stats for Calgary2019 05 Monthly Home Sales Stats for Calgary
2019 05 Monthly Home Sales Stats for Calgary
 
房貸本息表
房貸本息表房貸本息表
房貸本息表
 
Climate change and nrcs practices chambers
Climate change and nrcs practices   chambersClimate change and nrcs practices   chambers
Climate change and nrcs practices chambers
 
August 2015 - Market snapshot - General Overview
August 2015 - Market snapshot - General OverviewAugust 2015 - Market snapshot - General Overview
August 2015 - Market snapshot - General Overview
 
Dodo pizza monthly update - january 2019
Dodo pizza   monthly update - january 2019Dodo pizza   monthly update - january 2019
Dodo pizza monthly update - january 2019
 
Tablas propoleos
Tablas propoleosTablas propoleos
Tablas propoleos
 
Okanagan Stats June 2022
Okanagan Stats June 2022Okanagan Stats June 2022
Okanagan Stats June 2022
 
June 2015 - General Overview
June 2015 - General Overview June 2015 - General Overview
June 2015 - General Overview
 
Present value tables
Present value tablesPresent value tables
Present value tables
 
July 2015 - Market Snapshot - General Overview
July 2015  - Market Snapshot - General OverviewJuly 2015  - Market Snapshot - General Overview
July 2015 - Market Snapshot - General Overview
 

Mehr von Dean Koeller

CHMIC Economic Report- November 2016
CHMIC Economic Report- November 2016CHMIC Economic Report- November 2016
CHMIC Economic Report- November 2016Dean Koeller
 
CHMIC August 2016 Economic Report
CHMIC August 2016 Economic ReportCHMIC August 2016 Economic Report
CHMIC August 2016 Economic ReportDean Koeller
 
Chmic economic report aug 2016
Chmic economic report aug 2016Chmic economic report aug 2016
Chmic economic report aug 2016Dean Koeller
 
Chmic economic report aug 2016
Chmic economic report aug 2016Chmic economic report aug 2016
Chmic economic report aug 2016Dean Koeller
 
Chmic economic report july 2016
Chmic economic report july 2016Chmic economic report july 2016
Chmic economic report july 2016Dean Koeller
 
Real Estate Analysis & Benchmark 121214
Real Estate Analysis & Benchmark 121214Real Estate Analysis & Benchmark 121214
Real Estate Analysis & Benchmark 121214Dean Koeller
 

Mehr von Dean Koeller (6)

CHMIC Economic Report- November 2016
CHMIC Economic Report- November 2016CHMIC Economic Report- November 2016
CHMIC Economic Report- November 2016
 
CHMIC August 2016 Economic Report
CHMIC August 2016 Economic ReportCHMIC August 2016 Economic Report
CHMIC August 2016 Economic Report
 
Chmic economic report aug 2016
Chmic economic report aug 2016Chmic economic report aug 2016
Chmic economic report aug 2016
 
Chmic economic report aug 2016
Chmic economic report aug 2016Chmic economic report aug 2016
Chmic economic report aug 2016
 
Chmic economic report july 2016
Chmic economic report july 2016Chmic economic report july 2016
Chmic economic report july 2016
 
Real Estate Analysis & Benchmark 121214
Real Estate Analysis & Benchmark 121214Real Estate Analysis & Benchmark 121214
Real Estate Analysis & Benchmark 121214
 

Kürzlich hochgeladen

It’s Time to Fight Back Against the Media Narrative Regarding Real Estate Com...
It’s Time to Fight Back Against the Media Narrative Regarding Real Estate Com...It’s Time to Fight Back Against the Media Narrative Regarding Real Estate Com...
It’s Time to Fight Back Against the Media Narrative Regarding Real Estate Com...Tom Blefko
 
Triaa Housing Lohegaon Pune E-Brochure.pdf
Triaa Housing Lohegaon Pune  E-Brochure.pdfTriaa Housing Lohegaon Pune  E-Brochure.pdf
Triaa Housing Lohegaon Pune E-Brochure.pdfManishSaxena95
 
Raymond Ten X Era Viviana Mall Thane Brochure.pdf
Raymond Ten X Era Viviana Mall Thane Brochure.pdfRaymond Ten X Era Viviana Mall Thane Brochure.pdf
Raymond Ten X Era Viviana Mall Thane Brochure.pdfPrachiRudram
 
Ganga Fusion 85 Gurugram - PDF Download.pdf
Ganga Fusion 85 Gurugram - PDF Download.pdfGanga Fusion 85 Gurugram - PDF Download.pdf
Ganga Fusion 85 Gurugram - PDF Download.pdfanjalisaini334541
 
Honer Richmont Hyderabad E brochure - A Life With A View
Honer Richmont Hyderabad E brochure - A Life With A ViewHoner Richmont Hyderabad E brochure - A Life With A View
Honer Richmont Hyderabad E brochure - A Life With A ViewAhanundefined
 
Kolte Patil Universe Hinjewadi Pune Brochure.pdf
Kolte Patil Universe Hinjewadi Pune Brochure.pdfKolte Patil Universe Hinjewadi Pune Brochure.pdf
Kolte Patil Universe Hinjewadi Pune Brochure.pdfPrachiRudram
 
LCAR Unit 20 - Appraising Real Estate - 14th Edition Revised
LCAR Unit 20 - Appraising Real Estate - 14th Edition RevisedLCAR Unit 20 - Appraising Real Estate - 14th Edition Revised
LCAR Unit 20 - Appraising Real Estate - 14th Edition RevisedTom Blefko
 
SVN Live 4.15.24 Weekly Property Broadcast
SVN Live 4.15.24 Weekly Property BroadcastSVN Live 4.15.24 Weekly Property Broadcast
SVN Live 4.15.24 Weekly Property BroadcastSVN International Corp.
 
Managing Uncertainty: Newman George Leech's Real Estate Finance Strategy
Managing Uncertainty: Newman George Leech's Real Estate Finance StrategyManaging Uncertainty: Newman George Leech's Real Estate Finance Strategy
Managing Uncertainty: Newman George Leech's Real Estate Finance StrategyNewman George Leech
 
Volition Meetup 2024 03 Mortgages & Interest Rates – Is The Worst Behind Us_ ...
Volition Meetup 2024 03 Mortgages & Interest Rates – Is The Worst Behind Us_ ...Volition Meetup 2024 03 Mortgages & Interest Rates – Is The Worst Behind Us_ ...
Volition Meetup 2024 03 Mortgages & Interest Rates – Is The Worst Behind Us_ ...Volition Properties
 
Listing Turkey Green life Istanbul Eyup Catalog
Listing Turkey Green life Istanbul Eyup CatalogListing Turkey Green life Istanbul Eyup Catalog
Listing Turkey Green life Istanbul Eyup CatalogListing Turkey
 
LCAR RE Practice - The Pearson Vue State Exam
LCAR RE Practice - The Pearson Vue State ExamLCAR RE Practice - The Pearson Vue State Exam
LCAR RE Practice - The Pearson Vue State ExamTom Blefko
 
Dubai Real Estate vs Other Global Markets-a-Comparative-Analysis
Dubai Real Estate vs Other Global Markets-a-Comparative-AnalysisDubai Real Estate vs Other Global Markets-a-Comparative-Analysis
Dubai Real Estate vs Other Global Markets-a-Comparative-AnalysisHomeStation1
 
Sobha Oakshire Devanhalli Bangalore.pdf.pdf
Sobha Oakshire Devanhalli Bangalore.pdf.pdfSobha Oakshire Devanhalli Bangalore.pdf.pdf
Sobha Oakshire Devanhalli Bangalore.pdf.pdfkratirudram
 
Goyal Orchid Life East Bangalore.pdf.pdf
Goyal Orchid Life East Bangalore.pdf.pdfGoyal Orchid Life East Bangalore.pdf.pdf
Goyal Orchid Life East Bangalore.pdf.pdfkratirudram
 
LCAR Unit 21 - Closing the Real Estate Transaction - 14th Edition Revised
LCAR Unit 21 - Closing the Real Estate Transaction - 14th Edition RevisedLCAR Unit 21 - Closing the Real Estate Transaction - 14th Edition Revised
LCAR Unit 21 - Closing the Real Estate Transaction - 14th Edition RevisedTom Blefko
 
Experion Elements Phase 1 Noida E-Brochure
Experion Elements Phase 1 Noida E-BrochureExperion Elements Phase 1 Noida E-Brochure
Experion Elements Phase 1 Noida E-BrochureRealEstate Info
 
Fractional Ownership Vs Physical Ownership.pdf
Fractional Ownership Vs Physical Ownership.pdfFractional Ownership Vs Physical Ownership.pdf
Fractional Ownership Vs Physical Ownership.pdfHavendaxa
 
Sankla East World Hadapsar Pune Brochure.pdf
Sankla East World Hadapsar Pune Brochure.pdfSankla East World Hadapsar Pune Brochure.pdf
Sankla East World Hadapsar Pune Brochure.pdfabbu831446
 
Shriram Hebbal One Kempapura Bangalore E- Brochure.pdf
Shriram Hebbal One Kempapura Bangalore E- Brochure.pdfShriram Hebbal One Kempapura Bangalore E- Brochure.pdf
Shriram Hebbal One Kempapura Bangalore E- Brochure.pdffaheemali990101
 

Kürzlich hochgeladen (20)

It’s Time to Fight Back Against the Media Narrative Regarding Real Estate Com...
It’s Time to Fight Back Against the Media Narrative Regarding Real Estate Com...It’s Time to Fight Back Against the Media Narrative Regarding Real Estate Com...
It’s Time to Fight Back Against the Media Narrative Regarding Real Estate Com...
 
Triaa Housing Lohegaon Pune E-Brochure.pdf
Triaa Housing Lohegaon Pune  E-Brochure.pdfTriaa Housing Lohegaon Pune  E-Brochure.pdf
Triaa Housing Lohegaon Pune E-Brochure.pdf
 
Raymond Ten X Era Viviana Mall Thane Brochure.pdf
Raymond Ten X Era Viviana Mall Thane Brochure.pdfRaymond Ten X Era Viviana Mall Thane Brochure.pdf
Raymond Ten X Era Viviana Mall Thane Brochure.pdf
 
Ganga Fusion 85 Gurugram - PDF Download.pdf
Ganga Fusion 85 Gurugram - PDF Download.pdfGanga Fusion 85 Gurugram - PDF Download.pdf
Ganga Fusion 85 Gurugram - PDF Download.pdf
 
Honer Richmont Hyderabad E brochure - A Life With A View
Honer Richmont Hyderabad E brochure - A Life With A ViewHoner Richmont Hyderabad E brochure - A Life With A View
Honer Richmont Hyderabad E brochure - A Life With A View
 
Kolte Patil Universe Hinjewadi Pune Brochure.pdf
Kolte Patil Universe Hinjewadi Pune Brochure.pdfKolte Patil Universe Hinjewadi Pune Brochure.pdf
Kolte Patil Universe Hinjewadi Pune Brochure.pdf
 
LCAR Unit 20 - Appraising Real Estate - 14th Edition Revised
LCAR Unit 20 - Appraising Real Estate - 14th Edition RevisedLCAR Unit 20 - Appraising Real Estate - 14th Edition Revised
LCAR Unit 20 - Appraising Real Estate - 14th Edition Revised
 
SVN Live 4.15.24 Weekly Property Broadcast
SVN Live 4.15.24 Weekly Property BroadcastSVN Live 4.15.24 Weekly Property Broadcast
SVN Live 4.15.24 Weekly Property Broadcast
 
Managing Uncertainty: Newman George Leech's Real Estate Finance Strategy
Managing Uncertainty: Newman George Leech's Real Estate Finance StrategyManaging Uncertainty: Newman George Leech's Real Estate Finance Strategy
Managing Uncertainty: Newman George Leech's Real Estate Finance Strategy
 
Volition Meetup 2024 03 Mortgages & Interest Rates – Is The Worst Behind Us_ ...
Volition Meetup 2024 03 Mortgages & Interest Rates – Is The Worst Behind Us_ ...Volition Meetup 2024 03 Mortgages & Interest Rates – Is The Worst Behind Us_ ...
Volition Meetup 2024 03 Mortgages & Interest Rates – Is The Worst Behind Us_ ...
 
Listing Turkey Green life Istanbul Eyup Catalog
Listing Turkey Green life Istanbul Eyup CatalogListing Turkey Green life Istanbul Eyup Catalog
Listing Turkey Green life Istanbul Eyup Catalog
 
LCAR RE Practice - The Pearson Vue State Exam
LCAR RE Practice - The Pearson Vue State ExamLCAR RE Practice - The Pearson Vue State Exam
LCAR RE Practice - The Pearson Vue State Exam
 
Dubai Real Estate vs Other Global Markets-a-Comparative-Analysis
Dubai Real Estate vs Other Global Markets-a-Comparative-AnalysisDubai Real Estate vs Other Global Markets-a-Comparative-Analysis
Dubai Real Estate vs Other Global Markets-a-Comparative-Analysis
 
Sobha Oakshire Devanhalli Bangalore.pdf.pdf
Sobha Oakshire Devanhalli Bangalore.pdf.pdfSobha Oakshire Devanhalli Bangalore.pdf.pdf
Sobha Oakshire Devanhalli Bangalore.pdf.pdf
 
Goyal Orchid Life East Bangalore.pdf.pdf
Goyal Orchid Life East Bangalore.pdf.pdfGoyal Orchid Life East Bangalore.pdf.pdf
Goyal Orchid Life East Bangalore.pdf.pdf
 
LCAR Unit 21 - Closing the Real Estate Transaction - 14th Edition Revised
LCAR Unit 21 - Closing the Real Estate Transaction - 14th Edition RevisedLCAR Unit 21 - Closing the Real Estate Transaction - 14th Edition Revised
LCAR Unit 21 - Closing the Real Estate Transaction - 14th Edition Revised
 
Experion Elements Phase 1 Noida E-Brochure
Experion Elements Phase 1 Noida E-BrochureExperion Elements Phase 1 Noida E-Brochure
Experion Elements Phase 1 Noida E-Brochure
 
Fractional Ownership Vs Physical Ownership.pdf
Fractional Ownership Vs Physical Ownership.pdfFractional Ownership Vs Physical Ownership.pdf
Fractional Ownership Vs Physical Ownership.pdf
 
Sankla East World Hadapsar Pune Brochure.pdf
Sankla East World Hadapsar Pune Brochure.pdfSankla East World Hadapsar Pune Brochure.pdf
Sankla East World Hadapsar Pune Brochure.pdf
 
Shriram Hebbal One Kempapura Bangalore E- Brochure.pdf
Shriram Hebbal One Kempapura Bangalore E- Brochure.pdfShriram Hebbal One Kempapura Bangalore E- Brochure.pdf
Shriram Hebbal One Kempapura Bangalore E- Brochure.pdf
 

July 2017 Monthly economic report real estate analysis benchmark - july 7, 2017

  • 1. CREB Economic Region Detached Apartment Attached 2017 CREB Economic Region Detached Apartment Attached 3.85% 13,125 TOTAL Y/Y% TOTAL Y/Y% AVERAGE Y/Y% 6,552 13.08% 10,589 2.49% 61.14% 10.81% 2,473 -15.86% 564,177$ -1.36% 2,274 14.39% 4,290 0.21% 52.20% 2.94% AVERAGE Y/Y% AVERAGE Y/Y% 23.73% 25,150 15.70% 51.41% 6.52% 8,040 9.75% 485,478$ 406,142$ 2.29%859 16.71% 54.60% -7.62% 1,561 3.58% from January 1st, 2017 to the last day of June, 2017 469 7.82% YEAR TO DATE (2017): 3,224 10.30% 570,084$ 2.17% 286 -8.04% 728 20.73% 39.29% -23.83% 1,874 21.45% 323,574$ AVERAGE 9,912 10.82% 495,818$ 2.94%2,701 0.41% - Calgary Real Estate Market - from the 1st of June, 2017 to the last day of June, 2017 2.54% 4,960 20.74% 54.46% -15.07% REPORTING PERIOD: AVERAGE Y/Y%Y/Y% 1,385 8.03% 2,168 24.67% 63.88% -13.34% TOTAL Y/Y% TOTAL Y/Y% AVERAGE Y/Y% Real Estate and Economic Report Sales New Listings Sales to New Listings Ratio Active Listings Average Price 13.82% 1,282 -10.41% 406,081$ 1.05% 1,545 9.42% 4,125 6.48% 37.29% 2.59% 1,589 6.74% 300,042$ $459,035 $465,202 $479,880 $517,333 $558,738 $537,883 $547,683 $564,177 $250,000 $350,000 $450,000 $550,000 $650,000 2010 2011 2012 2013 2014 2015 2016 2017 YTD Single Family Home Annual Average Price (Calgary) 0 1000 2000 3000 4000 5000 6000 7000 8000 9000 10000 Single Family Home Comparisons (Calgary) Sales (Total) New Listings (Total) Active Listings (Avg.)
  • 2. Total Residential Single Family Detached Condominium Duplex/Rowhouse 2017 Total Residential Single Family Detached Condominium Duplex/Rowhouse Sales to New Listings Ratio Average Price - Edmonton Real Estate Market - TOTAL Y/Y% TOTAL Y/Y% AVERAGE Y/Y% AVERAGE REPORTING PERIOD: from the 1st of June, 2017 to the last day of June, 2017 Sales New Listings Y/Y% 4.78% 862 7.48% 1,375 13.08% 63.00% -4.48% 469,068$ 2.16% 1,422 5.57% 2,651 13.44% 53.64% -6.94% 398,341$ -2.53% 137 10.48% 235 32.02% 58.00% -16.74% 362,707$ -2.01% AVERAGE Y/Y% 401 -0.50% 994 13.47% 40.00% -13.05% 258,751$ YEAR TO DATE (2017): from January 1st, 2017 to the last day of June, 2017 AVERAGE Y/Y% 6,432 2.39% 13,698 -6.31% 46.05% 6.43% TOTAL Y/Y% 376,696$ 1.60% TOTAL Y/Y% 3,780 1.29% 6,852 -13.39% 53.80% 12.18% 448,731$ 2.33% 1,921 3.28% 5,417 6.01% 35.00% -3.20% 247,080$ -1.05% 621 1.97% 1,151 -5.66% 53.50% 3.84% 367,896$ 4.35% 528 648 923 1,022 1,179 1,198 1,125 983 857 863 673 436 485 747 917 1,147 1,213 1,324 1,158 1,019 1,020 908 777 439 390 547 876 1,001 1,078 1,243 1,111 884 873 728 680 435 342 517 605 691 775 802 670 623 621 585 433 333 323 460 661 664 810 862 955 1,115 1,467 1,569 1,911 1,586 1,491 1,349 1,268 1,059 783 415 1,070 1,082 1,585 1,818 2,085 1,829 1,601 1,354 1,335 1,260 794 534 1,298 1,428 1,883 1,964 1,974 1,886 1,782 1,741 1,660 1,283 1,059 719 1,308 1,584 1,241 1,279 1,283 1,216 1,130 1,136 1,084 855 710 369 784 905 1,204 1,197 1,387 1,375 0 500 1000 1500 2000 2500 Single Family Home Comparisons (Edmonton) Sales (Total) New Listings (Total) 20 25 30 35 40 45 50 Single Family Home Average Days on Market (Calgary) 0 50 100 150 200 250 300 350 < $100 $100 - $199 $200 - $299 $300 -$ 349 $350 - $399 $400 - $449 $450 - $499 $500 - $549 $550 - $599 $600 - $649 $650 - $699 $700 - $799 $800 - $899 $900 - $999 $1M + Jun-16 Jun-17 Number of Sales by Price Range (Calgary Total Sales)
  • 3. Alberta Canada Unemployment Rate May-17 in Alberta Retail Trade (mill. $'s) in Canada Apr-17 Total Mortgages Apr-17 *the following information is based on current available data from: http://economicdashboard.albertacanada.com/, www.statcan.gc.ca/dai-quo/ and RBC Economic Outlook,http://www.cba.ca/en/component/content/publication/69-statistics, http://www.atb.com/SiteCollectionDocuments - Alberta Economic Indicators - TOTAL Y/Y%2017f 2.60% in Alberta in Alberta 7.80% in Canada 2016f Real GDP Growth Annual Y/Y%TOTAL Net Migration to AB Jan-17 581,385 5.95%in Alberta 6,670 in Canada in Alberta 4,282 1.51% 32.71 -3.60% 48.03% in Canada 4,729,180 48,639 6.60% -4.35% 6.96% 2.90% 0.95% 0.85% -0.50% May-17 $1,127.86 0.34% $971.89 1.80% 2,685 Mortgages 90 Day Arrears Apr-17 Avg. Weekly Earnings 12,415 -4.51%in Canada Housing Starts (SAAR*, 000's) 2016f 1.50% 31.17% $383,226 $379,485 $392,446 $409,438 $431,882 $436,416 $441,046 $448,731 $300,000 $350,000 $400,000 $450,000 $500,000 2010 2011 2012 2013 2014 2015 2016 2017 YTD Single Family Home Annual Average Price (Edmonton) 0 20 40 60 80 Average Days on Market (Edmonton) 0.20% 0.23% 0.25% 0.28% 0.30% 0.33% 0.35% 0.38% 0.40% 0.43% 0.45% 0.48% 0.50% Mortgages % of Arrears to Total Number of Mortgages (AB) % of Arrears to Total Number of Mortgages (Canada) Mortgage Arrears Ratio; Canada vs Alberta
  • 4. Resources http://economicdashboard.albertacanada.com/ http://www.creb.com/ http://www.ereb.com/REALTORSAssociationOfEdmonton.html http://www.capp.ca/Pages/default.aspx http://homepriceindex.ca/hpi_tool_en.html http://www.cba.ca/en/component/content/publication/69-statistics http://www.finance.alberta.ca/aboutalberta/ http://www.statcan.gc.ca/dai-quo/ http://www.housepriceindex.ca/default.aspx?langue=EN *Housing Starts: This represents that seasonally adjusted annual rate (SAAR) for the month. The statements and statistics in this report have been compiled by Calvert Home Mortgage Investment Corporation based on information from sources considered to be reliable. We make no representation or warranty, express or implied, as to its accuracy or completeness. This publication is for the people we work with and should not be construed as an offer to sell or a solicitation to buy securities. http://www.rbc.com/economics/economic-data/index.html http://www.bankofcanada.ca/wp-content/uploads/2014/12/fsr-december2014.pdf 1,146 1,119 1,116 $1,100 $1,110 $1,120 $1,130 $1,140 $1,150 2015 2016 2017YTD Average Weekly Earnings Average Weekly Earnings (Alberta) $0.00 $10.00 $20.00 $30.00 $40.00 $50.00 $60.00 $70.00 WCS Oil Prices WTI Oil Prices WTI - WCS Price Differential WTI and WCS Pricing and Price Differential (US$) 4,100 4,150 4,200 4,250 4,300 4,350 2015 2016 2017YTD Population of Alberta Population (thousands)