1. Sector
Capital Markets: Results Review 4Q13 / FY13
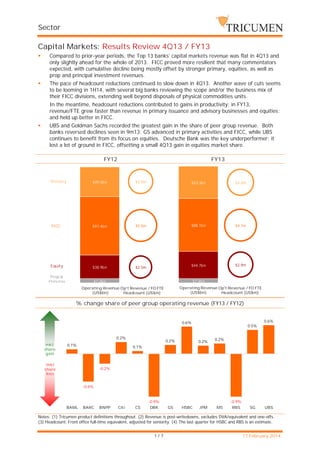
Compared to prior-year periods, the Top 13 banks’ capital markets revenue was flat in 4Q13 and
only slightly ahead for the whole of 2013. FICC proved more resilient that many commentators
expected, with cumulative decline being mostly offset by stronger primary, equities, as well as
prop and principal investment revenues.
The pace of headcount reductions continued to slow down in 4Q13. Another wave of cuts seems
to be looming in 1H14, with several big banks reviewing the scope and/or the business mix of
their FICC divisions, extending well beyond disposals of physical commodities units.
In the meantime, headcount reductions contributed to gains in productivity: in FY13,
revenue/FTE grew faster than revenue in primary issuance and advisory businesses and equities;
and held up better in FICC.
250
UBS and Goldman Sachs recorded the greatest gain in the share of peer group revenue. Both
3.5
banks reversed declines3.5
seen in 9m13; GS advanced in primary activities and FICC, while UBS
continues to benefit from its focus on equities. Deutsche Bank was the key underperformer; it
lost a lot of ground in FICC, offsetting a small 4Q13 gain in equities market share.
3
FY12
200
Primary
3 FY13
$2.9m
$49.0bn
2.5
$3.2m
$53.3bn2.5
150
2
2
100
FICC
$88.1bn
$5.0m
$97.4bn
$4.7m
1.5
1.5
50
1
Equity
$38.9bn
Prop &
0 PrincInv
$44.7bn
$2.5m
1
$2.9m
$7.4bn
$7.2bn
FY12 0.5
Operating Revenue Op't Revenue / FO FTE
(US$bn) 0.8
1
Headcount (US$m) 1.2
0.5
Operating Revenue Op't Revenue / FO FTE
1
(US$bn) 0.8 Headcount (US$m) 1.2
% change share of peer group operating revenue (FY13 / FY12)
0.008
0.6%
0.006
0.004
0.002
mkt
share
gain 0
0.2%
0.1%
0.2%
0.5%
0.2%
0.6%
0.2%
0.1%
-0.002
mkt
share
-0.004
loss
-0.2%
-0.006
-0.6%
-0.008
-0.01
BAML
BARC
BNPP
Citi
CS
-0.9%
DBK
GS
HSBC
JPM
MS
-0.9%
RBS
SG
UBS
Notes: (1) Tricumen product definitions throughout. (2) Revenue is post-writedowns, excludes DVA/equivalent and one-offs.
(3) Headcount: Front office full-time equivalent, adjusted for seniority. (4) The last quarter for HSBC and RBS is an estimate.
1/7
17 February 2014
2. Sector
Primary issuance & Advisory
DCM bond issuance fees declined relative to 4Q12, but there was a notable slowdown in the
margin erosion seen in 3Q13 as high yield held up better than investment grade. The combined
FY13 bond fee earnings of banks in this report were 14% ahead of FY12. Loan issuance volumes
were in line with 3Q13 across the main products, but leveraged loan fees slipped.
Securitisation: US ABS 4Q13 revenue grew from 3Q13, pushing the FY13 growth to 30%. In
MBS origination, a solid 4Q13 helped 2013 ending in-line with 2012. MBS trading picked up from
the lacklustre 3Q13, too, but not enough to offset a significant drop seen earlier in the year.
ECM put in stellar performance: ‘our’ Top 13 banks surged their FY13 and 4Q13 fees by 44% and
69%, respectively; profit margin jumped, too, driven in particular by IPOs. In 2013, EMEA and
Japan saw the highest increase in fees and volumes, but margins grew the most in Americas.
M&A volumes and fee dynamics in FY13 were broadly aligned in EMEA and Americas, but in
APAC, the leaders’ fees declined despite an increase in reported volumes. FY13 and 4Q13 were
3.5
flat versus a prior-year periods.
3.5
60
FY12
50
3
40
FY13
2.5
3
2.5
$3.9m
$32.8bn
DCM &
Securitisation
30
$31.5bn
$3.7m
2
1.5
20
2
1.5
$7.0bn
ECM
10
$10.0bn
$6.6m
1
1
M&A /
Advisory
$10.6bn
0
$9.2m
$10.5bn
$1.6m
FY12 0.5
Operating Revenue Op't Revenue / FO FTE
(US$bn) 0.8
1
Headcount (US$m) 1.2
$1.6m
0.5
Operating Revenue Op't Revenue / FO FTE
1
(US$bn) 0.8 Headcount (US$m) 1.2
% change share of peer group operating revenue (FY13 / FY12)
0.01
0.9%
0.008
0.6%
0.8%
0.7%
0.006
0.5%
mkt
0.004
share
gain
0.002
0.2%
mkt
share 0
loss
0.0%
-0.0%
-0.0%
-0.002
-0.1%
-0.3%
-0.3%
-0.004
-0.4%
-0.006
BAML
BARC
BNPP
Citi
CS
DBK
GS
HSBC
JPM
MS
RBS
SG
UBS
Notes: (1) Tricumen product definitions throughout. (2) Revenue is post-writedowns, excludes DVA/equivalent and one-offs.
(3) Headcount: Front office full-time equivalent, adjusted for seniority. (4) The last quarter for HSBC and RBS is an estimate.
2/7
17 February 2014
3. Sector
FICC
In FX, the G10 markets remained soft due to tight margins. Emerging markets revenue declined,
though not as much as some predicted. LatAm revenue growth tailed off in late 2013, but APAC
proved more resilient (FY13 grew 19% y/y), and CEEMEA 4Q13 revenue advanced from 3Q13.
The implementation of SEF rules for rates derivatives (see our Sept-13 Special Note) continued to
channel volumes through electronic (i.e. lower margin) platforms. A combination of ECB actions
and low rates continued to blight the short end; but exotic and LatAm rates grew versus 4Q13.
The high yield credit continued to outperform in 4Q13. CDS trading also grew; though with SEFs
rules hitting CDS in Feb-14, we see striking the balance between CDS and bond marketmaking as
the challenge for 2014. The CLO market jumped 50% versus FY12, a step to pre-2008 normality;
European investors - unlike their US counterparts – so far do not seem troubled by ‘Volcker Rule’.
2013 was another patchy year for commodities: for example, APAC slowed down in 4Q13, while
US metals saw moderate growth. The rationalisation of commodities platforms is accelerating (as
3.5
3.5
detailed in the Company section); the ‘grandfathering’ rules in the USA may allow Goldman Sachs
and Morgan Stanley to retain a significant physical capacity.
120
FY12
100
FX
$5.9m
$21.9bn
80
2.5
60
Rates
$41.1bn
40
$21.5bn
2
$27.8bn
Commodities
2.5
$5.9m
2
$5.0m
$30.8bn
$4.0m
1.5
1.5
20 Credit
0
FY13
3
3
$6.3m
$6.6bn
$28.8bn
$3.1m
1
$7.1bn
$6.5m
1
FY12 0.5
Operating Revenue Op't Revenue / FO FTE
(US$bn) 0.8
1
Headcount (US$m) 1.2
$3.5m
0.5
Operating Revenue Op't Revenue / FO FTE
1
(US$bn) 0.8 Headcount (US$m) 1.2
% change share of peer group operating revenue: FICC total (FY13 / FY12)
0.02
1.6%
0.015
1.3%
0.01
0.6%
mkt
0.005
share
gain
0
mkt
share
-0.005
loss
0.5%
0.0%
0.1%
0.1%
RBS
SG
UBS
-0.0%
-0.1%
-0.4%
-0.01
-1.0%
-1.0%
-0.015
-1.4%
-0.02
BAML
BARC
BNPP
Citi
CS
DBK
GS
HSBC
JPM
MS
Notes: (1) Tricumen product definitions throughout. (2) Revenue is post-writedowns, excludes DVA/equivalent and one-offs.
(3) Headcount: Front office full-time equivalent, adjusted for seniority. (4) The last quarter for HSBC and RBS is an estimate.
3/7
17 February 2014
4. Sector
Equities
High touch cash equities revenue grew moderately in 4Q13, mostly due to Europe; electronic
business was more buoyant, with strong sequential growth. In 2013, Japan outperformed
overall, with volumes peaking in 2Q13, but APAC ex-Japan also surged 40% versus FY12.
Equity derivatives index options trading in 4Q13 grew relative to 4Q12 in both EMEA and AMER in contrast to the single stock business. Structured products boomed in 4Q13 in the US, with
volumes c.70% ahead year-on-year; business was stronger in other regions too, but with notable
variations between individual product segments and countries.
The importance of a balanced equity derivatives business - where client diversity reduces the
need for hedging - continues to increase. We expect that structured equities producers without
such diversity will continue to struggle with increasing hedging costs in 1H14.
50
Prime services revenues were mixed: some banks were better able to take advantage of
increased client balances and financing needs. The leaders edged3.5
ahead in 4Q13.
3.5
FY12
FY13
45
3
3
40
$1.9m
$13.3bn
35
$1.5m
$11.2bn
2.5
EQ Cash
2.5
30
25
2
2
$21.7bn
20
EQ Derv'&
COnverts
$4.4m
$3.7m
$18.5bn
1.5
1.5
1
15
1
10
5 Prime
Services
$9.1bn
0
$9.7bn
$2.9m
FY12 0.5
Operating Revenue Op't Revenue / FO FTE
(US$bn) 0.8
1
Headcount (US$m) 1.2
$3.1m
0.5
Operating Revenue Op't Revenue / FO FTE
1
(US$bn) 0.8 Headcount (US$m) 1.2
% change share of peer group operating revenue (FY13 / FY12)
0.02
0.01
1.4%
0.8%
0.7%
0.6%
0.2%
0.2%
0.0%
0
mkt
share
-0.01
gain
-0.1%
0.9%
-0.0%
-0.1%
-0.5%
mkt
-0.02
share
loss
-0.03
-0.04
-4.1%
-0.05
BAML
BARC
BNPP
Citi
CS
DBK
GS
HSBC
JPM
MS
RBS
SG
UBS
Notes: (1) Tricumen product definitions throughout. (2) Revenue is post-writedowns, excludes DVA/equivalent and one-offs.
(3) Headcount: Front office full-time equivalent, adjusted for seniority. (4) The last quarter for HSBC and RBS is an estimate.
4/7
17 February 2014
5. Sector
Rankings
FY13 (Operating revenue, US$, Global Level 1)
BAML
BARC
BNPP
Citi
CS
DBK
3
Capital Markets: Total
JPM
3
3
3
1
2
2
3
1
2
3
Rates
1
2
3
2
3
3
1
Commodities
EQ Cash
3
1
1
3
Prime Services
2
Prop Trading
2
2
2
EQ Derv & Converts
3
1
1
Credit
2
2
1
M&A / Advisory
FX
UBS
1
1
Secondary
SG
3
2
Securitisation
ECM
RBS
1
2
MS
2
2
1
DCM Bonds
DCM Loans
HSBC
1
3
Primary
GS
1
1
Principal Investments
3
1
2
3
3
2
Source: Tricumen. Notes: (1) Tricumen product definitions throughout. (2) Revenue is post-writedowns, excludes
DVA/equivalent and one-offs, as described in the Company Section. (4) The last quarter for HSBC and RBS is an estimate.
Dynamics
FY13/FY12 (Operating revenue, % change, US$, Global Level 1)
BAML
BARC
BNPP
Citi
CS
DBK
GS
HSBC
JPM
MS
RBS
SG
UBS
Primary
Top 25%
Bottom 25%
+3%
Capital Markets: Total
-4%
+15%
+5%
DCM Bonds
+19%
+1%
DCM Loans
+25%
-5%
+11%
-30%
Securitisation
N/M
ECM
N/M
+49%
+6%
M&A / Advisory
N/M
+9%
-12%
+0%
-8%
+0%
-7%
-19%
-31%
Secondary
FX
Rates
Credit
N/M
+23%
-9%
Commodities
N/M
+7%
-16%
EQ Cash
N/M
+23%
+12%
+40%
+9%
EQ Derv & Converts
Prime Services
N/M
Prop Trading
N/M
Principal Investments
N/M
N/M
N/M
N/M
N/M
N/M
N/M
+14%
N/M
N/M
+3%
N/M
N/M
-4%
-39%
N/M
+115%
-46%
Source: Tricumen. Notes: (1) Tricumen product definitions throughout. (2) Arrows show % change in revenue vs peers. Up/down-arrows: top-/bottom-quartile. (3) Revenue is post-writedowns, excludes DVA/equivalent and one-offs, as described in
the Company Section. (4) The last quarter for HSBC and RBS is an estimate.
5/7
17 February 2014
6. Sector
Rankings
4Q13 (Operating revenue, US$, Global Level 1)
BAML
BARC
BNPP
Citi
CS
DBK
3
Capital Markets: Total
HSBC
3
1
3
2
3
1
3
FX
Rates
3
3
1
2
Credit
2
2
2
1
1
3
1
3
2
1
2
3
EQ Derv & Converts
2
2
1
Secondary
3
3
M&A / Advisory
2
1
3
Prime Services
1
2
Prop Trading
1
3
Principal Investments
UBS
3
1
EQ Cash
SG
1
Securitisation
Commodities
RBS
1
2
2
ECM
MS
2
2
1
DCM Bonds
DCM Loans
JPM
1
3
Primary
GS
2
3
1
2
Source: Tricumen. Notes: (1) Tricumen product definitions throughout. (2) Revenue is post-writedowns, excludes
DVA/equivalent and one-offs, as described in the Company Section. (4) The last quarter for HSBC and RBS is an estimate.
Dynamics
4Q13/4Q12 (Operating revenue, % change, US$, Global Level 1)
BAML
BARC
BNPP
Citi
CS
DBK
GS
HSBC
JPM
MS
RBS
SG
UBS
Primary
Top 25%
Bottom 25%
+12%
Capital Markets: Total
-1%
+7%
-3%
DCM Bonds
+7%
-20%
DCM Loans
-5%
-26%
Securitisation
+2%
-15%
ECM
N/M
N/M
+73%
+24%
M&A / Advisory
N/M
+21%
-3%
+13%
-3%
FX
+3%
-15%
Rates
-5%
-52%
Credit
+19%
-20%
+13%
-26%
+42%
+13%
Secondary
Commodities
N/M
N/M
EQ Cash
N/M
EQ Derv & Converts
N/M
Prime Services
+27%
-1%
+13%
+1%
N/M
+9%
-44%
N/M
+171%
+20%
N/M
Prop Trading
N/M
Principal Investments
N/M
N/M
N/M
N/M
N/M
N/M
N/M
N/M
N/M
N/M
N/M
N/M
N/M
Source: Tricumen. Notes: (1) Tricumen product definitions throughout. (2) Arrows show % change in revenue vs peers. Up/down-arrows: top-/bottom-quartile. (3) Revenue is post-writedowns, excludes DVA/equivalent and one-offs, as described in
the Company Section. (4) The last quarter for HSBC and RBS is an estimate.
6/7
17 February 2014
7. Sector
About Tricumen
Tricumen was founded in 2008. It quickly became a strong provider of diversified market intelligence
across the capital markets and has since expanded into transaction and corporate banking coverage.
Tricumen’s data has been used by many of the world’s leading investment banks as well as strategy
consulting firms, investment managers and ‘blue chip’ corporations.
Situated near Cambridge in the UK, Tricumen is almost exclusively staffed with senior individuals with
an extensive track record of either working for or analysing banks; and boasts what we believe is the
largest capital markets-focused research network of its peer group.
Notes & Caveats
This report and the information contained herein may not be reproduced or distributed in the whole or
in part without the prior written consent of Tricumen Limited. Such consent is often given, provided
that the information released is sourced to Tricumen and that it does not prejudice Tricumen Limited’s
business or compromise the company’s ability to analyse the financial markets.
Tricumen Limited has used all reasonable care in writing, editing and presenting the information found
in this report. All reasonable effort has been made to ensure the information supplied is accurate and
not misleading. For the purposes of cross- market comparison, all numerical data is normalised in
accordance to Tricumen Limited’s proprietary product classification. Fully-researched dataset may
contain margin of error of +/-10%; for modelled datasets, this margin may be wider.
The information and commentary provided in this report has been compiled for informational purposes
only. We recommend that independent advice and enquiries should be sought before acting upon it.
Readers should not rely on this information for legal, accounting, investment, or similar purposes. No
part of this report constitutes investment advice, any form of recommendation, or a solicitation to buy
or sell any instrument or to engage in any trading or investment activity or strategy. Tricumen Limited
does not provide investment advice or personal recommendation nor will it be deemed to have done so.
Tricumen Limited makes no representation, guarantee or warranty as to the suitability, accuracy or
completeness of the report or the information therein. Tricumen Limited assumes no responsibility for
information contained in this report and disclaims all liability arising from negligence or otherwise in
respect of such information.
Tricumen Limited is not liable for any damages arising in contract, tort or otherwise from the use of or
inability to use this report or any material contained in it, or from any action or decision taken as a
result of using the report.
7/7
17 February 2014