1. 9M Nine-month report 2012
Letter from the Executive Board
Dear Shareholders,
Dear Readers,
We are currently experiencing the best of all worlds: The unemploy- Based on the performance of the business so far this year and the out-
ment rate in Germany is at its lowest level for two decades, wages and look, we are able to confirm our previous forecast, which we increased
salaries are rising sharply, the savings rate is in decline, and the trend in in May. We expect to slightly increase the current dividend of € .10
1
private consumption is very encouraging. It is little wonder then that per share, meaning that you continue to share in Deutsche EuroShop’s
after nine months we are able to report that our shopping center port- success. We intend to continue with our proven strategy and would like
folio has met our expectations. to take this opportunity to thank you for your confidence in us.
The center expansions opened in 2011 in Dresden (Altmarkt-Galerie), Hamburg, November 2012
Wildau (A10 Center) and Sulzbach (Main-Taunus-Zentrum) have made
a good start. Together with the Allee-Center Magdeburg, which was
acquired in 2011, and the existing portfolio, they generated an increase
in revenue of around 14% year-on-year.
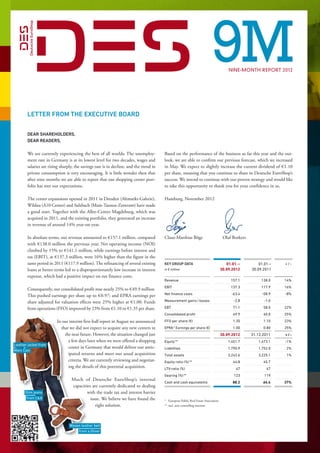
In absolute terms, our revenue amounted to € 157.1 million, compared Claus-Matthias Böge Olaf Borkers
with € 38.0 million the previous year. Net operating income (NOI)
1
climbed by 15% to € 41.1 million, while earnings before interest and
1
tax (EBIT), at € 37.3 million, were 16% higher than the figure in the
1
same period in 2011 (€ 117.9 million). The refinancing of several existing Key Group Data 01.01. – 01.01.– + / -
loans at better terms led to a disproportionately low increase in interest in € million 30.09.2012 30.09.2011
expense, which had a positive impact on net finance costs.
Revenue 157.1 138.0 14%
EBIT 137.3 117.9 16%
Consequently, our consolidated profit rose nearly 25% to € 49.9 million.
This pushed earnings per share up to € 0.97; and EPRA earnings per Net finance costs -63.4 -58.9 -8%
share adjusted for valuation effects were 25% higher at € .00. Funds
1 Measurement gains / losses -2.8 -1.0
from operations (FFO) improved by 23% from € 1.10 to € 1.35 per share. EBT 71.1 58.0 22%
Consolidated profit 49.9 40.0 25%
In our interim first-half report in August we announced FFO per share (€) 1.35 1.10 23%
that we did not expect to acquire any new centers in EPRA * Earnings per share (€) 1.00 0.80 25%
the near future. However, the situation changed just 30.09.2012 31.12.2011 + / -
a few days later when we were offered a shopping Equity ** 1,451.7 1,473.1 -1%
Leather jacket from
center in Germany that would deliver our antic- Liabilities 1,790.9 1,752.0 2%
Marc Cain
ipated returns and meet our usual acquisition Total assets 3,242.6 3,225.1 1%
criteria. We are currently reviewing and negotiat- Equity ratio (%) ** 44.8 45.7
ing the details of this potential acquisition. LTV-ratio (%) 47 47
Gearing (%) ** 123 119
Much of Deutsche EuroShop’s internal
Cash and cash equivalents 88.2 64.4 37%
ca acities are currently dedicated to dealing
p
Slim jeans with the trade tax and interest barrier
from C&A issue. We believe we have found the * European Public Real Estate Association
right solution. ** incl. non controlling interests
Woven leather belt
from s.Oliver
2. / / / 2 DES Nine-month report 2012
Business and Economic Conditions Results of Operations,
Financial Position and Net Assets
Group structure and operating activities Increasing our shopping center shareholdings
With effect from 1 January 2012, Deutsche EuroShop AG acquired
Activities 5.1% of the Rathaus-Center Dessau KG, thus taking its shareholding
Deutsche EuroShop is the only public company in Germany to invest to 100%. The purchase price of € 5.9 million was paid in early 2012. In
solely in shopping centers in prime locations. As at the reporting date, addition, with effect from 1 January 2012, around 11% of the Allee-
it had investments in 19 shopping centers in Germany, Austria, Poland Center Hamm KG (purchase price € 8.9 million) and 0.1% of the Rhein-
and Hungary. The Group generates its reported revenue from rental Neckar-Zentrum KG (purchase price € .2 million) were acquired.
0
income on the space which it lets in the shopping centers. Deutsche EuroShop AG now holds 100% of the shares in these properties
as well. The purchase prices were paid at the end of 2011. These acqui-
Group’s legal structure sitions resulted in an excess of identified net assets acquired over cost of
Due to its lean personnel structure, the Deutsche EuroShop Group is acquisition in accordance with IFRS 3 in the amount of € 0.3 million,
centrally organised. The parent company, Deutsche EuroShop AG, is which were reported as an expenditure in measurement gains/losses.
responsible for corporate strategy, portfolio and risk management, financ-
ing and communication. Deutsche EuroShop AG founded DES Shoppingcenter KG with an
investment of € 10 thousand on 30 August 2012. The company was not
The Company’s registered office is in Hamburg. Deutsche EuroShop is yet operational in the third quarter of 2012.
a public company under German law. The individual shopping centers
are managed as separate companies and depending on the share of
nominal capital owned are either fully or proportionally consolidated or Results of Operations
accounted for using the equity method.
Revenue increased by 14%
The share capital amounts to € 1,631,400.00 and is composed of
5 Revenue amounted to € 57.1 million as at 30 September 2012. This
1
51,631,400 no-par value registered shares. The notional value of each represents an increase of just under 14% from the same period the
share is € 1.00. previous year (€ 138.0 million) which can be primarily attributed to the
higher revenue percentages contributed by the center expansions com-
pleted last year in Dresden, Wildau and Sulzbach as well as the acquisi-
Macroeconomic and sector-specific conditions tion of the Allee-Center in Magdeburg (1 October 2011). Revenue also
rose accordingly by 2.5% year-on-year.
The EU debt crisis has not eased over the last few months and has left
its mark on the real economy. Economic growth is tailing off noticeably. Operating and administrative costs for property: 10.2%
In its economic forecasts for Germany this year, the German govern- Center operating costs were € 6.0 million in the reporting period,
1
ment anticipates growth of only 0.8%. That puts its estimate far behind compared with € 5.0 million in the same period of the previous year.
1
the good growth rates experienced during the past two years when gross Costs therefore stood at 10.2% of revenue (previous year: 10.8%).
domestic product grew by more than 3%.
Other operating expenses of € 4.8 million
However, the German government expects the labour market to remain Other operating expenses amounted to € 4.8 million, slightly below the
stable. The key stimuli for 2012 are expected to come from domestic previous year’s level (€ 5.3 million) which is largely the result of lower
demand, and particularly from willingness to invest and private ancillary financing costs.
consumption. An inflation rate of around 2% is predicted.
EBIT up 16%
Retail sales developed positively in the reporting period. Following a Earnings before interest and tax (EBIT) increased by € 9.4 million
1
slightly lower figure at the beginning of the year, it rose over the last few (+16%) from € 17.9 million to € 37.3 million.
1 1
months. In the first nine months of 2012, German retail sales were 1.9%
higher in nominal terms than in the same period of the previous year. Net finance costs down € 4.5 million
At € 63.4 million, net finance costs fell by € 4.5 million. This can be
-
attributed to the fact that both the interest expense (€ 1.5 million) and
+
the profit share for third-party shareholders (€ 2.9 million) have risen
+
substantially as a result of the expansion measures.
3. / / / 3 DES Nine-month report 2012
Measurement gains/losses Financial Position and Net Assets
The measurement losses of € .9 million during the reporting period
2
stemmed from the excess of identified net assets acquired over cost of Net assets and liquidity
acquisition in accordance with IFRS 3 which resulted from the increase During the reporting period, the Deutsche EuroShop Group’s total
in shareholdings in our centers in Dessau, Hamm and Viernheim, as well assets increased by just € 7.5 million on the figure at the end of 2011
1
as investment costs incurred by the portfolio properties. to € 3,242.6 million. Non-current assets increased by € 5.4 million.
Receivables and other current assets, on the other hand, declined by
EBT excluding measurement gains / losses up 25% € 11.7 million. At € 88.1 million, cash and cash equivalents were € 23.7
Earnings before taxes (EBT) rose 22% from € 58.0 million to million higher than on 31 December 2011 (€ 4.4 million).
6
€ 71.1 million, while earnings before measurement increased from
59.1 million to € 73.9 million to end 25% higher than the same period Equity ratio of 44.8%
of the previous year. The equity ratio (incl. shares held by third-party shareholders) was down
as a result of the dividend paid in June. As at the reporting date, it
Tax ratio at 29.7% amounted to 44.8% compared with 45.7% as of 31 December 2011.
Income tax expenses rose from € 8.0 million to € 21.1 million due to
1
better performance. € 4.1 million of this was attributable to income taxes Liabilities
to be paid and € 17.0 million to deferred taxes. The tax ratio of 29.7% is Bank loans and overdrafts amounted to € 1,486.1 million on 30 Septem-
thus slightly lower than the previous year (31%). ber 2012, € 13.9 million higher than at the end of 2011. This is offset
by the significantly higher level of cash and cash equivalents amounting
25% increase in consolidated profit to € 23.7 million. Non-current deferred tax liabilities increased by
Consolidated profit amounted to € 49.9 million, € .9 million (+25%)
9 € 13.5 million to € 224.1 million due to additional provisions. Mean-
higher year-on-year. Earnings per share amounted to € 0.97, compared while, redemption entitlements for third-party shareholders fell by around
with € 0.78 last year. EPRA earnings per share rose 25% from € 0.80 € 6.5 million as a result of the increase in the shareholding in our properties
per share to € .00.
1 in Hamm, Viernheim and Dessau and dividend distributions. Other
liabilities and provisions increased by € 11.4 million.
Earnings per share
30.09.2012 30.09.2011
in € thousand Per share in € thousand Per share
Consolidated profit 49,938 0.97 40,028 0.78
Measurement gains/
losses 2,836 0.05 1,046 0.02
Deferred taxes -793 -0.02 -1 0.00
EPRA* earnings 51,981 1.00 41,072 0.80
* European Public Real Estate Association
Funds from operations (FFO) up 23%
FFO rose from € 56.8 million to € 69.8 million, or from € 1.10 to € 1.35
per share (+23%).
in € thousand 30.09.2012 30.09.2011 adjustment 30.09.2011
after
a
djustment
Consolidated profit 49,938 40,028 0 40,028
Measurement
gains/losses
Equity-accounted
associates 0
Measurement
gains/losses 2,836 1,298 -253 1,045
Deferred taxes 17,031 16,603 -834 15,769
FFO 69,805 57,929 -1,087 56,842
FFO per share 1.35 1.12 -0.02 1.10
4. / / / 4 DES Nine-month report 2012
130 130
120 120
The Shopping Center Share Our website also won an award: The Netfederation Investor Relation
110 110
Benchmark 2012 surveyed the IR web presence of 100 groups listed on
Following a year-end closing price of € 24.80 in 2011, a slight downward the major stock market indices using 111 criteria. Deutsche EuroShop
trend caused Deutsche EuroShop shares to hit € 23.72 on 12 January 2012, came top in the real estate category and was ranked fourth in the MDAX.
100
their lowest level for the period. In a positive environment, the price 100
Further information on the survey is available at www.ir-benchmark.de.
stabilised within a corridor of € 26 to € 27 between late January and mid-
April before surging upward at the start of May. It reached its highest Coverage
90
closing price of € 1.11 in the first nine months of 2012 on 7 August.
3 At present, 2690 financial analysts regularly follow Deutsche EuroShop’s
This was also a new all-time high. The price at the end of the reporting business performance and also publish studies including concrete invest-
period was € 29.00. Taking into account the dividend of € 1.10 per share ment recommendations. In September, Frankfurt-based analyst Indepen-
that we paid to our shareholders on 22 June 2012, this corresponds to dent Research began covering our stock. It issued a “hold” recommen-
a performance of 24.2% in the first nine months. The MDAX rose by dation with a price target of € 31.00. At the end of October, financial
23.4% over the same period. Deutsche EuroShop’s market capitalisation services institution LFG Kronos followed with an “accumulate” recom-
stood at € .5 billion at the end of the third quarter of 2012.
1 mendation and a price target of € 34.00. The majority of the investment
recommendations are currently neutral (17), with four analysts adopting
a negative position and five issuing positive opinions (as at 29 October
2012). Another analyst has also indicated that it would like to initiate
Deutsche EuroShop vs. MDAX and EPRA
Comparison, January to October 2012 coverage of our share in the future. A list of analysts and current reports
can be found at www.deutsche-euroshop.de/ir.
(indexed, base of 100, in %)
135
130
0 Analysts
125 Number
120
0 18
115 16
14
110
0 12
105
10
100 8
0
6
95
4
Jan Feb Mar Apr May Jun Jul Aug Sep Oct
0 2
Deutsche EuroShop EPRA MDAX 0
Sell Below Hold Above Buy
average average
Roadshows and conferences
From July to September, we presented Deutsche EuroShop at roadshows
in Amsterdam, Edinburgh and Copenhagen, and at conferences in Berlin
and Munich, where we also held various individual and group meetings
with institutional investors and analysts. In September we conducted
two property tours: We showed some 30 international investors the A10
Center in Wildau near Berlin together with Kempen Co., and with
Bankhaus Lampe we gave ten investors a behind-the-scenes look at the
Phoenix-Center in Hamburg-Harburg.
Awards for our investor relations activities
Our annual report won a bronze award at the EPRA Annual Report Best
Practice Recommendations Award 2011/2012. The Brussels-based Euro-
pean Public Real Estate Association (EPRA) represents the interests of
European real estate companies and campaigns for the standardisation of
reporting standards, particularly for listed real estate companies. If you are
interested in receiving a printed copy of our annual report, please send
an e-mail to info@deutsche-euroshop.de.
5. / / / 5 DES Nine-month report 2012
Key share data Report on Opportunities
and Outlook
Sector / industry group Financial services / Real estate
Share capital on 30.09.2012 € 51,631,400.00
Number of shares on 30.09.2012 51,631,400 Economic conditions
(no-par value registered shares)
Dividend 2011 (22.06.2012) € 1.10 The German Bundesbank estimates that the German economy could
Share price 30.12.2011 € 24.80 stagnate or even weaken slightly in the four quarter, following the consid-
Share price 28.09.2012 € 29.00 erable growth experienced in the preceding quarters. The earlier growth
Low/high in the period under review € 23,72 / € 31,11 was bolstered by consumer spending and net exports. The labour market
Market capitalisation on 30.09.2012 € 1,5 billion is currently buoyant thanks to stable domestic demand. However, there
Prime Standard Frankfurt and Xetra are signs that the deepening recession in some European member states
OTC trading Berlin-Bremen, Dusseldorf, will now also start to affect the German economy, which could find itself
H
amburg, Hanover, in stormy waters towards the end of the year. The recently published data
Munich and Stuttgart on industrial new orders have already indicated the same.
Indices MDAX, EPRA, GPR 250,
EPIX 30, MSCI Small Cap,
Following the US presidential elections, the impending government
EURO STOXX,
STOXX Europe 600,
spending cuts (fiscal cliff ) and the associated sharp tax increases in the
HASPAX, F.A.Z.-Index USA could put the new government and the global economy to the test
ISIN DE 000748 020 4 early next year.
Ticker symbol DEQ, Reuters: DEQGn.DE
Inflation is likely to remain at around the 2% mark this year. After briefly
dipping below 2% in the summer months, it returned to 2% in October.
This is largely attributable to higher oil and petrol prices, which are again
Report on Events after approaching their historic peaks.
the Balance Sheet Date
Due to our good operational position, we expect Deutsche EuroShop’s
No further significant events occurred between the balance sheet date business to perform positively and according to plan this year.
and the date of preparation of the financial statements.
Expected Results of Operations and Financial
Risk Report Position
There have been no significant changes since the beginning of the financial Forecast confirmed
year with regard to the risks associated with future business development. We stand by our forecasts for financial year 2012, as published in May,
We do not believe the Company faces any risks capable of jeopardising its and expect:
continued existence. The information provided in the risk report of the
consolidated financial statements as at 31 December 2011 is therefore still • evenue of between € 207 million and € 211 million
r
applicable. • arnings before interest and taxes (EBIT) of between
e
€ 177 million and € 181 million
• arnings before tax (EBT) excluding measurement gains/losses
e
of between € 94 million and € 97 million and
• unds from operations (FFO) per share of between
f
€ 1.70 and € 1.74.
Dividend policy
We intend to maintain our long-term dividend policy geared towards
continuity. A slight increase in dividends (previously € 1.10 per share) is
likely for the 2012 financial year.
6. / / / 6 DES Nine-month report 2012
Consolidated balance sheet
Assets
in € thousand 30.09.2012 31.12.2011
Assets
Non-current assets
Intangible assets 18 20
Property, plant and equipment 119 137
Investment properties 3,113,554 3,106,832
Non-current financial assets 26,416 27,815
Investments in equity-accounted associates 4,735 4,514
Other non-current assets 331 459
Non-current assets 3,145,173 3,139,777
Current assets
Trade receivables 2,764 5,606
Other current assets 6,492 15,334
Cash and cash equivalents 88,160 64,408
Current assets 97,416 85,348
Total assets 3,242,589 3,225,125
Equity and liabilities
in € thousand 30.09.2012 31.12.2011
Equity and liabilities
Equity and reserves
Issued capital 51,631 51,631
Capital reserves 890,482 890,482
Retained earnings 235,999 250,928
Total equity 1,178,112 1,193,041
Non-current liabilities
Bank loans and overdrafts 1,417,364 1,335,986
Deferred tax liabilities 224,129 210,587
Right to redeem of limited partners 273,562 280,078
Other liabilities 48,808 38,451
Non-current liabilities 1,963,863 1,865,102
Current liabilities
Bank loans and overdrafts 68,731 136,163
Trade payables 2,419 2,835
Tax liabilities 8,693 5,935
Other provisions 6,974 8,859
Other liabilities 13,797 13,190
Current liabilities 100,614 166,982
Total equity and liabilities 3,242,589 3,225,125
7. / / / 7 DES Nine-month report 2012
Consolidated income statement
in € thousand 01.07. – 30.09.2012 01.07. – 30.09.2011
after djustment
a
Revenue 52,638 46,891
Property operating costs -2,508 -2,337
Property management costs -2,637 -3,034
Net operating income (NOI) 47,493 41,520
Other operating income 271 97
Other operating expenses -1,652 -2,039
Earnings before interest and taxes (EBIT) 46,112 39,578
Income from investments 1 1
Interest income 63 226
Interest expense -16,820 -16,609
Profit/loss attributable to limited partners -4,546 -3,709
Net finance costs -21,302 -20,091
Measurement gains/losses -969 -255
of which excess of identified net assets acquired over cost of acquisition in accordance with IFRS 3:
-€308 thousand (previous year: €7,297 thousand)
Earnings before tax (EBT) 23,841 19,232
Income tax expense -6,481 -6,414
Consolidated profit 17,360 12,818
Earnings per share (€), basic 0.34 0.25
Earnings per share (€), diluted 0.34 0.25
in € thousand 01.01. – 30.09.2012 01.01. – 30.09.2011 01.01. – 30.09.2011 01.01. – 30.09.2011
before djustment
a adjustment after djustment
a
Revenue 157,114 137,984 137,984
Property operating costs -8,037 -6,765 -6,765
Property management costs -8,004 -8,187 -8,187
Net operating income (NOI) 141,073 123,032 0 123,032
Other operating income 1,036 242 242
Other operating expenses -4,775 -5,340 -5,340
Earnings before interest and taxes (EBIT) 137,334 117,934 0 117,934
Income from investments 1 1 1
Interest income 360 603 603
Interest expense -49,731 -48,236 -48,236
Profit/loss attributable to limited partners -14,078 -11,219 -11,219
Net finance costs -63,448 -58,851 0 -58,851
Measurement gains/losses -2,836 -1,298 253 -1,045
Earnings before tax (EBT) 71,050 57,785 253 58,038
Income tax expense -21,112 -17,757 -253 -18,010
Consolidated profit 49,938 40,028 0 40,028
Earnings per share (€), basic 0.97 0.78 0.00 0.78
Earnings per share (€), diluted 0.97 0.78 0.00 0.78
8. / / / 8 DES Nine-month report 2012
Consolidated statement of comprehensive income
in € thousand 01.07. – 30.09.2012 01.07. – 30.09.2011 01.01. – 30.09.2012 01.01. – 30.09.2011
Consolidated profit 17,360 12,818 49,938 40,028
Changes due to currency translation effects 0 -606 0 -578
Changes in cash flow hedge -4,655 -17,105 -11,415 -14,507
Deferred taxes on changes in value offset
directly against equity 1,505 2,780 3,343 2,412
Total earnings recognised directly in equity -3,150 -14,931 -8,072 -12,673
Total profit 14,210 -2,113 41,866 27,355
Share of Group shareholders 14,210 -2,113 41,866 27,355
Consolidated cash flow statement
in € thousand 01.01. – 30.09.2012 01.01. – 30.09.2011
Profit after tax 49,938 40,028
Expenses / income from the application of IFRS 3 308 -7,297
Profit / loss attributable to limited partners 13,994 11,219
Depreciation of property, plant and equipment 29 25
Expenses from investment activities to be allocated to the cash flow 0 8,338
Other non-cash income / expenses -616 -5
Deferred taxes 17,031 15,769
Operating cash flow 80,684 68,077
Changes in receivables* 11,720 158,821
Changes in current provisions 873 -1,180
Changes in liabilities -187 -2,327
Cash flow from operating activities 93,090 223,391
Payments to acquire property, plant and equipment / investment properties -6,727 -56,636
Expenses from investment activities to be allocated to the cash flow* 0 -8,338
Payments to acquire shareholdings in consolidated companies and business units 0 -148,375
Inflows for equity-accounted companies 0 1
Inflows / outflows to / from the financial assets 1,179 781
Cash flow from investing activities -5,548 -212,567
Changes in interest-bearing financial liabilities 13,947 84,660
Payments to Group shareholders -56,795 -56,795
Payments to third-party shareholders -20,942 -18,268
Cash flow from financing activities -63,790 9,597
Net change in cash and cash equivalents 23,752 20,421
Cash and cash equivalents at beginning of period 64,408 65,784
Currency-related changes 0 -783
Cash and cash equivalents at end of period 88,160 85,422
* he purchase price including the ancillary acquisition costs (€ 156.7 million) for the acquisition of the Billstedt-Center Hamburg
T
was recognised in the cash flow from operating activities in 2010. In order to achieve a meaningful cross-period presentation of
this transaction, changes to the prior year’s figures connected with the the initial consolidation are recognised gross.
9. / / / 9 DES Nine-month report 2012
Statement of changes in equity
in € thousand Number Share Capital Other retained Statutory Total
of hares
s capital reserves earnings r
eserve
o
utstanding
01.01.2011 51,631,400 51,631 890,615 219,491 2,000 1,163,737
Change in cash flow hedge -14,507 -14,507
Change due to currency translation
effects -578 -578
Change in deferred taxes 2,412 2,412
Total earnings recognised directly
in equity 0 0 -12,673 0 -12,673
Consolidated profit 40,028 40,028
Total profit 27,355 27,355
Dividend payment -56,795 -56,795
Trade tax
(IAS 8 – Error Corrections) 485 2,373 2,858
30.09.2011 51,631,400 51,631 890,615 192,424 2,000 1,137,155
01.01.2012 51,631,400 51,631 890,482 248,928 2,000 1,193,041
Change in cash flow hedge -11,415 -11,415
Change in deferred taxes 3,343 3,343
Total earnings recognised
directly n equity
i 0 0 -8,072 0 -8,072
Consolidated profit 49,938 49,938
Total profit 0 0 41,866 0 41,866
Dividend payments -56,795 -56,795
30.09.2012 51,631,400 51,631 890,482 233,999 2,000 1,178,112
Disclosures
Reporting principles Adjustment of previous year’s values in accordance
These interim financial statements of the Deutsche EuroShop Group with IAS 8 (correction of an error)
as at 30 September 2012 have been prepared in accordance with Inter Following the adjustment of the previous year’s figures in the third quarter
national Financial Reporting Standards (IFRS). of 2011 in light of trade tax risks for the first time and the creation of
trade tax provisions, further trade tax provisions of € 2.4 million for nega-
The management report and the abridged financial statements were tive interest rate hedges and the cost of the capital increase, which were
not audited in accordance with section 317 of the Handelsgesetzbuch not included in the quarterly financial statements as at 30 September
(HGB – German Commercial Code), nor were they reviewed by a 2011, have now been recognised in equity in accordance with IAS 8.41 ff
person qualified to carry out audits. In the opinion of the Executive (correction of an error).
Board, the report contains all of the necessary adjustments required to
give a true and fair view of the results of operations as at the date of Please also refer to the detailed explanations provided in the published
the interim report. The performance for the first nine months up to consolidated financial statements for 2011.
30 September 2012 is not necessarily an indication of future performance.
The accounting policies applied correspond to those used in the last
consolidated financial statements as at the end of the financial year.
A detailed description of the methods applied was published in the notes
to the consolidated financial statements for 2011.
10. / / / 10 DES Nine-month report 2012
Segment reporting in € thousand Domestic International Total
As a holding company, Deutsche EuroShop AG holds equity interests Segment assets 2,892,205 350,384 3,242,589
in shopping centers in the European Union. The investees are pure (previous year’s figures) (2,874,224) (350,901) (3,225,125)
shelf companies without staff of their own. Operational management is of which investment
contracted out to external service providers under agency agreements, properties 2,770,071 343,483 3,113,554
meaning that the companies‘ activities are exclusively restricted to asset (previous year’s figures) (2,763,626) (343,206) (3,106,832)
management. The companies are operated individually.
Due to the Company‘s uniform business activities within a relatively
homogeneous region (the European Union), and in accordance with Other disclosures
IFRS 8.12, separate segment reporting is presented in the form of a
breakdown by domestic and international results. Dividend
A dividend of € .10 per share was distributed for the financial year
1
As the Group’s main decision-making body, the Deutsche EuroShop 2011 on 22 June 2012.
AG Executive Board largely assesses the performance of the segments
based on the EBIT of the individual property companies. The valuation Responsibility statement by the Executive Board
principles for the segment reporting correspond to those of the Group. To the best of our knowledge, and in accordance with the applicable
Intra-Group activities between the segments are eliminated in the reporting principles for interim financial reporting, the interim con-
reconciliation statement. solidated financial statements give a true and fair view of the assets,
liabilities, financial position and profit or loss of the Group, and the
In view of the geographical segmentation, no further information interim management report of the Group includes a fair review of the
pursuant to IFRS 8.33 is given. development and performance of the business and the position of the
Group, together with a description of the principal opportunities and risks
The previous year’s figures have been restated in the reconciliation associated with the expected development of the Group for the remainder
statement for interest income and earnings before tax (EBT). of the financial year.
Breakdown by geographical segment Hamburg, November 2012
in € thousand Domestic Inter Recon Total
national ciliation
Revenue 139,644 17,470 0 157,114
(previous year’s
figures) (120,890) (17,094) (0) (137,984) Claus-Matthias Böge Olaf Borkers
in € thousand Domestic Inter Recon Total
national ciliation
EBIT 125,661 15,890 -4,217 137,334
(previous year’s
figures) (106,422) (15,132) -(3,620) (117,934)
in € thousand Domestic Inter Recon Total
national ciliation
Net interest income -42,083 -5,841 -1,446 -49,370
(previous year’s
figures) -(41,105) -(5,722) -(806) -(47,633)
in € thousand Domestic Inter Recon Total
national ciliation
Earnings before tax
(EBT) 71,950 8,248 -9,148 71,050
(previous year’s
figures) (58,714) (7,903) -(8,579) (58,038)
11. Financial calendar
2012 2013
13.11. Nine-month report 2012 10. – 1.01.
1 Oddo Midcap Forum, Lyon
14.11. DZ BANK Equity Conference, Frankfurt 03. – 04.04. Deutsche Bank VIP Real Estate Event, Frankfurt
15.11. Roadshow Paris, Metzler 11. – 2.04.
1 Lampe Deutschland Conference, Baden-Baden
20.11. Roadshow Stockholm 26.04. Publication of the Annual Report 2012
21.11. Roadshow Helsinki, Berenberg 15.05. Interim report Q1 2013
29.11. Roadshow Zurich, Deutsche Bank 06. – 07.06. M.M. Warburg Highlights Conference, Hamburg
30.11. Roadshow Geneva, Deutsche Bank 20.06. Annual General Meeting, Hamburg
14.08. Interim report H1 2013
13.11. Nine-month report 2013
Our financial calendar is updated continuously. Please check our website for the latest events:
http://www.deutsche-euroshop.com/ir.
Stadt-Galerie
Passau
la ns
Investor Rect tio
Con ta
icolas Lissner
Patrick Kiss and N 79 20 / -22
Tel.: +49 (0)40 - 41 35
79 29
Fax: +49 (0)40 - 41 35
ch e-euroshop.com
E-mail: ir@deuts
e-euroshop.com/ir
Inter net: www.deutsch
Patrick K
iss and N
icolas Lis
sner