
Recommended
More Related Content
Similar to Predicting wellbeing at neighbourhood level
Similar to Predicting wellbeing at neighbourhood level (20)
Predicting wellbeing at neighbourhood level
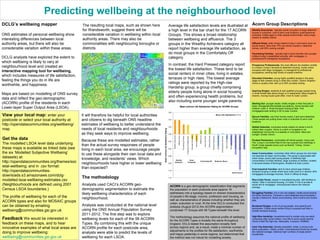
- 1. Predicting wellbeing at the neighbourhood level Average life satisfaction levels are illustrated at a high level in the bar chart for the 17 ACORN Groups. This shows a broad relationship between wellbeing and affluence. The 3 groups in the Wealthy Achievers category all report higher than average life satisfaction, as do most groups in the Comfortably Off category. DCLG analysts have explored the extent to which wellbeing is likely to vary at neighbourhood level and created an interactive mapping tool for wellbeing, which includes measures of life satisfaction, feeling the things you do in life are worthwhile, and happiness. In contrast, the Hard Pressed category report the lowest life satisfaction. These tend to be social renters in inner cities, living in estates, terraces or high rises. The lowest average ratings were reported by the High-rise Hardship group, a group chiefly comprising elderly people living alone in social housing and often experiencing health problems, but also including some younger single parents. Maps are based on modelling of ONS survey data and reflect the geo-demographic (ACORN) profile of the residents in each Lower-layer Super Output Area (LSOA). The profile of wellbeing for each of the ACORN types and also for MOSAIC groups can be obtained by emailing wellbeing@communities.gsi.gov.uk Feedback We would be interested in feedback on these maps, and to hear innovative examples of what local areas are doing to improve wellbeing: wellbeing@communities.gsi.gov.uk Inner City Adversity High-Rise Hardship Burdened Singles Blue-Collar Roots Struggling Families Asian Communities Post-Industrial Families Secure Families Settled Suburbia Prudent Pensioners -0.4 Starting Out -0.2 Aspiring Singles Because these are modelled estimates, rather than the actual survey responses of people living in each local area, we encourage people to use these alongside their own local data and knowledge, and residents’ views. Which neighbourhoods have higher or lower wellbeing than expected? 0.0 Wealthy Achievers Urban Prosperity Comfortably Off Moderate Means -1.0 Hard Pressed The methodology Analysts used CACI’s ACORN geodemographic segmentation to estimate the likely wellbeing characteristics of each neighbourhood. Analysis was conducted at the national level using the ONS Annual Population Survey 2011-2012. The first step was to explore wellbeing levels for each of the 56 ACORN Types. By combining this with the unique ACORN profile for each postcode area, analysts were able to predict the levels of wellbeing for each LSOA. Wealthy Executives: typically owner-occupiers of large detached houses in suburban, rural & semi-rural locations; public/grammar schooled; middle-aged or older people predominate; many empty nesters & wealthy retired. Affluent Greys: older empty-nesters living in rural towns (such as tourist towns). More than 70% are retired couples in detached homes, with 60% owning outright. Flourishing Families: typically high-income families with younger children living in established suburbs, with mortgages; in professional & managerial occupations. Prosperous Professionals: the most affluent city dwellers (chiefly in London); living in terraced & detached housing, mostly owner occupiers with large mortgages; in managerial & professional occupations, working high levels of unpaid overtime. Educated Urbanites: young highly qualified people in the early stage of their careers living in cities like London, Oxford, Brighton. Home is usually a flat, with up to 50% privately renting. Aspiring Singles: students & well qualified younger people living in small rented flats above shops or in basements. Many singles & sharers, moving house quite often. Inner & Outer London. Starting Out: younger adults; chiefly singles in their first jobs in lower managerial/intermediate occupations. Some families with children under 5. Small terraced housing & flats. First mortgage/private renting in SE & outer London. Settled Suburbia: comprises empty nesters at career’s end & retired older couples. Home is a semi or bungalow in an established community in a seaside or rural place. Most own outright. Dorset, Devon. Prudent Pensioners: comfortably-off retired people, many over75s. Living in converted flats & low-rise purpose built dwellings in South Coast seaside towns such as Bexhill, Torbay. Owner– occupation high. Asian Communities: comprises other ethnic groups too and does not describe all Asian communities. This group is associated with urban areas, poorly paid young people, a relatively high concentration of Asian families, large numbers of children, located in terraced streets of Birmingham, Bradford & East London. -0.6 -0.8 Acorn Group Descriptions Secure Families: own their homes mainly 3 bed semi-detached. These people are putting down roots in suburban & semi-rural locations. 0.2 Educated Urbanites The modelled LSOA level data underlying these maps is available as linked data (see the six ‘Modelled Subjective Wellbeing’ datasets) at: http://opendatacommunities.org/themes/soc ietal-wellbeing; and in .csv format: http://opendatacommunitiesdownloads.s3.amazonaws.com/dclgmodelled-lsoa-wellbeing-estimates.csv (Neighbourhoods are defined using 2001 Census LSOA boundaries.) Mean Life Satisfaction = 7.4 0.4 Prosperous Professionals Get the data 0.6 Affluent Greys postcode or select your local authority at: http://opendatacommunities.org/wellbeing/ map It will therefore be helpful for local authorities and citizens to dig beneath ONS headline estimates of wellbeing to better understand the needs of local residents and neighbourhoods as they seek ways to improve wellbeing. Mean-centred Life Satisfaction Rating View your local map: enter your Mean-centred Life Satisfaction Rating for ACORN Groups Flourishing Families ONS estimates of personal wellbeing show interesting differences between local authority areas, but there will also be considerable variation within these areas. The resulting local maps, such as shown here for Wandsworth, suggest there will be considerable variation in wellbeing within local authority areas. There may also be commonalities with neighbouring boroughs or districts. Wealthy Executives DCLG’s wellbeing mapper -1.2 ACORN is a geo-demographic classification that segments the population in each postcode area (approx 16 addresses) into a typology based on shared characteristics of people’s life-stage, income, profession and housing, as well as characteristics of places including whether they are urban, suburban or rural. At the time DCLG conducted this analysis (August 2012) the ACORN segmentation comprised 17 Groups with 56 Types beneath this level. The methodology assumes the national profile of wellbeing for the ACORN Types is broadly the same throughout England. DCLG tested this assumption broadly held across regions and, as a result, made a minimal number of adjustments to the profiles for life satisfaction, worthwhile, and happy yesterday in some regions, but determined that the method was not robust for modelling anxiety. Post-Industrial Families: tend to have school-age children; terraced housing in areas where blue collar work is in decline; 60% mortgagees & average incomes. Work in offices & shops. Blue-Collar Roots: people in manufacturing jobs, with families or retired. Often in terraced housing, 2-3 beds. A mix of private & social rent & mortgages. Unemployment above the national average. Struggling Families: live in low rise estates; chiefly social tenants but some ownership. Terraced or semi-detached accommodation usually 2 bedrooms. Some overcrowding. Semi-routine and routine jobs. Burdened Singles: a mix of young people, lone parents and pensioners. Chiefly social renters living in purpose built flats or smaller terraced housing. High-Rise Hardship: households tend to contain only one adult; comprises older social renters, over 65s & some single parents. Home is 60s/70s high-rise. Newcastle, Liverpool, Sheffield. Inner City Adversity: densely populated areas; a young multiethnic population, chiefly London. Unemployment levels are double the national average; relatively high numbers of single parent households.