Weitere ähnliche Inhalte
Ähnlich wie Analyst Note July 2013
Ähnlich wie Analyst Note July 2013 (20)
Analyst Note July 2013
- 1. 1
J.D.
Power
does
not
guarantee
the
accuracy,
adequacy,
or
completeness
of
any
information
contained
in
this
publication
and
is
not
responsible
for
any
errors
or
omissions
or
for
the
results
obtained
from
use
of
such
information.
Advertising
claims
cannot
be
based
on
information
published
in
this
publication.
Reproduction
of
any
material
contained
in
this
publication,
including
photocopying
in
part
or
in
whole,
is
prohibited
without
the
express
written
permission
of
J.D.
Power.
Any
material
quoted
from
this
publication
must
be
attributed
to
J.D.
Power.
©
2013
J.D.
Power
and
Associates,
McGraw
Hill
Financial.
All
Rights
Reserved.
Canada
July
30,
2013
1
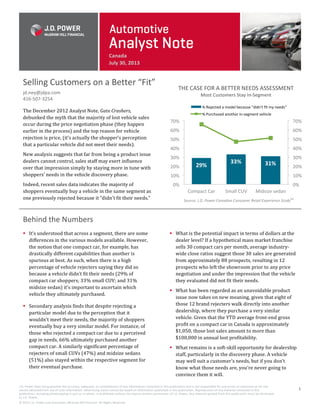
§ It’s
understood
that
across
a
segment,
there
are
some
differences
in
the
various
models
available.
However,
the
notion
that
one
compact
car,
for
example,
has
drastically
different
capabilities
than
another
is
spurious
at
best.
As
such,
when
there
is
a
high
percentage
of
vehicle
rejecters
saying
they
did
so
because
a
vehicle
didn’t
fit
their
needs
(29%
of
compact
car
shoppers;
33%
small
CUV;
and
31%
midsize
sedan)
it’s
important
to
ascertain
which
vehicle
they
ultimately
purchased.
§ Secondary
analysis
finds
that
despite
rejecting
a
particular
model
due
to
the
perception
that
it
wouldn’t
meet
their
needs,
the
majority
of
shoppers
eventually
buy
a
very
similar
model.
For
instance,
of
those
who
rejected
a
compact
car
due
to
a
perceived
gap
in
needs,
66%
ultimately
purchased
another
compact
car.
A
similarly
significant
percentage
of
rejecters
of
small
CUVs
(47%)
and
midsize
sedans
(51%)
also
stayed
within
the
respective
segment
for
their
eventual
purchase.
2
§ What
is
the
potential
impact
in
terms
of
dollars
at
the
dealer
level?
If
a
hypothetical
mass
market
franchise
sells
30
compact
cars
per
month,
average
industry-‐
wide
close
ratios
suggest
those
30
sales
are
generated
from
approximately
88
prospects,
resulting
in
12
prospects
who
left
the
showroom
prior
to
any
price
negotiation
and
under
the
impression
that
the
vehicle
they
evaluated
did
not
fit
their
needs.
§ What
has
been
regarded
as
an
unavoidable
product
issue
now
takes
on
new
meaning,
given
that
eight
of
those
12
brand
rejecters
walk
directly
into
another
dealership,
where
they
purchase
a
very
similar
vehicle.
Given
that
the
YTD
average
front-‐end
gross
profit
on
a
compact
car
in
Canada
is
approximately
$1,050,
those
lost
sales
amount
to
more
than
$100,000
in
annual
lost
profitability.
§ What
remains
is
a
soft-‐skill
opportunity
for
dealership
staff,
particularly
in
the
discovery
phase.
A
vehicle
may
well
suit
a
customer’s
needs,
but
if
you
don’t
know
what
those
needs
are,
you’re
never
going
to
convince
them
it
will.
Behind
the
Numbers
Selling
Customers
on
a
Better
“Fit”
jd.ney@jdpa.com
416-‐507-‐3254
The
December
2012
Analyst
Note,
Gate
Crashers,
debunked
the
myth
that
the
majority
of
lost
vehicle
sales
occur
during
the
price
negotiation
phase
(they
happen
earlier
in
the
process)
and
the
top
reason
for
vehicle
rejection
is
price,
(it’s
actually
the
shopper’s
perception
that
a
particular
vehicle
did
not
meet
their
needs).
New
analysis
suggests
that
far
from
being
a
product
issue
dealers
cannot
control,
sales
staff
may
exert
influence
over
that
impression
simply
by
staying
more
in
tune
with
shoppers’
needs
in
the
vehicle
discovery
phase.
Indeed,
recent
sales
data
indicates
the
majority
of
shoppers
eventually
buy
a
vehicle
in
the
same
segment
as
one
previously
rejected
because
it
“didn’t
fit
their
needs.”
THE
CASE
FOR
A
BETTER
NEEDS
ASSESSMENT
Most
Customers
Stay
In-‐Segment
Source:
J.D.
Power
Canadian
Consumer
Retail
Experience
Study
SM
29%
33%
31%
0%
10%
20%
30%
40%
50%
60%
70%
0%
10%
20%
30%
40%
50%
60%
70%
Compact
Car
Small
CUV
Midsize
sedan
%
Rejected
a
model
because
"didn't
fit
my
needs"
%
Purchased
another
in-‐segment
vehicle
- 2. 2
Brian Murphy
416-507-3253 ▪ brian.murphy1@jdpa.com
July 30, 2013
J.D.
Power
&
Associates
does
not
guarantee
the
accuracy,
adequacy,
or
completeness
of
any
information
contained
in
this
publication
and
is
not
responsible
for
any
errors
or
omissions
or
for
the
results
obtained
from
use
of
such
information.
Advertising
claims
cannot
be
based
on
information
published
in
this
publication.
Reproduction
of
any
material
contained
in
this
publication,
including
photocopying
in
part
or
in
whole,
is
prohibited
without
the
express
written
permission
of
J.D.
Power
&
Associates.
Any
material
quoted
from
this
publication
must
be
attributed
to
J.D.
Power
&
Associates.
©
2013
J.D.
Power
&
Associates,
McGraw
Hill
Financial.
All
Rights
Reserved.
6120
19
4849
3
New Vehicles Used Vehicles
Cash Lease Loan
48
53
58
63
68
Jun-12
Jul-12
Aug-12
Sep-12
Oct-12
Nov-12
Dec-12
Jan-13
Feb-13
Mar-13
Apr-13
May-13
Jun-13
New Used
$465
$485
$505
$525
$545
$565
Jun-12
Jul-12
Aug-12
Sep-12
Oct-12
Nov-12
Dec-12
Jan-13
Feb-13
Mar-13
Apr-13
May-13
Jun-13
New Lease New Loan
Percent of Total Transactions (Past 12 Months)
Average per Customer
72 Months and Greater
63%
0%
10%
20%
30%
40%
50%
60%
70%
2008
2009
2010
2011
2012
2013
Data from JDPA PIN Incentive Spending Report (ISR)
20%
30%
40%
50%
Jun-12
Jul-12
Aug-12
Sep-12
Oct-12
Nov-12
Dec-12
Jan-13
Feb-13
Mar-13
Apr-13
May-13
Jun-13
% Negative Equity Trade-In %
Percentage of negative equity vehicles at trade-in
$27,000
$28,000
$29,000
$30,000
$31,000
$32,000
Jun-12
Jul-12
Aug-12
Sep-12
Oct-12
Nov-12
Dec-12
Jan-13
Feb-13
Mar-13
Apr-13
May-13
Jun-13
Vehicle Price Transaction Price