More Related Content
Similar to Analyst Note January
Similar to Analyst Note January (20)
Analyst Note January
- 1. CANADA
CANADA February28 , 2013
January 14, 2011
Beyond Closing Rates
jd_ney@jdpa.com
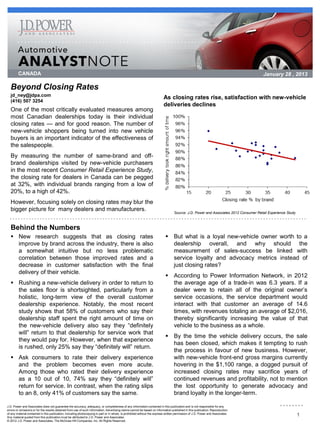
As closing rates rise, satisfaction with new-vehicle
(416) 507 3254
deliveries declines
One of the most critically evaluated measures among
most Canadian dealerships today is their individual
closing rates — and for good reason. The number of
new-vehicle shoppers being turned into new vehicle
buyers is an important indicator of the effectiveness of
the salespeople.
By measuring the number of same-brand and off-
brand dealerships visited by new-vehicle purchasers
in the most recent Consumer Retail Experience Study,
the closing rate for dealers in Canada can be pegged
at 32%, with individual brands ranging from a low of
20%, to a high of 42%.
However, focusing solely on closing rates may blur the
bigger picture for many dealers and manufacturers.
Source: J.D. Power and Associates 2012 Consumer Retail Experience Study
Behind the Numbers
New research suggests that as closing rates But what is a loyal new-vehicle owner worth to a
improve by brand across the industry, there is also dealership overall, and why should the
a somewhat intuitive but no less problematic measurement of sales-success be linked with
correlation between those improved rates and a service loyalty and advocacy metrics instead of
decrease in customer satisfaction with the final just closing rates?
delivery of their vehicle.
According to Power Information Network, in 2012
Rushing a new-vehicle delivery in order to return to the average age of a trade-in was 6.3 years. If a
the sales floor is shortsighted, particularly from a dealer were to retain all of the original owner’s
holistic, long-term view of the overall customer service occasions, the service department would
dealership experience. Notably, the most recent interact with that customer an average of 14.6
study shows that 58% of customers who say their times, with revenues totaling an average of $2,016,
dealership staff spent the right amount of time on thereby significantly increasing the value of that
the new-vehicle delivery also say they “definitely vehicle to the business as a whole.
will” return to that dealership for service work that
By the time the vehicle delivery occurs, the sale
they would pay for. However, when that experience
has been closed, which makes it tempting to rush
is rushed, only 25% say they “definitely will” return.
the process in favour of new business. However,
Ask consumers to rate their delivery experience with new-vehicle front-end gross margins currently
and the problem becomes even more acute. hovering in the $1,100 range, a dogged pursuit of
Among those who rated their delivery experience increased closing rates may sacrifice years of
as a 10 out of 10, 74% say they “definitely will” continued revenues and profitability, not to mention
return for service. In contrast, when the rating slips the lost opportunity to generate advocacy and
to an 8, only 41% of customers say the same. brand loyalty in the longer-term.
J.D. Power and Associates does not guarantee the accuracy, adequacy, or completeness of any information contained in this publication and is not responsible for any
errors or omissions or for the results obtained from use of such information. Advertising claims cannot be based on information published in this publication. Reproduction
of any material contained in this publication, including photocopying in part or in whole, is prohibited without the express written permission of J.D. Power and Associates.
Any material quoted from this publication must be attributed to J.D. Power and Associates.
1
© 2012 J.D. Power and Associates, The McGraw-Hill Companies, Inc. All Rights Reserved.
- 2. Brian Murphy ▪ 416-507-3253 ▪ brian_murphy1@jdpa.com February 28, 2013
January 14, 2011
Vehicle Purchase Type
Percent of Total Transactions (Last 12 Months) Days to Turn
New Used
New Vehicles Used Vehicles
70
3 66
18 62
47 58
21 61 50
54
50
Jan-12
Jun-12
Feb-12
Dec-11
May-12
Jul-12
Oct-12
Nov-12
Dec-12
Mar-12
Sep-12
Aug-12
Apr-12
Cash Lease Loan
Monthly Payments Vehicle Price versus Customer Facing Vehicle Price*
Average per Customer *Data from JDPA PIN Incentive Spending Report (ISR)
New Lease New Loan Vehicle Price Customer Facing Transaction Price
$32,000
$560 $31,000
$30,000
$540
$29,000
$520 $28,000
$27,000
$500
$26,000
$480 $25,000
Jan-12
Feb-12
Jun-12
Dec-11
Mar-12
May-12
Jul-12
Oct-12
Nov-12
Dec-12
Dec-11
Jan-12
Feb-12
Jun-12
Jul-12
Sep-12
Nov-12
Dec-12
Mar-12
May-12
Oct-12
Sep-12
Aug-12
Apr-12
Aug-12
Apr-12
Percent New-Vehicle Loan Term Percent Negative Equity + Trade-In
72 Months and Greater Percentage of negative equity vehicles at trade-in
% Negative Equity Trade-In %
70% 50%
58%
60%
50% 40%
40%
30% 30%
20%
10% 20%
Jan-12
Jun-12
Feb-12
Dec-11
May-12
Jul-12
Oct-12
Nov-12
Dec-12
Mar-12
Sep-12
Aug-12
Apr-12
0%
2007
2008
2009
2010
2011
2012
J.D. Power and Associates does not guarantee the accuracy, adequacy, or completeness of any information contained in this publication and is not responsible for any
errors or omissions or for the results obtained from use of such information. Advertising claims cannot be based on information published in this publication. Reproduction
of any material contained in this publication, including photocopying in part or in whole, is prohibited without the express written permission of J.D. Power and Associates.
Any material quoted from this publication must be attributed to J.D. Power and Associates.
2
© 2012 J.D. Power and Associates, The McGraw-Hill Companies, Inc. All Rights Reserved.